
Clinical Research and Public HealthImmunologyNephrologyVirology
Open Access |  10.1172/jci.insight.198227
Single-cell profiling reveals epithelial and immune responses in BK polyomavirus–infected human kidney biopsies
Tess Marvin,1,2 Rachel Sealfon,3 Phillip J. McCown,4 Fadhl AlAkwaa,4 Evan A. Farkash,5 Edgar A. Otto,4 Felix Eichinger,4 Paul G. Cantalupo,6 Ping An,6 Rajasree Menon,7 Celine C. Berthier,4 Tavis J. Reed,1,2 Paula Arrowsmith,5 Lalita Subramanian,4 Kelly J. Shaffer,4 Silas P. Norman,4 Ramnika Gumber,4 Michael J. Imperiale,8 James M. Pipas,6 Olga G. Troyanskaya,1,2,3 Matthias Kretzler,4,7 Chandra L. Theesfeld,1,2 and Abhijit S. Naik4
1Lewis-Sigler Institute for Integrative Genomics and
2Princeton Precision Health Initiative, Princeton University, Princeton, New Jersey, USA.
3Center for Computational Biology, Flatiron Institute, New York, New York, USA.
4Department of Internal Medicine, Division of Nephrology, and
5Department of Pathology, University of Michigan, Ann Arbor, Michigan, USA.
6Department of Biological Sciences, University of Pittsburgh, Pittsburgh, Pennsylvania, USA.
7Department of Computational Medicine and Bioinformatics and
8Department of Microbiology and Immunology and Rogel Cancer Center, University of Michigan, Ann Arbor, Michigan, USA.
Address correspondence to: Abhijit S. Naik, Department of Internal Medicine Division of Nephrology, F6676, 1150 UHS, 1500 E, Medical Center Drive, Ann Arbor, Michigan, 48109, USA. Phone: 734.763.0990; Email: abhinaik@umich.edu.
Authorship note: TM, RS, and PJM contributed equally to this work and have been designated as co–first authors. CLT and ASN contributed equally to this work and have been designated as co–senior authors.
Find articles by Marvin, T. in: PubMed | Google Scholar
1Lewis-Sigler Institute for Integrative Genomics and
2Princeton Precision Health Initiative, Princeton University, Princeton, New Jersey, USA.
3Center for Computational Biology, Flatiron Institute, New York, New York, USA.
4Department of Internal Medicine, Division of Nephrology, and
5Department of Pathology, University of Michigan, Ann Arbor, Michigan, USA.
6Department of Biological Sciences, University of Pittsburgh, Pittsburgh, Pennsylvania, USA.
7Department of Computational Medicine and Bioinformatics and
8Department of Microbiology and Immunology and Rogel Cancer Center, University of Michigan, Ann Arbor, Michigan, USA.
Address correspondence to: Abhijit S. Naik, Department of Internal Medicine Division of Nephrology, F6676, 1150 UHS, 1500 E, Medical Center Drive, Ann Arbor, Michigan, 48109, USA. Phone: 734.763.0990; Email: abhinaik@umich.edu.
Authorship note: TM, RS, and PJM contributed equally to this work and have been designated as co–first authors. CLT and ASN contributed equally to this work and have been designated as co–senior authors.
Find articles by Sealfon, R. in: PubMed | Google Scholar
1Lewis-Sigler Institute for Integrative Genomics and
2Princeton Precision Health Initiative, Princeton University, Princeton, New Jersey, USA.
3Center for Computational Biology, Flatiron Institute, New York, New York, USA.
4Department of Internal Medicine, Division of Nephrology, and
5Department of Pathology, University of Michigan, Ann Arbor, Michigan, USA.
6Department of Biological Sciences, University of Pittsburgh, Pittsburgh, Pennsylvania, USA.
7Department of Computational Medicine and Bioinformatics and
8Department of Microbiology and Immunology and Rogel Cancer Center, University of Michigan, Ann Arbor, Michigan, USA.
Address correspondence to: Abhijit S. Naik, Department of Internal Medicine Division of Nephrology, F6676, 1150 UHS, 1500 E, Medical Center Drive, Ann Arbor, Michigan, 48109, USA. Phone: 734.763.0990; Email: abhinaik@umich.edu.
Authorship note: TM, RS, and PJM contributed equally to this work and have been designated as co–first authors. CLT and ASN contributed equally to this work and have been designated as co–senior authors.
Find articles by
McCown, P.
in:
PubMed
|
Google Scholar
|

1Lewis-Sigler Institute for Integrative Genomics and
2Princeton Precision Health Initiative, Princeton University, Princeton, New Jersey, USA.
3Center for Computational Biology, Flatiron Institute, New York, New York, USA.
4Department of Internal Medicine, Division of Nephrology, and
5Department of Pathology, University of Michigan, Ann Arbor, Michigan, USA.
6Department of Biological Sciences, University of Pittsburgh, Pittsburgh, Pennsylvania, USA.
7Department of Computational Medicine and Bioinformatics and
8Department of Microbiology and Immunology and Rogel Cancer Center, University of Michigan, Ann Arbor, Michigan, USA.
Address correspondence to: Abhijit S. Naik, Department of Internal Medicine Division of Nephrology, F6676, 1150 UHS, 1500 E, Medical Center Drive, Ann Arbor, Michigan, 48109, USA. Phone: 734.763.0990; Email: abhinaik@umich.edu.
Authorship note: TM, RS, and PJM contributed equally to this work and have been designated as co–first authors. CLT and ASN contributed equally to this work and have been designated as co–senior authors.
Find articles by
AlAkwaa, F.
in:
PubMed
|
Google Scholar
|
1Lewis-Sigler Institute for Integrative Genomics and
2Princeton Precision Health Initiative, Princeton University, Princeton, New Jersey, USA.
3Center for Computational Biology, Flatiron Institute, New York, New York, USA.
4Department of Internal Medicine, Division of Nephrology, and
5Department of Pathology, University of Michigan, Ann Arbor, Michigan, USA.
6Department of Biological Sciences, University of Pittsburgh, Pittsburgh, Pennsylvania, USA.
7Department of Computational Medicine and Bioinformatics and
8Department of Microbiology and Immunology and Rogel Cancer Center, University of Michigan, Ann Arbor, Michigan, USA.
Address correspondence to: Abhijit S. Naik, Department of Internal Medicine Division of Nephrology, F6676, 1150 UHS, 1500 E, Medical Center Drive, Ann Arbor, Michigan, 48109, USA. Phone: 734.763.0990; Email: abhinaik@umich.edu.
Authorship note: TM, RS, and PJM contributed equally to this work and have been designated as co–first authors. CLT and ASN contributed equally to this work and have been designated as co–senior authors.
Find articles by
Farkash, E.
in:
PubMed
|
Google Scholar
|
1Lewis-Sigler Institute for Integrative Genomics and
2Princeton Precision Health Initiative, Princeton University, Princeton, New Jersey, USA.
3Center for Computational Biology, Flatiron Institute, New York, New York, USA.
4Department of Internal Medicine, Division of Nephrology, and
5Department of Pathology, University of Michigan, Ann Arbor, Michigan, USA.
6Department of Biological Sciences, University of Pittsburgh, Pittsburgh, Pennsylvania, USA.
7Department of Computational Medicine and Bioinformatics and
8Department of Microbiology and Immunology and Rogel Cancer Center, University of Michigan, Ann Arbor, Michigan, USA.
Address correspondence to: Abhijit S. Naik, Department of Internal Medicine Division of Nephrology, F6676, 1150 UHS, 1500 E, Medical Center Drive, Ann Arbor, Michigan, 48109, USA. Phone: 734.763.0990; Email: abhinaik@umich.edu.
Authorship note: TM, RS, and PJM contributed equally to this work and have been designated as co–first authors. CLT and ASN contributed equally to this work and have been designated as co–senior authors.
Find articles by
Otto, E.
in:
PubMed
|
Google Scholar
|
1Lewis-Sigler Institute for Integrative Genomics and
2Princeton Precision Health Initiative, Princeton University, Princeton, New Jersey, USA.
3Center for Computational Biology, Flatiron Institute, New York, New York, USA.
4Department of Internal Medicine, Division of Nephrology, and
5Department of Pathology, University of Michigan, Ann Arbor, Michigan, USA.
6Department of Biological Sciences, University of Pittsburgh, Pittsburgh, Pennsylvania, USA.
7Department of Computational Medicine and Bioinformatics and
8Department of Microbiology and Immunology and Rogel Cancer Center, University of Michigan, Ann Arbor, Michigan, USA.
Address correspondence to: Abhijit S. Naik, Department of Internal Medicine Division of Nephrology, F6676, 1150 UHS, 1500 E, Medical Center Drive, Ann Arbor, Michigan, 48109, USA. Phone: 734.763.0990; Email: abhinaik@umich.edu.
Authorship note: TM, RS, and PJM contributed equally to this work and have been designated as co–first authors. CLT and ASN contributed equally to this work and have been designated as co–senior authors.
Find articles by Eichinger, F. in: PubMed | Google Scholar
1Lewis-Sigler Institute for Integrative Genomics and
2Princeton Precision Health Initiative, Princeton University, Princeton, New Jersey, USA.
3Center for Computational Biology, Flatiron Institute, New York, New York, USA.
4Department of Internal Medicine, Division of Nephrology, and
5Department of Pathology, University of Michigan, Ann Arbor, Michigan, USA.
6Department of Biological Sciences, University of Pittsburgh, Pittsburgh, Pennsylvania, USA.
7Department of Computational Medicine and Bioinformatics and
8Department of Microbiology and Immunology and Rogel Cancer Center, University of Michigan, Ann Arbor, Michigan, USA.
Address correspondence to: Abhijit S. Naik, Department of Internal Medicine Division of Nephrology, F6676, 1150 UHS, 1500 E, Medical Center Drive, Ann Arbor, Michigan, 48109, USA. Phone: 734.763.0990; Email: abhinaik@umich.edu.
Authorship note: TM, RS, and PJM contributed equally to this work and have been designated as co–first authors. CLT and ASN contributed equally to this work and have been designated as co–senior authors.
Find articles by Cantalupo, P. in: PubMed | Google Scholar
1Lewis-Sigler Institute for Integrative Genomics and
2Princeton Precision Health Initiative, Princeton University, Princeton, New Jersey, USA.
3Center for Computational Biology, Flatiron Institute, New York, New York, USA.
4Department of Internal Medicine, Division of Nephrology, and
5Department of Pathology, University of Michigan, Ann Arbor, Michigan, USA.
6Department of Biological Sciences, University of Pittsburgh, Pittsburgh, Pennsylvania, USA.
7Department of Computational Medicine and Bioinformatics and
8Department of Microbiology and Immunology and Rogel Cancer Center, University of Michigan, Ann Arbor, Michigan, USA.
Address correspondence to: Abhijit S. Naik, Department of Internal Medicine Division of Nephrology, F6676, 1150 UHS, 1500 E, Medical Center Drive, Ann Arbor, Michigan, 48109, USA. Phone: 734.763.0990; Email: abhinaik@umich.edu.
Authorship note: TM, RS, and PJM contributed equally to this work and have been designated as co–first authors. CLT and ASN contributed equally to this work and have been designated as co–senior authors.
Find articles by An, P. in: PubMed | Google Scholar
1Lewis-Sigler Institute for Integrative Genomics and
2Princeton Precision Health Initiative, Princeton University, Princeton, New Jersey, USA.
3Center for Computational Biology, Flatiron Institute, New York, New York, USA.
4Department of Internal Medicine, Division of Nephrology, and
5Department of Pathology, University of Michigan, Ann Arbor, Michigan, USA.
6Department of Biological Sciences, University of Pittsburgh, Pittsburgh, Pennsylvania, USA.
7Department of Computational Medicine and Bioinformatics and
8Department of Microbiology and Immunology and Rogel Cancer Center, University of Michigan, Ann Arbor, Michigan, USA.
Address correspondence to: Abhijit S. Naik, Department of Internal Medicine Division of Nephrology, F6676, 1150 UHS, 1500 E, Medical Center Drive, Ann Arbor, Michigan, 48109, USA. Phone: 734.763.0990; Email: abhinaik@umich.edu.
Authorship note: TM, RS, and PJM contributed equally to this work and have been designated as co–first authors. CLT and ASN contributed equally to this work and have been designated as co–senior authors.
Find articles by
Menon, R.
in:
PubMed
|
Google Scholar
|
1Lewis-Sigler Institute for Integrative Genomics and
2Princeton Precision Health Initiative, Princeton University, Princeton, New Jersey, USA.
3Center for Computational Biology, Flatiron Institute, New York, New York, USA.
4Department of Internal Medicine, Division of Nephrology, and
5Department of Pathology, University of Michigan, Ann Arbor, Michigan, USA.
6Department of Biological Sciences, University of Pittsburgh, Pittsburgh, Pennsylvania, USA.
7Department of Computational Medicine and Bioinformatics and
8Department of Microbiology and Immunology and Rogel Cancer Center, University of Michigan, Ann Arbor, Michigan, USA.
Address correspondence to: Abhijit S. Naik, Department of Internal Medicine Division of Nephrology, F6676, 1150 UHS, 1500 E, Medical Center Drive, Ann Arbor, Michigan, 48109, USA. Phone: 734.763.0990; Email: abhinaik@umich.edu.
Authorship note: TM, RS, and PJM contributed equally to this work and have been designated as co–first authors. CLT and ASN contributed equally to this work and have been designated as co–senior authors.
Find articles by
Berthier, C.
in:
PubMed
|
Google Scholar
|
1Lewis-Sigler Institute for Integrative Genomics and
2Princeton Precision Health Initiative, Princeton University, Princeton, New Jersey, USA.
3Center for Computational Biology, Flatiron Institute, New York, New York, USA.
4Department of Internal Medicine, Division of Nephrology, and
5Department of Pathology, University of Michigan, Ann Arbor, Michigan, USA.
6Department of Biological Sciences, University of Pittsburgh, Pittsburgh, Pennsylvania, USA.
7Department of Computational Medicine and Bioinformatics and
8Department of Microbiology and Immunology and Rogel Cancer Center, University of Michigan, Ann Arbor, Michigan, USA.
Address correspondence to: Abhijit S. Naik, Department of Internal Medicine Division of Nephrology, F6676, 1150 UHS, 1500 E, Medical Center Drive, Ann Arbor, Michigan, 48109, USA. Phone: 734.763.0990; Email: abhinaik@umich.edu.
Authorship note: TM, RS, and PJM contributed equally to this work and have been designated as co–first authors. CLT and ASN contributed equally to this work and have been designated as co–senior authors.
Find articles by Reed, T. in: PubMed | Google Scholar
1Lewis-Sigler Institute for Integrative Genomics and
2Princeton Precision Health Initiative, Princeton University, Princeton, New Jersey, USA.
3Center for Computational Biology, Flatiron Institute, New York, New York, USA.
4Department of Internal Medicine, Division of Nephrology, and
5Department of Pathology, University of Michigan, Ann Arbor, Michigan, USA.
6Department of Biological Sciences, University of Pittsburgh, Pittsburgh, Pennsylvania, USA.
7Department of Computational Medicine and Bioinformatics and
8Department of Microbiology and Immunology and Rogel Cancer Center, University of Michigan, Ann Arbor, Michigan, USA.
Address correspondence to: Abhijit S. Naik, Department of Internal Medicine Division of Nephrology, F6676, 1150 UHS, 1500 E, Medical Center Drive, Ann Arbor, Michigan, 48109, USA. Phone: 734.763.0990; Email: abhinaik@umich.edu.
Authorship note: TM, RS, and PJM contributed equally to this work and have been designated as co–first authors. CLT and ASN contributed equally to this work and have been designated as co–senior authors.
Find articles by Arrowsmith, P. in: PubMed | Google Scholar
1Lewis-Sigler Institute for Integrative Genomics and
2Princeton Precision Health Initiative, Princeton University, Princeton, New Jersey, USA.
3Center for Computational Biology, Flatiron Institute, New York, New York, USA.
4Department of Internal Medicine, Division of Nephrology, and
5Department of Pathology, University of Michigan, Ann Arbor, Michigan, USA.
6Department of Biological Sciences, University of Pittsburgh, Pittsburgh, Pennsylvania, USA.
7Department of Computational Medicine and Bioinformatics and
8Department of Microbiology and Immunology and Rogel Cancer Center, University of Michigan, Ann Arbor, Michigan, USA.
Address correspondence to: Abhijit S. Naik, Department of Internal Medicine Division of Nephrology, F6676, 1150 UHS, 1500 E, Medical Center Drive, Ann Arbor, Michigan, 48109, USA. Phone: 734.763.0990; Email: abhinaik@umich.edu.
Authorship note: TM, RS, and PJM contributed equally to this work and have been designated as co–first authors. CLT and ASN contributed equally to this work and have been designated as co–senior authors.
Find articles by Subramanian, L. in: PubMed | Google Scholar
1Lewis-Sigler Institute for Integrative Genomics and
2Princeton Precision Health Initiative, Princeton University, Princeton, New Jersey, USA.
3Center for Computational Biology, Flatiron Institute, New York, New York, USA.
4Department of Internal Medicine, Division of Nephrology, and
5Department of Pathology, University of Michigan, Ann Arbor, Michigan, USA.
6Department of Biological Sciences, University of Pittsburgh, Pittsburgh, Pennsylvania, USA.
7Department of Computational Medicine and Bioinformatics and
8Department of Microbiology and Immunology and Rogel Cancer Center, University of Michigan, Ann Arbor, Michigan, USA.
Address correspondence to: Abhijit S. Naik, Department of Internal Medicine Division of Nephrology, F6676, 1150 UHS, 1500 E, Medical Center Drive, Ann Arbor, Michigan, 48109, USA. Phone: 734.763.0990; Email: abhinaik@umich.edu.
Authorship note: TM, RS, and PJM contributed equally to this work and have been designated as co–first authors. CLT and ASN contributed equally to this work and have been designated as co–senior authors.
Find articles by Shaffer, K. in: PubMed | Google Scholar
1Lewis-Sigler Institute for Integrative Genomics and
2Princeton Precision Health Initiative, Princeton University, Princeton, New Jersey, USA.
3Center for Computational Biology, Flatiron Institute, New York, New York, USA.
4Department of Internal Medicine, Division of Nephrology, and
5Department of Pathology, University of Michigan, Ann Arbor, Michigan, USA.
6Department of Biological Sciences, University of Pittsburgh, Pittsburgh, Pennsylvania, USA.
7Department of Computational Medicine and Bioinformatics and
8Department of Microbiology and Immunology and Rogel Cancer Center, University of Michigan, Ann Arbor, Michigan, USA.
Address correspondence to: Abhijit S. Naik, Department of Internal Medicine Division of Nephrology, F6676, 1150 UHS, 1500 E, Medical Center Drive, Ann Arbor, Michigan, 48109, USA. Phone: 734.763.0990; Email: abhinaik@umich.edu.
Authorship note: TM, RS, and PJM contributed equally to this work and have been designated as co–first authors. CLT and ASN contributed equally to this work and have been designated as co–senior authors.
Find articles by Norman, S. in: PubMed | Google Scholar
1Lewis-Sigler Institute for Integrative Genomics and
2Princeton Precision Health Initiative, Princeton University, Princeton, New Jersey, USA.
3Center for Computational Biology, Flatiron Institute, New York, New York, USA.
4Department of Internal Medicine, Division of Nephrology, and
5Department of Pathology, University of Michigan, Ann Arbor, Michigan, USA.
6Department of Biological Sciences, University of Pittsburgh, Pittsburgh, Pennsylvania, USA.
7Department of Computational Medicine and Bioinformatics and
8Department of Microbiology and Immunology and Rogel Cancer Center, University of Michigan, Ann Arbor, Michigan, USA.
Address correspondence to: Abhijit S. Naik, Department of Internal Medicine Division of Nephrology, F6676, 1150 UHS, 1500 E, Medical Center Drive, Ann Arbor, Michigan, 48109, USA. Phone: 734.763.0990; Email: abhinaik@umich.edu.
Authorship note: TM, RS, and PJM contributed equally to this work and have been designated as co–first authors. CLT and ASN contributed equally to this work and have been designated as co–senior authors.
Find articles by Gumber, R. in: PubMed | Google Scholar
1Lewis-Sigler Institute for Integrative Genomics and
2Princeton Precision Health Initiative, Princeton University, Princeton, New Jersey, USA.
3Center for Computational Biology, Flatiron Institute, New York, New York, USA.
4Department of Internal Medicine, Division of Nephrology, and
5Department of Pathology, University of Michigan, Ann Arbor, Michigan, USA.
6Department of Biological Sciences, University of Pittsburgh, Pittsburgh, Pennsylvania, USA.
7Department of Computational Medicine and Bioinformatics and
8Department of Microbiology and Immunology and Rogel Cancer Center, University of Michigan, Ann Arbor, Michigan, USA.
Address correspondence to: Abhijit S. Naik, Department of Internal Medicine Division of Nephrology, F6676, 1150 UHS, 1500 E, Medical Center Drive, Ann Arbor, Michigan, 48109, USA. Phone: 734.763.0990; Email: abhinaik@umich.edu.
Authorship note: TM, RS, and PJM contributed equally to this work and have been designated as co–first authors. CLT and ASN contributed equally to this work and have been designated as co–senior authors.
Find articles by
Imperiale, M.
in:
PubMed
|
Google Scholar
|
1Lewis-Sigler Institute for Integrative Genomics and
2Princeton Precision Health Initiative, Princeton University, Princeton, New Jersey, USA.
3Center for Computational Biology, Flatiron Institute, New York, New York, USA.
4Department of Internal Medicine, Division of Nephrology, and
5Department of Pathology, University of Michigan, Ann Arbor, Michigan, USA.
6Department of Biological Sciences, University of Pittsburgh, Pittsburgh, Pennsylvania, USA.
7Department of Computational Medicine and Bioinformatics and
8Department of Microbiology and Immunology and Rogel Cancer Center, University of Michigan, Ann Arbor, Michigan, USA.
Address correspondence to: Abhijit S. Naik, Department of Internal Medicine Division of Nephrology, F6676, 1150 UHS, 1500 E, Medical Center Drive, Ann Arbor, Michigan, 48109, USA. Phone: 734.763.0990; Email: abhinaik@umich.edu.
Authorship note: TM, RS, and PJM contributed equally to this work and have been designated as co–first authors. CLT and ASN contributed equally to this work and have been designated as co–senior authors.
Find articles by Pipas, J. in: PubMed | Google Scholar
1Lewis-Sigler Institute for Integrative Genomics and
2Princeton Precision Health Initiative, Princeton University, Princeton, New Jersey, USA.
3Center for Computational Biology, Flatiron Institute, New York, New York, USA.
4Department of Internal Medicine, Division of Nephrology, and
5Department of Pathology, University of Michigan, Ann Arbor, Michigan, USA.
6Department of Biological Sciences, University of Pittsburgh, Pittsburgh, Pennsylvania, USA.
7Department of Computational Medicine and Bioinformatics and
8Department of Microbiology and Immunology and Rogel Cancer Center, University of Michigan, Ann Arbor, Michigan, USA.
Address correspondence to: Abhijit S. Naik, Department of Internal Medicine Division of Nephrology, F6676, 1150 UHS, 1500 E, Medical Center Drive, Ann Arbor, Michigan, 48109, USA. Phone: 734.763.0990; Email: abhinaik@umich.edu.
Authorship note: TM, RS, and PJM contributed equally to this work and have been designated as co–first authors. CLT and ASN contributed equally to this work and have been designated as co–senior authors.
Find articles by Troyanskaya, O. in: PubMed | Google Scholar
1Lewis-Sigler Institute for Integrative Genomics and
2Princeton Precision Health Initiative, Princeton University, Princeton, New Jersey, USA.
3Center for Computational Biology, Flatiron Institute, New York, New York, USA.
4Department of Internal Medicine, Division of Nephrology, and
5Department of Pathology, University of Michigan, Ann Arbor, Michigan, USA.
6Department of Biological Sciences, University of Pittsburgh, Pittsburgh, Pennsylvania, USA.
7Department of Computational Medicine and Bioinformatics and
8Department of Microbiology and Immunology and Rogel Cancer Center, University of Michigan, Ann Arbor, Michigan, USA.
Address correspondence to: Abhijit S. Naik, Department of Internal Medicine Division of Nephrology, F6676, 1150 UHS, 1500 E, Medical Center Drive, Ann Arbor, Michigan, 48109, USA. Phone: 734.763.0990; Email: abhinaik@umich.edu.
Authorship note: TM, RS, and PJM contributed equally to this work and have been designated as co–first authors. CLT and ASN contributed equally to this work and have been designated as co–senior authors.
Find articles by
Kretzler, M.
in:
PubMed
|
Google Scholar
|
1Lewis-Sigler Institute for Integrative Genomics and
2Princeton Precision Health Initiative, Princeton University, Princeton, New Jersey, USA.
3Center for Computational Biology, Flatiron Institute, New York, New York, USA.
4Department of Internal Medicine, Division of Nephrology, and
5Department of Pathology, University of Michigan, Ann Arbor, Michigan, USA.
6Department of Biological Sciences, University of Pittsburgh, Pittsburgh, Pennsylvania, USA.
7Department of Computational Medicine and Bioinformatics and
8Department of Microbiology and Immunology and Rogel Cancer Center, University of Michigan, Ann Arbor, Michigan, USA.
Address correspondence to: Abhijit S. Naik, Department of Internal Medicine Division of Nephrology, F6676, 1150 UHS, 1500 E, Medical Center Drive, Ann Arbor, Michigan, 48109, USA. Phone: 734.763.0990; Email: abhinaik@umich.edu.
Authorship note: TM, RS, and PJM contributed equally to this work and have been designated as co–first authors. CLT and ASN contributed equally to this work and have been designated as co–senior authors.
Find articles by Theesfeld, C. in: PubMed | Google Scholar
1Lewis-Sigler Institute for Integrative Genomics and
2Princeton Precision Health Initiative, Princeton University, Princeton, New Jersey, USA.
3Center for Computational Biology, Flatiron Institute, New York, New York, USA.
4Department of Internal Medicine, Division of Nephrology, and
5Department of Pathology, University of Michigan, Ann Arbor, Michigan, USA.
6Department of Biological Sciences, University of Pittsburgh, Pittsburgh, Pennsylvania, USA.
7Department of Computational Medicine and Bioinformatics and
8Department of Microbiology and Immunology and Rogel Cancer Center, University of Michigan, Ann Arbor, Michigan, USA.
Address correspondence to: Abhijit S. Naik, Department of Internal Medicine Division of Nephrology, F6676, 1150 UHS, 1500 E, Medical Center Drive, Ann Arbor, Michigan, 48109, USA. Phone: 734.763.0990; Email: abhinaik@umich.edu.
Authorship note: TM, RS, and PJM contributed equally to this work and have been designated as co–first authors. CLT and ASN contributed equally to this work and have been designated as co–senior authors.
Find articles by
Naik, A.
in:
PubMed
|
Google Scholar
|
Published March 12, 2026 - More info
JCI Insight. 2026;11(8):e198227. https://doi.org/10.1172/jci.insight.198227.
© 2026 Marvin et al. This work is licensed under the Creative Commons Attribution 4.0 International License. To view a copy of this license, visit http://creativecommons.org/licenses/by/4.0/.
Received: July 29, 2025; Accepted: February 26, 2026


-
Results
The analytical approach for this study is summarized in Figure 1A.
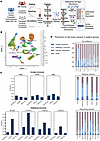 Figure 1
Single-cell RNA-seq of BKV and BKVN in transplant kidney biopsies. (A) Overview of analysis of BKV and BKVN in transplant kidney biopsies: 26 biopsies were selected to study the effects of BKV infection on allografts. Twelve surveillance biopsies, 5 from patients with peaking viremia in the blood, and 9 from patients with resolving viremia were subject to single-cell RNA-seq analysis. The transcriptomic analysis of the response to BKV and BKVN was determined for tubular epithelial and immune compartments. Differential cell-type abundances across patients and groups were assessed to indicate host-immune response to infection. Results were compared with the transcriptomic signals in the cell line BK infection model to determine which aspects of the in vivo signals are modeled in vitro and which components are unique to the response in the kidney. (B) UMAP of >63,000 sequenced single cells from surveillance, peaking viremia, and resolving viremia biopsies that passed quality thresholds. (C) The proportion of adaptive immune cells (B cell, T cell 1, T cell 2, T cell 3) contributing to peaking biopsies is greater in adaptive immune cell contribution to biopsies from surveillance and resolving patients even as peaking patients are treated with triple-immunosuppressive therapy with tacrolimus, mycophenolate mofetil, and prednisone. The proportion of innate immune cells (MAC, MON, NKC) contributing to peaking biopsies is not significantly enriched compared with other infection stages. (D) Proportion of cell-type class present in biopsies (asterisks indicate biopsies from patients with BKVN, a subset of peaking viremia patients). ATL, ascending thin limb; CNT, connecting tubule; DCT, distal convoluted tubule; DTL-1, descending thin limb 1; EC-AEA, endothelial cell afferent/efferent arteriole; EC-LYM, endothelial cell lymphatic; EC-PT, endothelial cell peritubular capillary; FIB, fibroblast; FIB_Plasma, fibroblast/plasma cell; IC-A, intercalating cell A; IC-B, intercalated cell B; MAC, macrophage; MON, monocyte; NKC, natural killer cell; PC, principal cell; PEC, parietal epithelial cell; POD, podocyte; PT-1, proximal tubule 1; PT-2, proximal tubule 2; TAL-1, thick ascending limb; vSMC_MC, vascular smooth muscle cell/muscle cell.
Participant clinical characteristics
Participants clinical characteristics at the time of biopsy are presented in Table 1. Biopsy samples from 7 kidney transplant recipients in the Human Kidney Transplant Transcriptomic Atlas (HKTTA) were collected at different phases of BKV infection. Abbreviations used for each grouping are provided in Table 2 with additional details in the Methods section. Viral loads in allPeak (see methods section for definitions) ranged from 3,524 to 44,600 viral genome copies/mL, while viral loads in resBKVir ranged from 500 and 4,100 copies/mL. High viral loads and nonzero PVL scores are associated with BKVN (24). Both patients in the peakBKVir group had BK viral loads below 10,000 copies/μL and PVL scores of zero, consistent with their histologic diagnosis of no BKVN (25). In contrast, 2 of the 3 patients in the BKVN group had high viral loads exceeding 10,000 copies/μL and nonzero PVL scores, consistent with BKVN. These 3 biopsies all show SV40 staining, confirming BKVN. Table 3 presents the Banff 2022 scores for all patients with BK viremia, while the Banff scores for surveillance biopsy patients have been published previously (26). Table 4 summarizes comparisons across the groups referenced in the analysis below.
Characterization of cell types in BKV infection phases
After quality control, 63,167 cells from 26 kidney biopsies were retained for analysis. Among these, 46,211 cells were derived from 14 BKV-infected samples; including 19,080 cells from BKVN; 4,467 from peakBKVir; and 22,664 from resBKVir. Control biopsies (surveillance [SURV]) contributed 16,956 cells. Unsupervised clustering identified 30 distinct cell populations (Figure 1B), representing major kidney cell types. All patients contributed cells from both the medulla and cortex, capturing a broad spectrum of renal cell types. Each cluster included cells from all phases of BK infection and controls (Supplemental Figure 1; supplemental material available online with this article; https://doi.org/10.1172/jci.insight.198227DS1).
The proportion of adaptive immune cells was significantly higher in BKVN (n = 3 biopsies) and peakBKVir (n = 2 biopsies) compared with SURV (n = 12 biopsies) and resBKVir (n = 9 biopsies). In contrast, the proportion of innate immune cells remained stable across all patient groups (Figure 1C). Notably, the adaptive immune cell compartment was expanded in BKVN (Figure 1D) relative to peakBKVir. Immune cells were predominantly recipient-derived, with only 1% carrying donor sex-specific markers (RPS4Y1 in male donors, XIST in female donors) in patients where the donor and recipient were of different sexes.
Epithelial cell response to peaking BK viremia and BKV nephropathy
The tubular epithelial cells of the kidney are considered the site of primary BK infection and prolonged persistence. Molecular signals upregulated in tubular epithelial cells with BK viremia without nephropathy were determined by comparing peakBKVir to SURV biopsies. To evaluate the biological signals in the differentially expressed genes, we used a network-based gene set enrichment analysis that enables pathway-level assessments by expanding the DEG gene lists (that may have sparse representation of pathways due to statistical noise) through data-driven definition of functionally related genes (27–29) (Supplemental Figure 2, Methods). PeakBKVir cells exhibited significant enrichment and upregulation of stress signaling, wound healing, and extracellular matrix remodeling. Furthermore, there was increased enrichment of apoptosis and energy metabolism pathways (Figure 2, Supplemental Figure 3, Table 4, Supplemental Table 2A [DEGs], and Supplemental Table 2B [enriched processes]), with notable increases in genes involved in oxidative stress responses and metabolic adaptation. To understand the effect of direct infection on epithelial cell signaling cascades, the transcriptomic profiles of tubular epithelial cells from BKVN biopsies and SURV biopsies were compared (Figure 2 and Supplemental Table 3, A and B). Genes upregulated in BKVN were enriched for polyomavirus infection hallmarks, including ribosome biogenesis, translation, and energy restructuring (Figure 2 and Supplemental Figure 3). Additionally, the BKVN signature displayed strong activation of immune-related pathways, particularly antigen processing and presentation, with increased expression of multiple HLA class I and II molecules and IFN-stimulated genes but no increase in the expression of IFN-γ transcript (Figure 2) suggesting response to an extracellular source of IFN-γ. Wound healing processes were also upregulated, as indicated by increased expression of extracellular matrix components and cell migration regulators. Immune-related signaling pathways, including those associated with inflammation, were elevated, alongside key mediators of apoptotic regulation and protein homeostasis (Figure 2 and Supplemental Figure 3).
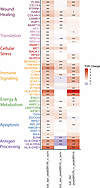 Figure 2
Expression signature of tubular epithelial cells with BKVN and BKVir compared with surveillance biopsies. The transcriptional response of tubular epithelial cells to peakBKVir and BKVN was assessed by comparing gene expression profiles across 3 conditions: peakBKVir versus SURV, BKVN versus SURV, and BKVN versus peakBKVir. PeakBKVir cells exhibited transcriptional signatures indicative of cellular stress, apoptosis, and energy metabolism remodeling, with increased expression of genes associated with oxidative stress responses, metabolic adaptation, and stress signaling pathways. In contrast, BKVN demonstrated a distinct immune activation profile, including the upregulation of antigen processing and presentation genes (HLA-DPA1, HLA-DPB1, HLA-DRB1, B2M) and IFN-stimulated genes (IFITM1, IFITM3, STAT1), along with pathways related to inflammation, wound healing, and extracellular matrix remodeling. The comparison of BKVN and peakBKVir revealed nephropathy-specific responses beyond those seen in peakBKVir, including heightened immune signaling and epithelial injury responses. Statistical significance is denoted as follows: ***P < 0.001, **P < 0.01, and *P < 0.05.
Comparison of transcriptional signatures of epithelial cells in patients with BKV nephropathy versus those with peaking BK viremia
The mechanisms specifically upregulated in nephropathy were elucidated by comparing BKVN with peakBKVir (Supplemental Table 4A [DEGs], Supplemental Table 4B [enriched processes], and Supplemental Figure 4). Notably, BKVN exhibited a stronger innate immune response, characterized by significant upregulation of antigen processing and presentation genes (HLA-DPA1, HLA-DPB1, HLA-DRB1, B2M) and IFN-stimulated genes (IFITM1, IFITM3, STAT1). In contrast, several HLA genes and antigen processing genes were downregulated in patients in the peakBKVir group. The BKVN signature was also distinguished by the upregulation of several immune-related signaling pathways, including SMAD proteins, Rho proteins, protein kinase A, receptor protein tyrosine kinase, and Ras protein signal transduction (Figure 2 and Supplemental Figure 3). Additionally, pathways related to wound healing and extracellular matrix remodeling were more significantly enriched in BKVN, suggesting a more extensive epithelial response to injury and repair processes (Figure 2 and Supplemental Figure 4). This distinct transcriptional profile underscores the role of immune activation and antigen presentation as defining features of BKVN beyond peakBKVir.
Comparison of transcriptional signatures of tubular epithelial cells of patients with BKV nephropathy with infected cells in culture
Cultured renal proximal tubular epithelial (RPTE) cells are an important model for studying BKV infection, and we investigated if the signals defined in this model were observed in vivo. A hallmark of BKV-infected RPTE cells is an increase in the proportion of cycling cells (23). There was a significantly higher proportion of cells assigned to the G2/M or S phase (P = 0.0008) in allPeak compared with SURV samples (Supplemental Figure 5). This finding suggests BK polyomavirus infection induces widespread cell cycle dysregulation in vivo in human proximal tubules.
We next evaluated if gene expression changes observed in infected cell lines profiled by An et al. were also present in the transcriptional signatures identified in single-cell data from epithelial cells in vivo (23) (Figure 3 and Supplemental Tables 5 and 6). A significant overlap was observed in BKV-associated transcriptional changes between BKV-infected RPTE cells in culture and tubular epithelial cells from peaking BKVN human biopsy samples (Figure 3A). This concordance confirms that numerous stress response and cytoskeletal genes are significantly upregulated in both infected cell lines and in vivo tubular epithelial cells, thereby validating our single-cell findings and reinforcing the role of these pathways in the epithelial response to infection (Figure 3A).
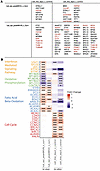 Figure 3
Similarities and differences between in vivo transcriptional signatures and in vitro transcriptional signatures in cell lines. (A) Genes that are significantly upregulated across both cell lines and in vivo transcriptional signatures. Markers that are annotated to the “cell cycle” GO term are highlighted in red. (B) Genes involved in processes differing across in vivo and in vitro signatures. Many additional cell cycle genes are upregulated in the infected cell line but not differentially regulated in tubular epithelial cells in vivo. Fatty acid β-oxidation markers are robustly upregulated in vivo but not in the cell line. Some oxidative phosphorylation markers are significantly downregulated in tubular epithelial cells from patients with peaking BKVN but not in other comparisons. A group of IFN-mediated signaling pathway genes are significantly upregulated in tubular epithelial cells from patients with peaking BKVN but not in other comparisons. The statistical significance of each fold change is denoted by *Padj < 0.05, **Padj < 0.01, ***Padj < 0.001.
Genes involved in cellular stress responses, including protein homeostasis (HSPA8, HSPD1, HSP90AB1, PSME1), oxidative stress regulation (HMOX1), inflammation and signaling (NFKBIA, HMGB1), and DNA damage repair and cell cycle regulation (GADD45A), were consistently upregulated across both comparisons, underscoring their role in cellular adaptation to infection. Additionally, the IFN-γ transcription was absent in epithelial cells in both the in vivo and in vitro settings, suggesting a conserved epithelial response to BKV infection (17, 23). However, genes responsive to IFN signaling are significantly upregulated in tubular epithelial cells from patients with peaking BKVN but not in the infected RPTE cells (Figure 3B).
Beyond these shared stress response pathways, we observed differences between in vivo and in vitro transcriptional signatures, particularly in cell cycle regulation, metabolic adaptation, and immune responses (Figure 3B). Many cell cycle regulators (CDK4, CDK2, CDK1) are strongly upregulated in infected RPTE cells but not differentially expressed in tubular epithelial cells in vivo. This suggests that while BKV infection induces proliferative signaling in both settings, in vitro conditions may amplify cell cycle activation without regulatory constraints present in the tissue. In contrast, fatty acid β-oxidation genes are robustly upregulated in vivo but show no significant regulation in the infected cell line, suggesting that metabolic shifts in response to BKV infection are unique to the tissue microenvironment (Figure 3B).
Immune responses to BKV
While immune activation is necessary to clear active BKV infection, it also poses the risk of immunopathologic damage to the kidney. Thus, it is crucial to understand both immune pathways that are important in response to viruses and pathways that may result in collateral allograft damage. All patients were under maximal immunosuppression regimen and demonstrated leucopenia (white blood cell count for all patients below 4,000 cells/μL; Table 1). However, peakBKVir and BKVN biopsies exhibited intrarenal increases in immune cells and activation signatures, indicating an intrarenal cellular immune response (Figure 1C).
Comparison of peaking BK viremia and transplant SURV biopsies. T cells from allPeak biopsies exhibited enrichment of genes upregulated in protein translation, activation, and migration suggestive of a proliferative T cell response; furthermore, effector functions were upregulated in addition to antiviral IFN signaling, apoptotic signaling, and mitochondrial respiration (Figure 4, Supplemental Figure 6, Supplemental Tables 7A–9A, and Supplemental Tables 7B–9B). This signal in allPeak biopsies was driven by the BKVN biopsies; we observed identical signals in T cells when comparing BKVN to SURV. This is likely due to the associated intrarenal immune compartment expansion (Figure 1, C and D). Expression patterns suggest T Cell-1 cells are Th17 cells, key regulators of inflammatory responses and tissue remodeling (Supplemental Figure 7) (30). T Cell-2 cells represent CD8+ cytotoxic T cells responsible for potent effector functions (Supplemental Figure 7) (31). T Cell-3 cells exhibit a Treg phenotype (Supplemental Figure 7) (32). T Cell-1 cells (Th17 cells) likely contribute to inflammatory responses within the graft, promoting tissue remodeling and immune activation (Supplemental Figure 6A). T Cell-2 cells (CD8+ T cells) are engaged in the direct killing of target cells, as evidenced by the upregulation of pathways related to T cell–mediated cytotoxicity (Supplemental Figure 6B). The T Cell-3 cluster, identified as Tregs, showed enrichments linked to immune suppression and homeostasis. Notably, protein ubiquitination pathways suggest posttranslational regulation of key signaling molecules, essential for FOXP3 stability, which drives Treg-mediated immunosuppression (Supplemental Figure 6C) (33).
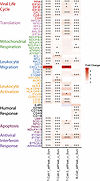 Figure 4
Expression signatures from T and B cells, comparing allPeak to surveillance biopsies. The transcriptional response of adaptive immune cells during BK viral infection was assessed by comparing allPeak gene expression profiles to surveillance. T cells exhibited upregulation of genes involved in protein translation, activation, and migration, suggesting a proliferative T cell response. Additionally, effector functions, antiviral IFN signaling, apoptotic pathways, and mitochondrial respiration were enriched. In B cells, pathways related to antigen processing and presentation, leukocyte activation, and proliferation were enriched, alongside increased expression of genes involved in protein translation and ribosome biogenesis, suggesting active cell growth. Additionally, B cells exhibited significant upregulation of genes associated with the humoral immune response, including signaling through CD79A and CD40. The statistical significance of each fold change is denoted by *Padj < 0.05, **Padj < 0.01, ***Padj < 0.001.
Comparison of peaking BK viremia versus transplant control biopsies. Like T cells, B cells were more numerous in allPeak than SURV, suggesting a coordinated B and T cell response. Functional enrichment analysis indicated that pathways induced in B cells from allPeak compared with SURV included antigen processing and presentation (major histocompatibility complexes) and several processes associated with leukocyte activation and proliferation: actin cytoskeleton organization, chemotaxis, and leukocyte cell-cell adhesion (Figure 4, Supplemental Figure 6D, and Supplemental Table 10, A and B). Many induced genes were relevant to the biosynthetic capacity of B cells—protein translation and ribosome biogenesis—indicating that cell growth was activated and congruent with the observed expansion of the B cell population in allPeak. Furthermore, when comparing B cells from the allPeak to SURV, a significant enrichment of genes associated with the mitochondrial organization and the electron transport chain was observed. In addition, several signaling pathways were stimulated, including the p38 mitogen-activated protein kinase (p38MAPK), I-κB kinase/NF-κB, phosphatidylinositol 3-kinase, Rho protein, and c-Jun N-terminal kinase (JNK) cascades (Supplemental Figure 6D). Direct comparison of B cells from resBKVir to SURV revealed signatures of ongoing defense against virus and infection (Supplemental Figure 8 and Supplemental Table 11, A and B). Thus, despite entering the resolving phase, B cells continue to exhibit significant upregulation of genes associated with ribosome biogenesis, leukocyte activation, and apoptosis. Key ribosomal genes remain differentially expressed, indicating ongoing protein synthesis to support sustained humoral response (Supplemental Figure 8). Genes involved in leukocyte activation also show persistent upregulation and differentially expressed apoptosis-related signatures.
Comparison of peaking BK viremia versus control biopsies. We did not observe an expansion in cell numbers of the innate immune cell population in allPeak biopsies (Figure 1, C and D); however, genes associated with translation, RNA metabolic processes, and lymphocyte proliferation were upregulated across innate immune cell types in allPeak compared with SURV (Figure 5, Supplemental Tables 12A–14A, Supplemental Tables 12B–14B, and Supplemental Figure 9).
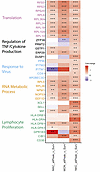 Figure 5
Innate immune cells transcriptional responses with peaking BK viremia compared with surveillance biopsies. The transcriptional landscape of innate immune cells from allPeak biopsies was assessed by comparing gene expression profiles to SURV. Despite no expansion of the innate immune cell population in allPeak, genes associated with translation, RNA metabolic processes, and lymphocyte proliferation were upregulated across innate immune cell types, suggesting heightened biosynthetic and proliferative activity. Beyond these shared activation signatures, distinct pathways were enriched in specific innate immune cell types. NKCs from allPeak exhibited the most pronounced upregulation of genes related to antigen processing and presentation, regulation of cytokine and TNF production, and response to viral infection, indicating a strong antiviral and immunoregulatory state. The statistical significance of each fold change is denoted by *Padj < 0.05, **Padj < 0.01, ***Padj < 0.001.
In addition to the shared activation signatures, several pathways were uniquely induced in specific innate immune cell types. NK cells (NKC) from allPeak demonstrated the most robust expression of genes related to antigen processing and presentation, regulation of cytokine and TNF production, and response to viral infection (Figure 5 and Supplemental Figure 9C). Biopsies in patients with BKVN represent a more translationally active state than patients with BK viremia alone in innate immune cell types, with widespread upregulation of ribosomal genes (Supplemental Figure 10). Genes involved in immunological synapse formation were also upregulated in BKVN monocytes compared with peakBKVir (Supplemental Figure 10). Notably, CXCL10, a chemokine expressed by macrophages and monocytes in the kidney (GTEX) and known to be elevated in the urine of patients with BKV, was downregulated in intrarenal monocytes and macrophages in allPeak biopsies (34, 35).
Comparison of intrarenal T cell signature of patients with peaking BK viremia and BKVN with T cell mediated rejection signatures in 2 studies. To investigate the molecular overlap between TCMR-associated gene signatures and intrarenal T cell responses in BK biopsies, we compared signatures between published studies and T cells from peaking samples. We first compared a TCMR signature from a study that looked at differentially expressed genes between TCMR and non-TCMR controls that included samples with inflammation, injury, and other rejection characteristics derived from Cortes Garcia et al. (36). We then performed an enrichment analysis comparing DEGs of all T cells and their subtypes from patients with BKVN and peakBKVir. Genes from both datasets were filtered to include only those with significant differential expression, and overlap was determined based on the concordant directionality of expression. Enrichment of TCMR-associated genes within the BKV transcriptomic signature was assessed using Fisher’s exact test, revealing significant enrichment across multiple T cell subsets (Figure 6A). T Cell-3 peakBKVir was not included in this analysis due to insufficient cells. The overlapping signature included expression programs across T cell subsets, including pathways related to translation ribosome biogenesis, metabolism, stress, lipid transport, immune signaling, extracellular matrix organization, and cytoskeletal regulation (Figure 6B). The enrichment of these expression programs was greater in T cells from patients with BKVN than in patients with peakBKVir, implying that BKVN induces programs more similar to TCMR than peakBKVir. When we examined the TCMR signature genes that overlapped BK DEGs, we observed that some were unique to peakBKVir, but a higher proportion were unique to BKVN; these genes were involved in antigen processing and presentation, T cell proliferation, cytoplasmic translation, and protein stability (Figure 6, B and C).
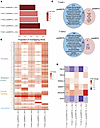 Figure 6
Expression of TCMR-associated genes in T cell populations of patients with peaking BKV. (A) Enrichment of DEGs from all T cells and their subtypes in patients with BKVN or peakBKVir against a validated TCMR gene signature derived from bulk RNA-seq of biopsies with TCMR compared with non-TCMR samples that include normal, injury, and antibody mediated rejection biopsies (36). The signature included all differentially expressed genes, up- and downregulated. Enrichment was assessed using Fisher’s exact test, revealing significant overlap across all T cell subsets. T Cell-3 peakBKVir was excluded due to insufficient cells. (B) Heatmap showing expression programs induced across all T cell subsets overlapping with TCMR DEGs, highlighting pathways related to translation, ribosome biogenesis, metabolism, stress, immune signaling, and cytoskeletal regulation. The enrichment of these pathways was more robust in BKVN than in peakBKVir. (C) To investigate the transcriptional differences between peak BKVN and peak BKVir within T cell subsets, we performed an overlap analysis focusing on DEGs that are shared with the TCMR signature. Functional annotations highlight key biological pathways associated with BKVN genes that overlap the TCMR signature. (D) Heatmap depicting the expression of 6 TCMR-associated genes (AKNA, ANXA2R, GIMAP7, RASAL3, TMC6, and TMC8) in T cell populations from BK polyomavirus (BKV) nephropathy patient samples. ANXA2R and GIMAP7 were significantly upregulated, while AKNA and TMC8 were downregulated. The differential expression of these genes may indicate potential overlaps and differences between viral immune responses and alloimmune rejection mechanisms in kidney transplantation. Statistical significance of each fold change is denoted by *Padj < 0.05, **Padj < 0.01, ***Padj < 0.001. Underlying data was obtained from the paper by Zhang et al. (37).
We compared the T cell signals in peaking biopsies to a second study that characterized TCMR rejection signals specifically from biopsies that showed expanded diverse populations of T cell CDR3 clonotypes associated with rejection (37). The report defined a 6-gene set (AKNA, ANXA2R, GIMAP7, RASAL3, TMC6, and TMC8) that showed increased expression across multiple cell types in rejection biopsies. In our analysis, none of these genes were upregulated in T cells from peakBKVir samples, and only 2 showed significant upregulation in BKVN (ANXA2R and GIMPA7). ANXA2R was upregulated in the T Cell-1 cluster of patients with BKVN, and GIMPA7 was upregulated in the T Cell-1 and T Cell-2 clusters of patients with BKVN (Figure 6D).
Detection of BKV in kidney cells using scRNA-seq
The analysis of single cells enabled us to profile cell types with BK viral transcripts. We found BK viral transcripts in a subset of cells via scRNA-seq, including both tubular epithelial and immune cell clusters (Supplemental Figure 11, A and B). The detected transcripts included early-expressed small and large T antigens and late-expressed VP1, VP2, and agnoprotein. Reads were sparse, with low mean transcript counts per cell, and were absent in control or resolving BK samples. This low detection rate is in line with prior reports for RNA-seq of diverse in vivo viral infections (38–40). BLAST and SNP analyses confirmed that all viral reads mapped to human polyomavirus subtype 1 and that each affected biopsy carried a unique BKV strain (Supplemental Figure 12).
IHC and transmission electron microscopy identified BK viral proteins and virions in tubular epithelial cells, consistent with previous studies (Supplemental Figure 11B and Supplemental Figure 13). While some viral reads were detected in cells from immune clusters, this observation requires further validation using orthogonal techniques. In vitro studies have demonstrated that lymphocytes can transmit BKV to renal tubular cells (41, 42). Furthermore, previous studies have identified BKV in circulating immune cells (11, 12).Given the limited number of detected transcripts and exhaustion of tissue sections in the studied patients, these findings are best interpreted as preliminary, and additional targeted approaches will be necessary to confirm whether circulating and infiltrating immune cells harbor viral RNA and allow for viral replication in vivo during infection.


