
Research ArticleDevelopmentNephrologyOncology
Open Access |  10.1172/jci.insight.188078
Single-nucleus RNA sequencing reveals transcriptional heterogeneity in the blastema of favorable-histology Wilms tumor
Mike Adam,1 Keri A. Drake,2 Naomi Pode-Shakked,3,4 Katherine VandenHeuvel,5 S. Steven Potter,6 and James Geller7,8
1Division of Experimental Hematology and Cancer Biology, Cancer and Blood Diseases Institute, Cincinnati Children’s Hospital Medical Center, Cincinnati, Ohio, USA.
2Division of Pediatric Nephrology, University of Texas Southwestern Medical Center, Dallas, Texas, USA.
3Pediatric Nephrology Unit, Dana Dwek Children’s Hospital, Tel Aviv Sourasky University Medical Center (Ichilov), Tel Aviv, Israel.
4Grey Faculty of Medical & Health Sciences, Tel Aviv University, Tel Aviv, Israel.
5Division of Pathology and Laboratory Medicine, and
6Division of Developmental Biology, Cincinnati Children’s Hospital Medical Center, Cincinnati, Ohio, USA.
7Division of Hematology/Oncology, Department of Pediatrics, Peckham Center for Cancer and Blood Disorders, Rady Children’s Hospital, San Diego, California, USA.
8UCSD, La Jolla, California, USA.
Address correspondence to: James I. Geller, 3020 Children’s Way, San Diego, California, 92123, USA. Phone: 513.739.4554; Email: jgeller@rchsd.org.
Authorship note: MA and KAD contributed equally to this work.
Find articles by Adam, M. in: PubMed | Google Scholar
1Division of Experimental Hematology and Cancer Biology, Cancer and Blood Diseases Institute, Cincinnati Children’s Hospital Medical Center, Cincinnati, Ohio, USA.
2Division of Pediatric Nephrology, University of Texas Southwestern Medical Center, Dallas, Texas, USA.
3Pediatric Nephrology Unit, Dana Dwek Children’s Hospital, Tel Aviv Sourasky University Medical Center (Ichilov), Tel Aviv, Israel.
4Grey Faculty of Medical & Health Sciences, Tel Aviv University, Tel Aviv, Israel.
5Division of Pathology and Laboratory Medicine, and
6Division of Developmental Biology, Cincinnati Children’s Hospital Medical Center, Cincinnati, Ohio, USA.
7Division of Hematology/Oncology, Department of Pediatrics, Peckham Center for Cancer and Blood Disorders, Rady Children’s Hospital, San Diego, California, USA.
8UCSD, La Jolla, California, USA.
Address correspondence to: James I. Geller, 3020 Children’s Way, San Diego, California, 92123, USA. Phone: 513.739.4554; Email: jgeller@rchsd.org.
Authorship note: MA and KAD contributed equally to this work.
Find articles by Drake, K. in: PubMed | Google Scholar
1Division of Experimental Hematology and Cancer Biology, Cancer and Blood Diseases Institute, Cincinnati Children’s Hospital Medical Center, Cincinnati, Ohio, USA.
2Division of Pediatric Nephrology, University of Texas Southwestern Medical Center, Dallas, Texas, USA.
3Pediatric Nephrology Unit, Dana Dwek Children’s Hospital, Tel Aviv Sourasky University Medical Center (Ichilov), Tel Aviv, Israel.
4Grey Faculty of Medical & Health Sciences, Tel Aviv University, Tel Aviv, Israel.
5Division of Pathology and Laboratory Medicine, and
6Division of Developmental Biology, Cincinnati Children’s Hospital Medical Center, Cincinnati, Ohio, USA.
7Division of Hematology/Oncology, Department of Pediatrics, Peckham Center for Cancer and Blood Disorders, Rady Children’s Hospital, San Diego, California, USA.
8UCSD, La Jolla, California, USA.
Address correspondence to: James I. Geller, 3020 Children’s Way, San Diego, California, 92123, USA. Phone: 513.739.4554; Email: jgeller@rchsd.org.
Authorship note: MA and KAD contributed equally to this work.
Find articles by Pode-Shakked, N. in: PubMed | Google Scholar
1Division of Experimental Hematology and Cancer Biology, Cancer and Blood Diseases Institute, Cincinnati Children’s Hospital Medical Center, Cincinnati, Ohio, USA.
2Division of Pediatric Nephrology, University of Texas Southwestern Medical Center, Dallas, Texas, USA.
3Pediatric Nephrology Unit, Dana Dwek Children’s Hospital, Tel Aviv Sourasky University Medical Center (Ichilov), Tel Aviv, Israel.
4Grey Faculty of Medical & Health Sciences, Tel Aviv University, Tel Aviv, Israel.
5Division of Pathology and Laboratory Medicine, and
6Division of Developmental Biology, Cincinnati Children’s Hospital Medical Center, Cincinnati, Ohio, USA.
7Division of Hematology/Oncology, Department of Pediatrics, Peckham Center for Cancer and Blood Disorders, Rady Children’s Hospital, San Diego, California, USA.
8UCSD, La Jolla, California, USA.
Address correspondence to: James I. Geller, 3020 Children’s Way, San Diego, California, 92123, USA. Phone: 513.739.4554; Email: jgeller@rchsd.org.
Authorship note: MA and KAD contributed equally to this work.
Find articles by VandenHeuvel, K. in: PubMed | Google Scholar
1Division of Experimental Hematology and Cancer Biology, Cancer and Blood Diseases Institute, Cincinnati Children’s Hospital Medical Center, Cincinnati, Ohio, USA.
2Division of Pediatric Nephrology, University of Texas Southwestern Medical Center, Dallas, Texas, USA.
3Pediatric Nephrology Unit, Dana Dwek Children’s Hospital, Tel Aviv Sourasky University Medical Center (Ichilov), Tel Aviv, Israel.
4Grey Faculty of Medical & Health Sciences, Tel Aviv University, Tel Aviv, Israel.
5Division of Pathology and Laboratory Medicine, and
6Division of Developmental Biology, Cincinnati Children’s Hospital Medical Center, Cincinnati, Ohio, USA.
7Division of Hematology/Oncology, Department of Pediatrics, Peckham Center for Cancer and Blood Disorders, Rady Children’s Hospital, San Diego, California, USA.
8UCSD, La Jolla, California, USA.
Address correspondence to: James I. Geller, 3020 Children’s Way, San Diego, California, 92123, USA. Phone: 513.739.4554; Email: jgeller@rchsd.org.
Authorship note: MA and KAD contributed equally to this work.
Find articles by Potter, S. in: PubMed | Google Scholar
1Division of Experimental Hematology and Cancer Biology, Cancer and Blood Diseases Institute, Cincinnati Children’s Hospital Medical Center, Cincinnati, Ohio, USA.
2Division of Pediatric Nephrology, University of Texas Southwestern Medical Center, Dallas, Texas, USA.
3Pediatric Nephrology Unit, Dana Dwek Children’s Hospital, Tel Aviv Sourasky University Medical Center (Ichilov), Tel Aviv, Israel.
4Grey Faculty of Medical & Health Sciences, Tel Aviv University, Tel Aviv, Israel.
5Division of Pathology and Laboratory Medicine, and
6Division of Developmental Biology, Cincinnati Children’s Hospital Medical Center, Cincinnati, Ohio, USA.
7Division of Hematology/Oncology, Department of Pediatrics, Peckham Center for Cancer and Blood Disorders, Rady Children’s Hospital, San Diego, California, USA.
8UCSD, La Jolla, California, USA.
Address correspondence to: James I. Geller, 3020 Children’s Way, San Diego, California, 92123, USA. Phone: 513.739.4554; Email: jgeller@rchsd.org.
Authorship note: MA and KAD contributed equally to this work.
Find articles by Geller, J. in: PubMed | Google Scholar
Published June 9, 2026 - More info
JCI Insight. 2026;11(15):e188078. https://doi.org/10.1172/jci.insight.188078.
© 2026 Adam et al. This work is licensed under the Creative Commons Attribution 4.0 International License. To view a copy of this license, visit http://creativecommons.org/licenses/by/4.0/.
Received: October 14, 2024; Accepted: June 5, 2026


-
Results
Single-nucleus profiling of favorable-histology Wilms tumor integrated with a reference atlas including adjacent kidney tissue and human fetal kidney identifies distinct tumor cell types. snRNA-seq was performed on favorable-histology Wilms tumor samples obtained from surgical resection specimens prior to chemotherapy in addition to histologically normal-appearing adjacent kidney tissue samples biobanked at the time of surgery. Samples in this study included 9 tumors, 4 patient-matched samples from corresponding tumors, and 1 additional adjacent kidney sample (Table 1), as this provided samples from both male/female adjacent kidney tissue to be included in the reference atlas.
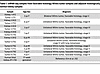 Table 1
snRNA-seq samples from favorable-histology Wilms tumor samples and adjacent histologically normal kidney samples
Given that Wilms tumors maintain features of the developing kidney, we first established a normal kidney reference (Figure 1A) from the 5 adjacent kidney samples (15,997 nuclei) along with human fetal kidney snRNA-seq (12), including 4 replicates of 17-week-gestation fetus (19,330 nuclei) that were integrated into a single data set, resulting in a total of 35,327 nuclei after preliminary filtering. Expected cell types are identified in the data set (Figure 1A), with representative marker genes shown via dot plot for cell clusters (Figure 1B), including NPCs (SIX2, EYA1), cycling NPCs (TOP2A, MKI67), early differentiating cells/renal vesicles (RVs) (LXH1), early proximal tubules (CDH6), proximal tubules (SLC34A1), podocytes (NPHS2), loop of Henle (SLC12A1), distal tubules (SLC12A3), collecting duct principal (AQP3) and intercalated (FOXI1) cells, endothelial cells (PECAM1), and interstitial (e.g., stromal) cells (COL1A1, DCN). As shown in Figure 1A, this provided a robust dataset from progenitor populations through the spectrum of differentiation to mature cell types, with a complete marker list for each annotated cell type provided in Supplemental Data File 1; supplemental material available online with this article; https://doi.org/10.1172/jci.insight.188078DS1
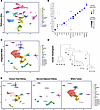 Figure 1
snRNA-seq identifies diverse cell types from favorable-histology Wilms tumor samples. (A and B) To evaluate how tumors maintain features of their developmental origins, we generated an snRNA-seq reference atlas consisting of 4 samples from 17-week-gestation human fetal kidney along with 5 tumor-adjacent kidney samples confirmed to be histologically normal kidney as reviewed by a pathologist prior to sequencing (A). Marker gene expression was used to identify captured cell types, with representative genes shown via dot plot (B). (C–E) To identify the cell types captured from Wilms tumor samples, snRNA-seq from 9 tumors was integrated with the reference atlas (C). Hierarchical analysis (i.e., cluster dendogram) shows transcriptional similarity of Wilms tumors with human fetal kidney in comparison to tumor-adjacent kidney samples (D). Tumor samples consist of a substantial proportion of blastemal cells clustering with human fetal nephron progenitors, early differentiating nephron structures (i.e., renal vesicles), and early tubule cells (i.e., pretubule), in addition to capturing other cell types including interstitial, endothelial, and immune cells (E). NPC, nephron progenitor cell; RV, renal vesicle; CNT, connecting tubule; DT, distal tubule; CD-P, collecting duct principal cell; CD-I, collecting duct intercalated cell; LoH, loop of Henle; tdlLOH, thick descending limb of loop of Henle; PrePT, precursor proximal tubule; PT, proximal tubule.
Next, snRNA-seq from the 9 Wilms tumor samples (totaling 71,098 nuclei) were integrated with the reference kidney atlas (Figure 1C). Hierarchical clustering analysis, with bulk transcriptomic data from each individual sample compared to one another and visualized via cluster dendrogram, suggests that tumors overall show a closer relationship to human fetal kidney compared with the adjacent kidney samples (Figure 1D). Tumor cell type annotation, including the blastemal, epithelial, or stromal (e.g., interstitial) compartments, was determined based on cell clustering in comparison with the reference atlas. This analysis identified tumor samples consisting of nephron lineage cells, including blastema clustering with fetal NPCs, early differentiating cells/RVs, and stroma (e.g., interstitial cells) from the fetal kidney samples, while podocytes, immune cells, and endothelial cells captured from tumors clustered with corresponding cell types from the adjacent normal kidney samples (Figure 1E). A full marker list of all the cell types is shown in Supplemental Data File 2.
To evaluate how the captured cell types by snRNA-seq correlate with the histological classification of the tumor samples, H&E-stained tissues adjacent to the sample used for snRNA-seq were reviewed by a pathologist to quantify the percent of blastemal, epithelial, and stromal compartments from each sample, with representative images from selected tumors shown in comparison to human fetal kidney (Figure 2A). While the snRNA-seq data overall correlate well with the histological elements on H&E (Figure 2B and Supplemental Tables 1 and 2), we notably identified 2 tumors showing discordant findings. This includes sample T1, which shows stromal predominance by histology but primary blastema captured by snRNA-seq, and T4, which shows epithelial predominance by histology but with an increased percentage of blastema captured by snRNA-seq. Further evaluation of specific cell types captured (Figure 2C) shows tumor cells clustering with various cell types along the nephron lineage (i.e., NPCs, RVs, pretubule cells, and podocytes). Adjacent kidney samples show epithelial predominance, with the exception of sample K3 that shows an increased proportion of interstitial and endothelial cells captured by snRNA-seq possibly due to sampling of a vascular or medullary region of the kidney. Additionally, a small percentage of blastemal cells were captured in the adjacent, histologically normal samples, including 3% in K5 and 1.2% in K4. It is unclear whether these cells could be due to tumor margins close to the sampled tissue, as has been reported previously (27), versus blastemal cells possibly infiltrating the normal kidney tissue or contamination during surgical resection, but given this small number of cells, these were not included in further analyses.
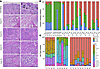 Figure 2
Histological examination of tumor samples correlates with cell types captured via snRNA-seq, with the exception of tumors T1 and T4. (A) H&E images of the fetal kidney compared to Wilms tumor samples show similar histological features. In the human fetal kidney, nephron progenitor cells (asterisks), early differentiating nephron structures (arrowheads), and early tubules (arrows) localize to the outer nephrogenic zone of the developing kidney, with Wilms tumors known to maintain features of these fetal cells. Representative H&E images of human fetal kidney and selected tumors are shown here. Original magnification, ×10 (left) and ×20 (right). Scale bars: 100 μm. (B) Tumor histology was scored by a pathologist to quantify the percentage of blastemal, epithelial, and stromal compartments from each sample. While the majority of tumors showed correlation between the tumor components captured via snRNA-seq and the histological score, there were discrepancies noted for T1, which showed interstitial (i.e., stromal) predominance by histology versus blastemal predominance by snRNA-seq and for T4, which showed epithelial predominance by histology versus blastemal predominance by snRNA-seq. (C) Evaluation of the specific cell types captured (i.e., percentage cell type) is shown for each sample, demonstrating populations of cells along the spectrum of the nephron lineage, including undifferentiated NPCs to RVs/pretubules, found to within tumor samples. NPC, nephron progenitor cell; RV, renal vesicle; CNT, connecting tubule; DT, distal tubule; CD-P, collecting duct principal cell; CD-I, collecting duct intercalated cell; LoH, loop of Henle; tdlLOH, thick descending limb of loop of Henle; PT, proximal tubule.
Transcriptional profiles from blastemal, stromal, and epithelial components shows multilineage plasticity. While previous single-cell transcriptomic studies have shown that Wilms tumors maintain fetal transcriptional profiles (15, 16), these studies were limited by the use of samples obtained after chemotherapy. Here, treatment-naive samples were sequenced and selected genes showing specific expression patterns in human fetal kidney cell types were evaluated in tumor components (Figure 3A). In the developing kidney, several genes show cell-type-specific expression patterns, with SIX2 and WT1 expressed in NPCs, PAX2 and PAX8 expressed in the nephron lineage (i.e., NPCs and differentiating epithelial cells) but not the interstium/stroma, and several genes (i.e., PDGFRA, PDGFRB, and POSTN) showing expression in the interstitium but not the nephron lineage. Analysis of these selected genes in tumor components shows misexpression of several lineage-specific markers, including SIX2 expression in epithelial cells of T1 and T5, POSTN expression in the blastema of T3, T5, T7, and T8, and PAX2 and PAX8 expression in the interstitium of T4 and T8. Immunoassay validation for the selected markers was performed (Figure 3B), with coexpression of the NPC marker SIX2 and stroma-specific gene PDGFRα observed in specific cells of sample T1. Additionally, stromal cells marked by POSTN appear to show nuclear SIX2 expression in T1 and T5, which may account for the discrepancy in which the histology of sample T1 showed stromal predominance by H&E but the snRNA-seq data showed cell types clustering with the blastema. Furthermore, immunoassay validation showed cellular heterogeneity for a number of markers, including SIX2 and PAX2 expression in T5 as well as WT1 in T6, ALDH1A2 in T4, VCAN in T9, and the proliferation marker PCNA in T4 and T9.
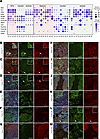 Figure 3
Blastemal, stromal, and epithelial components from favorable-histology Wilms tumor show multilineage plasticity. (A) The expression pattern of selected genes from the snRNA-seq dataset was evaluated across the NPC/blastema, stromal, and epithelial components of human fetal kidney and tumor snRNA-seq data. In the fetal kidney, several genes show cell-type-specific expression patterns, with SIX2 and WT1 primarily expressed in NPCs, PAX2 and PAX8 expressed in the nephron lineage (i.e., NPCs and differentiating epithelial cells, but not the interstium/stroma), and PDGFRA, PDGFRB, and POSTN expressed in the interstitium. Tumor snRNA-seq shows misexpression of several lineage-specific genes, including SIX2 expression in epithelial cells of T1 and T5, POSTN expression in the blastema of T3, T5, and T7, and PAX8 expression in the interstitium of T4 with both PAX2 and PAX8 in T8. (B–M) Representative images of immunofluorescence validation confirms expression of the selected markers in tumor samples, with costaining showing misexpression of a number of lineage-specific markers. Specifically, SIX2-expressing cells appear to show coexpression of PDGFRα (B, arrows) and POSTN (C and D, arrows). Additionally, PAX2 appears coexpressed with PDGFRα in some regions of T8 (L, arrow). Representative images of tumors from at least 2 separately stained sections are shown at ×10 magnification. Scale bars: 100 μm.
Wilms tumor blastema shows both intra- and intertumor heterogeneity. We next sought to further evaluate how the blastemal populations isolated from 9 favorable-histology Wilms tumors compare to fetal kidney NPCs and the developing nephron lineage. To do this, we first reevaluated human fetal kidney NPCs and early differentiating cells for subclusters showing distinct transcriptional profiles (Figure 4, A and B, with differentially expressed genes [DEGs] distinguishing the subclusters provided in Supplemental Data File 3). This analysis identified a total of 10 subclusters, including 3 subclusters of self-renewing or “uninduced” NPCs, 2 sublclusters of “induced” NPCs, as well as precursor cells of the proximal tubules, podocytes, parietal cells, distal tubule, and connecting tubule. Blastemal cells were then integrated with the human fetal kidney cell clusters (Figure 4C), with this analysis suggesting that the blastema from the majority of tumors clusters with cells along the spectrum of normal fetal kidney differentiation trajectory, with the exception of sample T4 that clusters exclusively with podocyte/podocyte precursor cells.
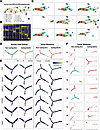 Figure 4
Trajectory analysis of Wilms tumor blastema shows intra- and intertumor heterogeneity. (A and B) To evaluate how tumor blastema resembles the differentiation trajectory of the nephron lineage, we further analyzed human fetal kidney snRNA-seq samples to identify subclusters of nephron lineage along the differentiation trajectory from self-renewing NPCs to differentiated cells. Unsupervised cell clustering identified 10 clusters (A) based on differential transcriptional profiles with selected genes highlighted in this heatmap (B), with this analyses identifying 3 subclusters of uninduced NPCs (i.e., 8, 3, and 0), 2 subclusters of induced NPCs (i.e., 2 and 5), and precursor populations for early podocytes (i.e., 1 and 6), proximal tubules (i.e., 4), parietal cells (i.e., 7), distal tubules (i.e., 9), and connecting tubules (i.e., 10). (C) Integration of tumor blastema from each of the 9 samples shows that the blastema from the majority of tumors clusters with cells along the spectrum of normal fetal kidney differentiation trajectory, with the exception of T4 that clusters exclusively podocyte precursors. (D–F) To further evaluate this, we first pooled the blastema from all 9 samples and analyzed the differentiation trajectory of noncycling versus cycling cells. As a control, fetal kidney cells were analyzed via the same methodology, with interstitial cells clustering separately from the nephron lineage. However, tumor blastema shows a mix of differential trajectories, with expression of pretubule, podocyte, and interstitial genes among the differentiation trajectories (D). Additionally, the cycling cells show enriched expression of NPCs genes (i.e., EYA1) and decreased expression of tubular markers (i.e., HNF1B and LIMCH1) along with both the cycling and noncycling tumor blastema showing misexpression of interstitial genes (i.e., COL6A3 and EBF1) and PAX3, which is normally not expressed in the human fetal kidney (E). Differential trajectories were then evaluated for the noncycling and cycling blastema from each individual tumor (F). Color coding shows representation along the differentiation trajectory, with orange representing NPC signature, green representing an epithelial signature, and blue representing a mixed signature.
Given the proliferative capacity that has been previously reported in Wilms tumor blastema, we next analyzed the differentiation trajectory of the noncycling versus cycling blastema, with human fetal kidney cells analyzed via the same methodology for comparison. Monocle was used to order the isolated blastemal cells based on their transcription factor expression profile to determine the differentiation state of the cells. Given the lineage plasticity previously identified (i.e., Figure 3) with blastemal cells showing expression of genes normally localized to interstitial/stromal cells, we additionally included stromal cells of the human fetal kidney in the control analysis as a comparison when mapping expression of stromal marker genes as well. As expected, both cycling and noncycling human fetal kidney NPCs cluster along a differentiation trajectory from uninduced NPCs to tubular precursor cells plotted left to right, with the stromal/interstitial cells plotting as a separate cluster. However, this analysis of tumor blastema interestingly shows a loss of this ordered differentiation trajectory (Figure 4, D and E), with the cycling cells showing increased expression of the uninduced NPC marker EYA1, a lack of the differentiating NPC marker HNF1B, and misexpression of the distal tubular marker LIMCH1 and stromal genes COL6A3 and EBF1 as well as PAX3. Interestingly, although cycling cells from the tumor blastema show a more undifferentiated signature, reflected by elevated EYA1 expression, they continue to express stromal genes (e.g., COL6A3 and EBF1) and differentiation-associated markers (e.g., LIMCH1). When evaluating the differentiation trajectory of individual tumors (Figure 4F), the patterns of “more” or “less” differentiated tumors emerge, with T1, T2, T5, T7, T8, and T9 showing a more “undifferentiated” signature, while T3, T4, and T6 blastema included cells with a more “differentiated” signature based on this trajectory analysis, with orange representing an NPC signature, green representing an epithelial signature, and blue representing a mixed signature.
Pathway enrichment analyses provide insights into both cycling and noncycling blastema in Wilms tumor. To further evaluate how the transcriptome from tumor blastema compares to fetal kidney NPCs/RVs, we identified DEGs and evaluated these transcriptomic changes in the context of biological pathway analyses. First, blastemal cells from the 9 tumor samples were pooled and compared to fetal kidney NPCs/RVs, with DEGs shown via volcano plot (Figure 5A and Supplemental Data File 4). To evaluate for intertumor transcriptional heterogeneity, we next examined the expression of top DEGs across the 9 tumor samples (Figure 5B) and found that some gene expression changes were fairly uniformly conserved (e.g., downregulation of CTCF and upregulation of NEAT1 in comparison with fetal kidney cells), whereas a number of other genes showed striking differences among the individual tumor samples (e.g., downregulation of MSH2 and ERBB4 and upregulation of CCND2 and PAX3). Given this heterogeneity in gene expression, we sought to perform pathway enrichment analyses to potentially uncover both common and distinct pathways in the tumor blastema that may be difficult to predict from individual gene expression changes alone. To do this, Gene Ontology (GO) biological processes, Kyoto Encyclopedia of Genes and Genomes (KEGG), and Reactome pathway enrichment analyses were performed separately on the noncycling and cycling blastema cells compared to normal adjacent kidney tissue as well as fetal NPCs/RVs (Supplemental Data File 5), with selected pathways shown in Figure 5, C–K. As expected, gene pathways for renal epithelium and glomerulus development were enriched in the normal adjacent kidney tissue compared with the fetal cells and tumor blastema (Figure 5C), with the exception of T4 that also showed enrichment for glomerulus development consistent with podocyte signature identified in the previous clustering analysis (Figure 4C). We additionally identified a number of enriched pathways across several tumor samples, including regulation of stem cell population maintenance, regulation of axonogenesis, striated muscle development, glutamate receptor signaling, and ephrin receptor signaling, all of which show shared features with human fetal kidney cells. However, additional identified pathways, including regulation of RNA splicing, heterochromatin formation, epigenetic regulation of gene expression, and transcriptional misregulation in cancer appear enriched in certain samples of tumor blastema. When looking at pathways enriched in the cycling blastemal cells, we identify cell cycle checkpoint signaling, DNA integrity checkpoint signaling, Polycomb repressive complex (PRC), and ATP-dependent chromatin remodeling. We also compared genes that were downregulated across the samples, with this analysis suggesting decreased FoxO signaling, ubiquitin mediated proteolysis, circadian rhythm regulation via BMAL, CLOCK, and NPAS2, as well as cell death signaling. Given the heterogeneity observed across tumor samples, we additionally evaluated selected genes from specific pathways (Figure 5B), including PRC, ATP-dependent chromatin remodeling, epigenetic regulation, cell cycle checkpoint signaling, anterior-posterior patterning specification, signaling by neurotrophic receptor tyrosine kinases (NTRKs), and regulation of dendritic spine development. This analysis interestingly confirms gene expression changes corresponding to identified pathways and further demonstrates that such types of analyses may aid in the approach to understanding transcriptional heterogeneity in Wilms tumor.
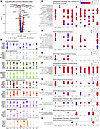 Figure 5
Differentially expressed gene (DEG) analysis of Wilms tumor blastema further demonstrates both intra- and intertumor heterogeneity. (A and B) To evaluate for transcriptional changes in tumor blastema versus human fetal kidney NPCs and early differentiating cells, we first pooled cells these cells from all the samples in the 2 groups and analyzed for DEGs as shown via volcano plot (A). Given the heterogeneity observed across tumor samples, we next evaluated selected downregulated and upregulated gene expression across the 9 tumors via dot plots (B) with selected genes from the DEG analyses shown above as well as the pathway enrichment analysis highlighted via dot plot. (C–K) Pathway analysis was performed separately both the noncycling and cycling blastema, with this analysis highlighting a number of transcriptional pathways and demonstrating remarkable intertumor heterogeneity in the blastemal cells from favorable-histology Wilms tumors. Notably, the analyses of cycling cells from adjacent kidney samples showed insufficient genes for KEGG and Reactome (G and H, respectively) and were not included in these analyses.


