
Clinical Research and Public HealthAIDS/HIVEndocrinology
Open Access |  10.1172/jci.insight.195922
A distinct form of fat fibrosis is linked to insulin resistance in people with HIV
Diana L. Alba,1 Alaa Abdellatif,2,3,4 Moon Kyung Choi,5 Stephen M. Brown Mayfield,6 Thuy An T. Pham,6 David I. Berrios,6 Antonio E. Rodriguez,7 Marin Ewing,7 Tony R. Figueroa,7 Judy Gonzalez-Vargas,2 Ningyan Zhang,8 Zhiqiang An,8 Dawei Bu,9 Steven G. Deeks,7 Philipp E. Scherer,9 Peter W. Hunt,10 and Suneil K. Koliwad5,6
1Division of Endocrinology, Diabetes and Metabolism, Department of Medicine, Zuckerberg San Francisco General Hospital and UCSF, San Francisco, California, USA.
2UCSF Center for AIDS Research (CFAR), San Francisco, California, USA.
3UCSF AIDS Research Institute, San Francisco, California, USA.
4UCSF Data Science CoLab, San Francisco, California, USA.
5Division of Endocrinology & Metabolism, UCSF, San Francisco, California, USA.
6UCSF Diabetes Center, San Francisco, California, USA.
7Division of HIV, Infectious Diseases, and Global Medicine, UCSF, San Francisco, California, USA.
8Texas Therapeutics Institute, Brown Foundation Institute of Molecular Medicine, University of Texas Health Science Center at Houston, Houston, Texas, USA.
9Touchstone Diabetes Center, University of Texas Southwestern Medical Center, Dallas, Texas, USA.
10Division of Experimental Medicine, Department of Medicine, Zuckerberg San Francisco General Hospital and UCSF, San Francisco, California, USA.
Address correspondence to: Suneil Koliwad, 513 Parnassus Avenue, MSB, #1230B, San Francisco, Calfornia, 94143, USA. Phone: 415.476.9623; Email: Suneil.koliwad@ucsf.edu. Or to: Diana Alba, 2540 23rd St, 2nd Floor, #2701, San Francisco, Calfornia, 94143, USA. Phone: 628.206.7749; Email: Diana.alba@ucsf.edu.
Authorship note: DLA and SKK contributed equally to this work. AA and MKC contributed equally to this work.
Find articles by Alba, D. in: PubMed | Google Scholar
1Division of Endocrinology, Diabetes and Metabolism, Department of Medicine, Zuckerberg San Francisco General Hospital and UCSF, San Francisco, California, USA.
2UCSF Center for AIDS Research (CFAR), San Francisco, California, USA.
3UCSF AIDS Research Institute, San Francisco, California, USA.
4UCSF Data Science CoLab, San Francisco, California, USA.
5Division of Endocrinology & Metabolism, UCSF, San Francisco, California, USA.
6UCSF Diabetes Center, San Francisco, California, USA.
7Division of HIV, Infectious Diseases, and Global Medicine, UCSF, San Francisco, California, USA.
8Texas Therapeutics Institute, Brown Foundation Institute of Molecular Medicine, University of Texas Health Science Center at Houston, Houston, Texas, USA.
9Touchstone Diabetes Center, University of Texas Southwestern Medical Center, Dallas, Texas, USA.
10Division of Experimental Medicine, Department of Medicine, Zuckerberg San Francisco General Hospital and UCSF, San Francisco, California, USA.
Address correspondence to: Suneil Koliwad, 513 Parnassus Avenue, MSB, #1230B, San Francisco, Calfornia, 94143, USA. Phone: 415.476.9623; Email: Suneil.koliwad@ucsf.edu. Or to: Diana Alba, 2540 23rd St, 2nd Floor, #2701, San Francisco, Calfornia, 94143, USA. Phone: 628.206.7749; Email: Diana.alba@ucsf.edu.
Authorship note: DLA and SKK contributed equally to this work. AA and MKC contributed equally to this work.
Find articles by Abdellatif, A. in: PubMed | Google Scholar
1Division of Endocrinology, Diabetes and Metabolism, Department of Medicine, Zuckerberg San Francisco General Hospital and UCSF, San Francisco, California, USA.
2UCSF Center for AIDS Research (CFAR), San Francisco, California, USA.
3UCSF AIDS Research Institute, San Francisco, California, USA.
4UCSF Data Science CoLab, San Francisco, California, USA.
5Division of Endocrinology & Metabolism, UCSF, San Francisco, California, USA.
6UCSF Diabetes Center, San Francisco, California, USA.
7Division of HIV, Infectious Diseases, and Global Medicine, UCSF, San Francisco, California, USA.
8Texas Therapeutics Institute, Brown Foundation Institute of Molecular Medicine, University of Texas Health Science Center at Houston, Houston, Texas, USA.
9Touchstone Diabetes Center, University of Texas Southwestern Medical Center, Dallas, Texas, USA.
10Division of Experimental Medicine, Department of Medicine, Zuckerberg San Francisco General Hospital and UCSF, San Francisco, California, USA.
Address correspondence to: Suneil Koliwad, 513 Parnassus Avenue, MSB, #1230B, San Francisco, Calfornia, 94143, USA. Phone: 415.476.9623; Email: Suneil.koliwad@ucsf.edu. Or to: Diana Alba, 2540 23rd St, 2nd Floor, #2701, San Francisco, Calfornia, 94143, USA. Phone: 628.206.7749; Email: Diana.alba@ucsf.edu.
Authorship note: DLA and SKK contributed equally to this work. AA and MKC contributed equally to this work.
Find articles by Choi, M. in: PubMed | Google Scholar
1Division of Endocrinology, Diabetes and Metabolism, Department of Medicine, Zuckerberg San Francisco General Hospital and UCSF, San Francisco, California, USA.
2UCSF Center for AIDS Research (CFAR), San Francisco, California, USA.
3UCSF AIDS Research Institute, San Francisco, California, USA.
4UCSF Data Science CoLab, San Francisco, California, USA.
5Division of Endocrinology & Metabolism, UCSF, San Francisco, California, USA.
6UCSF Diabetes Center, San Francisco, California, USA.
7Division of HIV, Infectious Diseases, and Global Medicine, UCSF, San Francisco, California, USA.
8Texas Therapeutics Institute, Brown Foundation Institute of Molecular Medicine, University of Texas Health Science Center at Houston, Houston, Texas, USA.
9Touchstone Diabetes Center, University of Texas Southwestern Medical Center, Dallas, Texas, USA.
10Division of Experimental Medicine, Department of Medicine, Zuckerberg San Francisco General Hospital and UCSF, San Francisco, California, USA.
Address correspondence to: Suneil Koliwad, 513 Parnassus Avenue, MSB, #1230B, San Francisco, Calfornia, 94143, USA. Phone: 415.476.9623; Email: Suneil.koliwad@ucsf.edu. Or to: Diana Alba, 2540 23rd St, 2nd Floor, #2701, San Francisco, Calfornia, 94143, USA. Phone: 628.206.7749; Email: Diana.alba@ucsf.edu.
Authorship note: DLA and SKK contributed equally to this work. AA and MKC contributed equally to this work.
Find articles by Brown Mayfield, S. in: PubMed | Google Scholar
1Division of Endocrinology, Diabetes and Metabolism, Department of Medicine, Zuckerberg San Francisco General Hospital and UCSF, San Francisco, California, USA.
2UCSF Center for AIDS Research (CFAR), San Francisco, California, USA.
3UCSF AIDS Research Institute, San Francisco, California, USA.
4UCSF Data Science CoLab, San Francisco, California, USA.
5Division of Endocrinology & Metabolism, UCSF, San Francisco, California, USA.
6UCSF Diabetes Center, San Francisco, California, USA.
7Division of HIV, Infectious Diseases, and Global Medicine, UCSF, San Francisco, California, USA.
8Texas Therapeutics Institute, Brown Foundation Institute of Molecular Medicine, University of Texas Health Science Center at Houston, Houston, Texas, USA.
9Touchstone Diabetes Center, University of Texas Southwestern Medical Center, Dallas, Texas, USA.
10Division of Experimental Medicine, Department of Medicine, Zuckerberg San Francisco General Hospital and UCSF, San Francisco, California, USA.
Address correspondence to: Suneil Koliwad, 513 Parnassus Avenue, MSB, #1230B, San Francisco, Calfornia, 94143, USA. Phone: 415.476.9623; Email: Suneil.koliwad@ucsf.edu. Or to: Diana Alba, 2540 23rd St, 2nd Floor, #2701, San Francisco, Calfornia, 94143, USA. Phone: 628.206.7749; Email: Diana.alba@ucsf.edu.
Authorship note: DLA and SKK contributed equally to this work. AA and MKC contributed equally to this work.
Find articles by Pham, T. in: PubMed | Google Scholar
1Division of Endocrinology, Diabetes and Metabolism, Department of Medicine, Zuckerberg San Francisco General Hospital and UCSF, San Francisco, California, USA.
2UCSF Center for AIDS Research (CFAR), San Francisco, California, USA.
3UCSF AIDS Research Institute, San Francisco, California, USA.
4UCSF Data Science CoLab, San Francisco, California, USA.
5Division of Endocrinology & Metabolism, UCSF, San Francisco, California, USA.
6UCSF Diabetes Center, San Francisco, California, USA.
7Division of HIV, Infectious Diseases, and Global Medicine, UCSF, San Francisco, California, USA.
8Texas Therapeutics Institute, Brown Foundation Institute of Molecular Medicine, University of Texas Health Science Center at Houston, Houston, Texas, USA.
9Touchstone Diabetes Center, University of Texas Southwestern Medical Center, Dallas, Texas, USA.
10Division of Experimental Medicine, Department of Medicine, Zuckerberg San Francisco General Hospital and UCSF, San Francisco, California, USA.
Address correspondence to: Suneil Koliwad, 513 Parnassus Avenue, MSB, #1230B, San Francisco, Calfornia, 94143, USA. Phone: 415.476.9623; Email: Suneil.koliwad@ucsf.edu. Or to: Diana Alba, 2540 23rd St, 2nd Floor, #2701, San Francisco, Calfornia, 94143, USA. Phone: 628.206.7749; Email: Diana.alba@ucsf.edu.
Authorship note: DLA and SKK contributed equally to this work. AA and MKC contributed equally to this work.
Find articles by Berrios, D. in: PubMed | Google Scholar
1Division of Endocrinology, Diabetes and Metabolism, Department of Medicine, Zuckerberg San Francisco General Hospital and UCSF, San Francisco, California, USA.
2UCSF Center for AIDS Research (CFAR), San Francisco, California, USA.
3UCSF AIDS Research Institute, San Francisco, California, USA.
4UCSF Data Science CoLab, San Francisco, California, USA.
5Division of Endocrinology & Metabolism, UCSF, San Francisco, California, USA.
6UCSF Diabetes Center, San Francisco, California, USA.
7Division of HIV, Infectious Diseases, and Global Medicine, UCSF, San Francisco, California, USA.
8Texas Therapeutics Institute, Brown Foundation Institute of Molecular Medicine, University of Texas Health Science Center at Houston, Houston, Texas, USA.
9Touchstone Diabetes Center, University of Texas Southwestern Medical Center, Dallas, Texas, USA.
10Division of Experimental Medicine, Department of Medicine, Zuckerberg San Francisco General Hospital and UCSF, San Francisco, California, USA.
Address correspondence to: Suneil Koliwad, 513 Parnassus Avenue, MSB, #1230B, San Francisco, Calfornia, 94143, USA. Phone: 415.476.9623; Email: Suneil.koliwad@ucsf.edu. Or to: Diana Alba, 2540 23rd St, 2nd Floor, #2701, San Francisco, Calfornia, 94143, USA. Phone: 628.206.7749; Email: Diana.alba@ucsf.edu.
Authorship note: DLA and SKK contributed equally to this work. AA and MKC contributed equally to this work.
Find articles by Rodriguez, A. in: PubMed | Google Scholar
1Division of Endocrinology, Diabetes and Metabolism, Department of Medicine, Zuckerberg San Francisco General Hospital and UCSF, San Francisco, California, USA.
2UCSF Center for AIDS Research (CFAR), San Francisco, California, USA.
3UCSF AIDS Research Institute, San Francisco, California, USA.
4UCSF Data Science CoLab, San Francisco, California, USA.
5Division of Endocrinology & Metabolism, UCSF, San Francisco, California, USA.
6UCSF Diabetes Center, San Francisco, California, USA.
7Division of HIV, Infectious Diseases, and Global Medicine, UCSF, San Francisco, California, USA.
8Texas Therapeutics Institute, Brown Foundation Institute of Molecular Medicine, University of Texas Health Science Center at Houston, Houston, Texas, USA.
9Touchstone Diabetes Center, University of Texas Southwestern Medical Center, Dallas, Texas, USA.
10Division of Experimental Medicine, Department of Medicine, Zuckerberg San Francisco General Hospital and UCSF, San Francisco, California, USA.
Address correspondence to: Suneil Koliwad, 513 Parnassus Avenue, MSB, #1230B, San Francisco, Calfornia, 94143, USA. Phone: 415.476.9623; Email: Suneil.koliwad@ucsf.edu. Or to: Diana Alba, 2540 23rd St, 2nd Floor, #2701, San Francisco, Calfornia, 94143, USA. Phone: 628.206.7749; Email: Diana.alba@ucsf.edu.
Authorship note: DLA and SKK contributed equally to this work. AA and MKC contributed equally to this work.
Find articles by Ewing, M. in: PubMed | Google Scholar
1Division of Endocrinology, Diabetes and Metabolism, Department of Medicine, Zuckerberg San Francisco General Hospital and UCSF, San Francisco, California, USA.
2UCSF Center for AIDS Research (CFAR), San Francisco, California, USA.
3UCSF AIDS Research Institute, San Francisco, California, USA.
4UCSF Data Science CoLab, San Francisco, California, USA.
5Division of Endocrinology & Metabolism, UCSF, San Francisco, California, USA.
6UCSF Diabetes Center, San Francisco, California, USA.
7Division of HIV, Infectious Diseases, and Global Medicine, UCSF, San Francisco, California, USA.
8Texas Therapeutics Institute, Brown Foundation Institute of Molecular Medicine, University of Texas Health Science Center at Houston, Houston, Texas, USA.
9Touchstone Diabetes Center, University of Texas Southwestern Medical Center, Dallas, Texas, USA.
10Division of Experimental Medicine, Department of Medicine, Zuckerberg San Francisco General Hospital and UCSF, San Francisco, California, USA.
Address correspondence to: Suneil Koliwad, 513 Parnassus Avenue, MSB, #1230B, San Francisco, Calfornia, 94143, USA. Phone: 415.476.9623; Email: Suneil.koliwad@ucsf.edu. Or to: Diana Alba, 2540 23rd St, 2nd Floor, #2701, San Francisco, Calfornia, 94143, USA. Phone: 628.206.7749; Email: Diana.alba@ucsf.edu.
Authorship note: DLA and SKK contributed equally to this work. AA and MKC contributed equally to this work.
Find articles by Figueroa, T. in: PubMed | Google Scholar
1Division of Endocrinology, Diabetes and Metabolism, Department of Medicine, Zuckerberg San Francisco General Hospital and UCSF, San Francisco, California, USA.
2UCSF Center for AIDS Research (CFAR), San Francisco, California, USA.
3UCSF AIDS Research Institute, San Francisco, California, USA.
4UCSF Data Science CoLab, San Francisco, California, USA.
5Division of Endocrinology & Metabolism, UCSF, San Francisco, California, USA.
6UCSF Diabetes Center, San Francisco, California, USA.
7Division of HIV, Infectious Diseases, and Global Medicine, UCSF, San Francisco, California, USA.
8Texas Therapeutics Institute, Brown Foundation Institute of Molecular Medicine, University of Texas Health Science Center at Houston, Houston, Texas, USA.
9Touchstone Diabetes Center, University of Texas Southwestern Medical Center, Dallas, Texas, USA.
10Division of Experimental Medicine, Department of Medicine, Zuckerberg San Francisco General Hospital and UCSF, San Francisco, California, USA.
Address correspondence to: Suneil Koliwad, 513 Parnassus Avenue, MSB, #1230B, San Francisco, Calfornia, 94143, USA. Phone: 415.476.9623; Email: Suneil.koliwad@ucsf.edu. Or to: Diana Alba, 2540 23rd St, 2nd Floor, #2701, San Francisco, Calfornia, 94143, USA. Phone: 628.206.7749; Email: Diana.alba@ucsf.edu.
Authorship note: DLA and SKK contributed equally to this work. AA and MKC contributed equally to this work.
Find articles by Gonzalez-Vargas, J. in: PubMed | Google Scholar
1Division of Endocrinology, Diabetes and Metabolism, Department of Medicine, Zuckerberg San Francisco General Hospital and UCSF, San Francisco, California, USA.
2UCSF Center for AIDS Research (CFAR), San Francisco, California, USA.
3UCSF AIDS Research Institute, San Francisco, California, USA.
4UCSF Data Science CoLab, San Francisco, California, USA.
5Division of Endocrinology & Metabolism, UCSF, San Francisco, California, USA.
6UCSF Diabetes Center, San Francisco, California, USA.
7Division of HIV, Infectious Diseases, and Global Medicine, UCSF, San Francisco, California, USA.
8Texas Therapeutics Institute, Brown Foundation Institute of Molecular Medicine, University of Texas Health Science Center at Houston, Houston, Texas, USA.
9Touchstone Diabetes Center, University of Texas Southwestern Medical Center, Dallas, Texas, USA.
10Division of Experimental Medicine, Department of Medicine, Zuckerberg San Francisco General Hospital and UCSF, San Francisco, California, USA.
Address correspondence to: Suneil Koliwad, 513 Parnassus Avenue, MSB, #1230B, San Francisco, Calfornia, 94143, USA. Phone: 415.476.9623; Email: Suneil.koliwad@ucsf.edu. Or to: Diana Alba, 2540 23rd St, 2nd Floor, #2701, San Francisco, Calfornia, 94143, USA. Phone: 628.206.7749; Email: Diana.alba@ucsf.edu.
Authorship note: DLA and SKK contributed equally to this work. AA and MKC contributed equally to this work.
Find articles by Zhang, N. in: PubMed | Google Scholar
1Division of Endocrinology, Diabetes and Metabolism, Department of Medicine, Zuckerberg San Francisco General Hospital and UCSF, San Francisco, California, USA.
2UCSF Center for AIDS Research (CFAR), San Francisco, California, USA.
3UCSF AIDS Research Institute, San Francisco, California, USA.
4UCSF Data Science CoLab, San Francisco, California, USA.
5Division of Endocrinology & Metabolism, UCSF, San Francisco, California, USA.
6UCSF Diabetes Center, San Francisco, California, USA.
7Division of HIV, Infectious Diseases, and Global Medicine, UCSF, San Francisco, California, USA.
8Texas Therapeutics Institute, Brown Foundation Institute of Molecular Medicine, University of Texas Health Science Center at Houston, Houston, Texas, USA.
9Touchstone Diabetes Center, University of Texas Southwestern Medical Center, Dallas, Texas, USA.
10Division of Experimental Medicine, Department of Medicine, Zuckerberg San Francisco General Hospital and UCSF, San Francisco, California, USA.
Address correspondence to: Suneil Koliwad, 513 Parnassus Avenue, MSB, #1230B, San Francisco, Calfornia, 94143, USA. Phone: 415.476.9623; Email: Suneil.koliwad@ucsf.edu. Or to: Diana Alba, 2540 23rd St, 2nd Floor, #2701, San Francisco, Calfornia, 94143, USA. Phone: 628.206.7749; Email: Diana.alba@ucsf.edu.
Authorship note: DLA and SKK contributed equally to this work. AA and MKC contributed equally to this work.
Find articles by
An, Z.
in:
PubMed
|
Google Scholar
|

1Division of Endocrinology, Diabetes and Metabolism, Department of Medicine, Zuckerberg San Francisco General Hospital and UCSF, San Francisco, California, USA.
2UCSF Center for AIDS Research (CFAR), San Francisco, California, USA.
3UCSF AIDS Research Institute, San Francisco, California, USA.
4UCSF Data Science CoLab, San Francisco, California, USA.
5Division of Endocrinology & Metabolism, UCSF, San Francisco, California, USA.
6UCSF Diabetes Center, San Francisco, California, USA.
7Division of HIV, Infectious Diseases, and Global Medicine, UCSF, San Francisco, California, USA.
8Texas Therapeutics Institute, Brown Foundation Institute of Molecular Medicine, University of Texas Health Science Center at Houston, Houston, Texas, USA.
9Touchstone Diabetes Center, University of Texas Southwestern Medical Center, Dallas, Texas, USA.
10Division of Experimental Medicine, Department of Medicine, Zuckerberg San Francisco General Hospital and UCSF, San Francisco, California, USA.
Address correspondence to: Suneil Koliwad, 513 Parnassus Avenue, MSB, #1230B, San Francisco, Calfornia, 94143, USA. Phone: 415.476.9623; Email: Suneil.koliwad@ucsf.edu. Or to: Diana Alba, 2540 23rd St, 2nd Floor, #2701, San Francisco, Calfornia, 94143, USA. Phone: 628.206.7749; Email: Diana.alba@ucsf.edu.
Authorship note: DLA and SKK contributed equally to this work. AA and MKC contributed equally to this work.
Find articles by Bu, D. in: PubMed | Google Scholar
1Division of Endocrinology, Diabetes and Metabolism, Department of Medicine, Zuckerberg San Francisco General Hospital and UCSF, San Francisco, California, USA.
2UCSF Center for AIDS Research (CFAR), San Francisco, California, USA.
3UCSF AIDS Research Institute, San Francisco, California, USA.
4UCSF Data Science CoLab, San Francisco, California, USA.
5Division of Endocrinology & Metabolism, UCSF, San Francisco, California, USA.
6UCSF Diabetes Center, San Francisco, California, USA.
7Division of HIV, Infectious Diseases, and Global Medicine, UCSF, San Francisco, California, USA.
8Texas Therapeutics Institute, Brown Foundation Institute of Molecular Medicine, University of Texas Health Science Center at Houston, Houston, Texas, USA.
9Touchstone Diabetes Center, University of Texas Southwestern Medical Center, Dallas, Texas, USA.
10Division of Experimental Medicine, Department of Medicine, Zuckerberg San Francisco General Hospital and UCSF, San Francisco, California, USA.
Address correspondence to: Suneil Koliwad, 513 Parnassus Avenue, MSB, #1230B, San Francisco, Calfornia, 94143, USA. Phone: 415.476.9623; Email: Suneil.koliwad@ucsf.edu. Or to: Diana Alba, 2540 23rd St, 2nd Floor, #2701, San Francisco, Calfornia, 94143, USA. Phone: 628.206.7749; Email: Diana.alba@ucsf.edu.
Authorship note: DLA and SKK contributed equally to this work. AA and MKC contributed equally to this work.
Find articles by
Deeks, S.
in:
PubMed
|
Google Scholar
|
1Division of Endocrinology, Diabetes and Metabolism, Department of Medicine, Zuckerberg San Francisco General Hospital and UCSF, San Francisco, California, USA.
2UCSF Center for AIDS Research (CFAR), San Francisco, California, USA.
3UCSF AIDS Research Institute, San Francisco, California, USA.
4UCSF Data Science CoLab, San Francisco, California, USA.
5Division of Endocrinology & Metabolism, UCSF, San Francisco, California, USA.
6UCSF Diabetes Center, San Francisco, California, USA.
7Division of HIV, Infectious Diseases, and Global Medicine, UCSF, San Francisco, California, USA.
8Texas Therapeutics Institute, Brown Foundation Institute of Molecular Medicine, University of Texas Health Science Center at Houston, Houston, Texas, USA.
9Touchstone Diabetes Center, University of Texas Southwestern Medical Center, Dallas, Texas, USA.
10Division of Experimental Medicine, Department of Medicine, Zuckerberg San Francisco General Hospital and UCSF, San Francisco, California, USA.
Address correspondence to: Suneil Koliwad, 513 Parnassus Avenue, MSB, #1230B, San Francisco, Calfornia, 94143, USA. Phone: 415.476.9623; Email: Suneil.koliwad@ucsf.edu. Or to: Diana Alba, 2540 23rd St, 2nd Floor, #2701, San Francisco, Calfornia, 94143, USA. Phone: 628.206.7749; Email: Diana.alba@ucsf.edu.
Authorship note: DLA and SKK contributed equally to this work. AA and MKC contributed equally to this work.
Find articles by
Scherer, P.
in:
PubMed
|
Google Scholar
|
1Division of Endocrinology, Diabetes and Metabolism, Department of Medicine, Zuckerberg San Francisco General Hospital and UCSF, San Francisco, California, USA.
2UCSF Center for AIDS Research (CFAR), San Francisco, California, USA.
3UCSF AIDS Research Institute, San Francisco, California, USA.
4UCSF Data Science CoLab, San Francisco, California, USA.
5Division of Endocrinology & Metabolism, UCSF, San Francisco, California, USA.
6UCSF Diabetes Center, San Francisco, California, USA.
7Division of HIV, Infectious Diseases, and Global Medicine, UCSF, San Francisco, California, USA.
8Texas Therapeutics Institute, Brown Foundation Institute of Molecular Medicine, University of Texas Health Science Center at Houston, Houston, Texas, USA.
9Touchstone Diabetes Center, University of Texas Southwestern Medical Center, Dallas, Texas, USA.
10Division of Experimental Medicine, Department of Medicine, Zuckerberg San Francisco General Hospital and UCSF, San Francisco, California, USA.
Address correspondence to: Suneil Koliwad, 513 Parnassus Avenue, MSB, #1230B, San Francisco, Calfornia, 94143, USA. Phone: 415.476.9623; Email: Suneil.koliwad@ucsf.edu. Or to: Diana Alba, 2540 23rd St, 2nd Floor, #2701, San Francisco, Calfornia, 94143, USA. Phone: 628.206.7749; Email: Diana.alba@ucsf.edu.
Authorship note: DLA and SKK contributed equally to this work. AA and MKC contributed equally to this work.
Find articles by
Hunt, P.
in:
PubMed
|
Google Scholar
|
1Division of Endocrinology, Diabetes and Metabolism, Department of Medicine, Zuckerberg San Francisco General Hospital and UCSF, San Francisco, California, USA.
2UCSF Center for AIDS Research (CFAR), San Francisco, California, USA.
3UCSF AIDS Research Institute, San Francisco, California, USA.
4UCSF Data Science CoLab, San Francisco, California, USA.
5Division of Endocrinology & Metabolism, UCSF, San Francisco, California, USA.
6UCSF Diabetes Center, San Francisco, California, USA.
7Division of HIV, Infectious Diseases, and Global Medicine, UCSF, San Francisco, California, USA.
8Texas Therapeutics Institute, Brown Foundation Institute of Molecular Medicine, University of Texas Health Science Center at Houston, Houston, Texas, USA.
9Touchstone Diabetes Center, University of Texas Southwestern Medical Center, Dallas, Texas, USA.
10Division of Experimental Medicine, Department of Medicine, Zuckerberg San Francisco General Hospital and UCSF, San Francisco, California, USA.
Address correspondence to: Suneil Koliwad, 513 Parnassus Avenue, MSB, #1230B, San Francisco, Calfornia, 94143, USA. Phone: 415.476.9623; Email: Suneil.koliwad@ucsf.edu. Or to: Diana Alba, 2540 23rd St, 2nd Floor, #2701, San Francisco, Calfornia, 94143, USA. Phone: 628.206.7749; Email: Diana.alba@ucsf.edu.
Authorship note: DLA and SKK contributed equally to this work. AA and MKC contributed equally to this work.
Find articles by
Koliwad, S.
in:
PubMed
|
Google Scholar
|
Published June 30, 2026 - More info
JCI Insight. 2026;11(15):e195922. https://doi.org/10.1172/jci.insight.195922.
© 2026 Alba et al. This work is licensed under the Creative Commons Attribution 4.0 International License. To view a copy of this license, visit http://creativecommons.org/licenses/by/4.0/.
Received: May 27, 2025; Accepted: June 16, 2026

-
Results
Participant characteristics. We studied 120 participants, including 74 PWoH and 46 PWH, summarized in Table 1. All the PWH maintained plasma HIV RNA levels below the detectable threshold for a minimum of 1 year before enrollment. The 2 groups were well matched for key clinical parameters related to glucose homeostasis, including fasting glucose and insulin levels, Homeostatic Model Assessment for Insulin Resistance (HOMA-IR), and hemoglobin A1c (HbA1c), reflecting our sampling strategy. Similarly, the 2 groups had a comparable age, mean BMI, and total body fat percentage (%BF), as measured using dual-energy x-ray absorptiometry (DXA). The PWH group included a higher proportion of males and Black participants compared with the PWoH group (both P < 0.01), consistent with the broader demographic features of PWH in the San Francisco Bay Area, where Black individuals are disproportionately affected by HIV (33). Approximately one-third of PWH (32%) had prior exposure to legacy d-drugs such as stavudine (d4T), didanosine (ddI), or zalcitabine (ddC), or related early-generation NRTIs such as zidovudine (AZT), either alone or in combination regimens such as Combivir or Trizivir.
In unadjusted analyses, PWH demonstrated a modest,nonsignificant trend toward greater visceral adiposity (%VAT/total body fat). However, multivariable linear regression did not support an independent relationship between HIV status and visceral adiposity (P = 0.37), although increasing age did predict VAT accrual (P < 0.001), consistent with established knowledge for humans in general (Supplemental Table 1; supplemental material available online with this article; https://doi.org/10.1172/jci.insight.195922DS1). Together, these results reassured us that our subsequent analyses were unlikely to be confounded by significant HIV-dependent differences in visceral adiposity between groups.
PWH have excess SAT fibrosis, independent of overall adiposity. We and others have shown that SAT fibrosis is closely linked to the development of IR, a major driver of T2D, in humans (24, 34, 35). Given the elevated metabolic risk of PWH, we assessed SAT fibrosis by quantifying levels of hydroxyproline (HYP), a key component of collagen and a validated marker of ECM remodeling (36), in SAT samples from our study participants. In unadjusted analyses, PWH had substantially higher SAT HYP levels than PWoH (Figure 1A). To determine whether this association reflects HIV status rather than differences in demographic characteristics or body composition, we performed multivariable linear regression on the data from both PWH and PWoH, adjusting for sex, age, race, and body fat percentage (%BF). Even after adjusting for these variables, HIV status remained independently associated with higher SAT HYP levels (P = 0.002). Male sex and %BF were also independently associated with higher SAT HYP levels, whereas age and race were not (Supplemental Table 2 and Supplemental Figure 1A). Together, these data support HIV status as an independent determinant of SAT fibrosis.
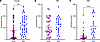 Figure 1
PWH have increased SAT fibrosis versus PWoH, particularly in those with normal %BF (NBF). Hydroxyproline (HYP) content (ng/mg) in SAT was compared between people without HIV (PWoH; purple) and people with HIV (PWH; blue). (A) In the overall cohort (PWoH, n = 74; PWH, n = 46), SAT HYP content was significantly higher in PWH than PWoH (P = 0.0004). (B) Subgroup analysis for participants with a high %BF (HBF; PWoH, n = 43; PWH, n = 26) showing no difference in SAT HYP between groups (P = 0.34). (C) Among participants with NBF, SAT HYP content was significantly elevated in PWH compared with PWoH (PWoH, n = 31; PWH, n = 20), (P < 0.0001). Differences between the 2 groups were analyzed by Mann-Whitney U test. *** P < 0.001, **** P < 0.0001.
To assess the extent to which the increased SAT fibrosis we saw among PWH was a function of either ART exposure or adiposity, we performed a separate multivariable linear regression analysis that was restricted to PWH. This model evaluated associations between SAT HYP levels and legacy d-drug exposure, current INSTI use, CD4+ T cell count at enrollment, and %BF (Supplemental Table 3). INSTI use was included because INSTI-based regimens, common in modern ART, are associated with weight gain and could potentially promote SAT fibrosis in PWH (37). Notably, we found that neither d-drug exposure, INSTI use, CD4 count, nor %BF drove the increased SAT HYP levels we saw in PWH, indicating that the development of SAT fibrosis in PWH is not simply due to legacy ART exposure, ongoing INSTI use, or increasing adiposity. Moreover, the inclusion of sex, age, and self-identified race in this PWH-restricted model did not substantively alter effect estimates or statistical inference for the primary covariates in sensitivity analyses (Supplemental Table 4). Given the sample size and the lack of any independent associations found in these multivariable analyses, the final model did not retain these added variables in order to avoid overfitting. Together, these findings indicate that HIV infection is independently associated with increased SAT fibrosis, while the variability in SAT fibrosis among PWH is not driven by either key ART classes implicated in the literature as potential confounders, notable demographic factors, or degree of adiposity.
Given that increasing adiposity and obesity are both associated with the development of SAT fibrosis in the general population (24–26), we next performed a subgroup analysis after classifying the study participants into groups based on %BF. We chose %BF instead of BMI, as BMI does not reliably distinguish between fat mass and lean mass and may therefore misclassify adiposity, particularly across sex and racial groups (38). In contrast, %BF provides a more direct measure of total adiposity and has been shown to more closely reflect metabolic disease risk than BMI (38–40). We used %BF values of greater than or equal to 25% in male participants and greater than or equal to 35% in female participants to define obesity, aligning with established cutoffs in the field (41–43).
Accordingly, men were classified as having either “normal adiposity” (NBF, %BF less than 25%) or “high adiposity” (HBF, %BF greater than or equal to 25%), while females were classified as NBF if their %BF was less than 35% or as HBF if %BF was greater than or equal to 35%. Clinical and demographic characteristics for these 4 subgroups are summarized in Supplemental Table 5. In unadjusted analyses, SAT HYP levels were similar between PWH and PWoH with HBF (Figure 1B). By contrast, SAT HYP levels were markedly higher in PWH than in PWoH when the comparison was confined to individuals with NBF (P < 0.0001; Figure 1C).
Multivariable linear regression analyses adjusting for sex, age, race, and %BF validated the unadjusted findings, with HIV status remaining independently associated with higher SAT HYP levels among individuals with NBF, but not those with HBF (Supplemental Figure 1, B and C; regression coefficients and adjusted values are provided in the Supporting Data Values file). Together, these findings indicate that elevated SAT fibrosis in PWH is not driven by excess adiposity and support instead the presence of excess, obesity-independent SAT fibrosis in this population that is prominent even in relatively lean individuals.
Differential relationships between SAT fibrosis, adiposity, and insulin resistance in PWH. To examine whether the increased SAT fibrosis in PWH might promote glycemic dysregulation, we evaluated relationships between SAT HYP content, adiposity, and IR using partial Spearman correlation analyses adjusted for age, sex, race, and prior exposure to legacy forms of ART. IR was assessed using HOMA-IR, a widely used clinical index of impaired insulin action (44, 45). Consistent with prior work from our group (24) and others (46, 47), increasing SAT fibrosis in PWoH correlated positively with increasing adiposity, as assessed by either BMI or %BF, and concomitantly with worsening IR (Figure 2A). In PWH, by contrast, the level of SAT fibrosis did not correlate with either BMI or %BF (Figure 2B), indicating that fibrotic SAT remodeling in this population is independent of overall adiposity. Moreover, neither BMI nor %BF were significantly associated with HOMA-IR in PWH. Remarkably, however, SAT fibrosis in PWH correlated positively with IR despite the lack of association between markers of adiposity and IR in this group, strongly suggesting that the positive correlation between SAT fibrosis and IR in PWH is independent of adiposity.
 Figure 2
Adjusted associations between adiposity, SAT fibrosis, and IR in PWoH and PWH. Heatmaps depict partial Spearman rank-order correlations among BMI, total %BF, SAT HYP content, and IR as assessed by HOMA-IR. Panel A shows correlations in PWoH; (n = 73), and Panel B shows the same correlations in PWH (n = 46). Correlations were calculated separately within each group and adjusted for age, sex, race, and exposure to legacy d-drugs. Only statistically significant partial Spearman correlation coefficients (ρ; P < 0.05) are displayed. HYP: Hydroxyproline
To further delineate how HIV status and adiposity modify the relationship between SAT fibrosis and IR, participants were again stratified into 4 groups (PWoH-NBF, PWoH-HBF, PWH-NBF, and PWH-HBF) using the same sex-specific %BF thresholds described above. Partial Spearman correlation analyses were then performed within each group, again adjusting for age, sex, race, and prior exposure to legacy d-drugs (Supplemental Figure 2). Among PWoH, SAT HYP levels correlated positively with both HOMA-IR and BMI in both the HBF group (ρ = 0.46 and ρ = 0.65, respectively; P < 0.01) and the NBF group (ρ = 0.44 and ρ = 0.65, respectively; P < 0.01). By contrast, SAT HYP levels in PWH were not correlated with BMI or %BF in either the NBF or HBF group. Notably, however, SAT HYP levels in PWH were strongly associated with HOMA-IR among PWH in the NBF group (ρ = 0.61, P < 0.05), whereas no further association between HIV and SAT HYP levels were noted in PWH who were also obese (PWH-HBF). Together, these findings indicate that, whereas SAT fibrosis in PWoH tracks both with increasing adiposity and with worsening IR across adiposity strata, consistent with established obesity-related mechanisms, SAT fibrosis in PWH is uncoupled from overall adiposity and is associated with IR even in individuals with a relatively low %BF, supporting an adiposity-independent relationship between SAT fibrosis and metabolic dysfunction in this population.
PWH have a distinct fibrosis-associated gene transcriptional pattern in the SAT. Given that SAT fibrosis correlated strongly with IR in PWH even in the absence of obesity or any correlation with increasing adiposity, we hypothesized that SAT fibrosis in PWH may be driven by molecular pathways that are distinct from those engaged in the setting of obesity-associated SAT fibrosis in PWoH. To test this, we profiled SAT samples using a NanoString targeted transcriptomic panel of 772 genes selected a priori for known roles in tissue fibrosis (Bruker Spatial Biology), allowing sensitive detection of coordinated, pathway-level transcriptional differences. Because this analysis was hypothesis-driven and restricted to a predefined gene set already associated with tissue fibrosis (48, 49), differential expression was assessed using stringent nominal P-value thresholds (P < 0.01) rather than genome-wide false discovery rate (FDR) correction, which is designed for unbiased, high-dimensional discovery screens. Applying FDR adjustment to a targeted panel of curated genes could be overly conservative, as the a priori biological constraint substantially reduces the effective multiple testing burden compared with unbiased transcriptomic screens. This approach is consistent with the manufacturer’s analytical recommendations and multiple prior studies employing targeted fibrosis panels (48, 50–54).
Of the 120 participants in the cohort, 75 participants who provided sufficient SAT for mRNA isolation were included in the analysis; their characteristics are summarized in Supplemental Table 6. Among the 772 fibrosis-related genes analyzed, a total of 43 genes were differentially expressed between PWH and PWoH at P < 0.01 after adjustment for age, sex, race, batch, %BF, and prior exposure to legacy d-drugs (Figure 3). Of these, 33 genes were transcriptionally upregulated and 10 were downregulated in PWH. Despite the limitations mentioned above, we also performed a complementary FDR-adjusted analysis (Benjamini-Hochberg) to further support the robustness of our findings and note that the overall pattern of differential gene expression was reassuringly preserved even after this secondary FDR correction (q < 0.05), with key fibrosis- and immune-related transcripts maintaining significance (Supplemental Figure 3).
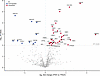 Figure 3
PWH have a distinct transcriptional pattern of fibrosis-associated gene expression in the SAT. Volcano plot of differential gene expression (DGE) in the SAT of PWH (n = 37) versus PWoH (n = 38) using the NanoString Human Fibrosis panel. The x axis shows log2 fold change, and the y axis shows −log10 P value. The dashed horizontal line denotes the nominal significance threshold (P < 0.01). No fold-change threshold was applied. Genes with P < 0.01 are highlighted (red, upregulated in PWH; blue, downregulated in PWH). DGE was assessed using NanoStringDiff with covariate-adjusted negative binomial generalized linear models.
Upregulated transcripts included those encoding key components of the ECM, including collagen type 14 α 1 chain (COL14A1), fibril-associated collagen; elastin (ELN) which encodes a component of elastic fibers; and laminin subunit γ 1 (LAMC1), which encodes the γ-1 subunit of the laminin family of ECM glycoproteins, as well as regulators of ECM remodeling, such as tissue inhibitors of matrix metalloproteinases (TIMP1 and TIMP2). The upregulation of COL14A1 mRNA levels in the SAT of PWH is particularly noteworthy, as it deviates from the transcriptionally dominant collagens found in the context of obesity-associated SAT fibrosis in PWoH, where types 1, 3, 4, and 6 predominate (27, 34, 46) and in whom collagen type 14 is not well described. This finding suggests that SAT fibrosis in PWH reflects an ECM transcriptional program that is qualitatively different from the canonical program driven by obesity.
In addition to ECM-related genes, several immune signaling transcripts were upregulated in the SAT of PWH in covariate-adjusted differential expression analyses, findings that support immune activation within AT. Given that human AT is identified as a reservoir for HIV, this pattern is consistent with chronic tissue inflammation in this compartment. These upregulated genes included those encoding proteins critical for pathogen recognition and antigen presentation such as CD14, a bacterial lipopolysaccharide (LPS) coreceptor expressed on myeloid cells that drives immune activation and inflammation (55), CD209, a C-type lectin receptor essential for pathogen binding with polymorphisms associated with HIV-1 susceptibility (56, 57), and CCL4 (macrophage inflammatory protein 1β), a CCR5 binding chemokine involved in immune cell recruitment and HIV pathogenesis (58, 59). The presence of these immune-related signatures in the SAT underscores that HIV infection is associated with persistent immunologic remodeling that extends beyond classical immune compartments into AT.
By contrast, genes that were transcriptionally downregulated in PWH compared with PWoH included those encoding proteins involved in lipid handling, such as cholesteryl ester transfer protein (CETP), fatty acid elongase 6 (ELOVL6), fatty acid binding protein 5 (FABP5), and patatin-like phospholipase domain-containing 3 (PNPLA3), which encodes a triacylglycerol (TG) lipase responsible for TG hydrolysis. This pattern of transcriptional downregulation suggests that the profibrotic and proinflammatory shifts in the SAT of PWH occur at the expense of its lipid metabolic functionality, critical for normal AT health.
The specific impact of HIV on SAT gene transcription is distinct from that of obesity. Since HIV and obesity have distinct effects on SAT HYP levels, we next sought to formally determine the extent to which the impact of HIV infection on fibrosis-related gene transcription in the SAT is also distinct from that of increasing adiposity in PWoH. We therefore once again stratified our transcriptional dataset into 4 categories: PWoH-NBF, PWoH-HBF, PWH-NBF, and PWH-HBF, mirroring the stratification used in earlier analyses of the relationship between SAT fibrosis and HOMA-IR. This stratification, with participant characteristics summarized in Supplemental Table 7, reduces biological heterogeneity introduced by pooling individuals with varying adiposity, improving the ability to detect context-dependent transcriptional changes. The PWoH-NBF group served as a reference group for each of 3 differential pairwise gene expression (DGE) analyses (Figure 4A and Supplemental Figure 4), the results of which are summarized in a Venn diagram (Figure 4B and Supplemental Table 8). The number of genes downregulated in PWoH-HBF, PWH-NBF, and PWH-HBF, respectively, when compared in a pairwise manner with PWoH-NBF participants is shown, with an analogous approach used to depict upregulated genes for the same pairwise comparisons (Figure 4B). Volcano plots for each pairwise comparison against the PWoH-NBF reference group are presented along with complementary FDR-adjustment in Supplemental Figure 5, with the overall DGE pattern being preserved even after secondary Benjamini-Hochberg correction.
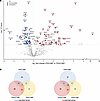 Figure 4
HIV and obesity are associated with distinct patterns of SAT gene transcription. (A) Volcano plot of DGE in the SAT of 16 PWH-NBF and 18 PWoH-NBF using the NanoString Human Fibrosis panel. The x axis shows log2 fold change, and the y axis shows −log10 P value. Genes meeting the nominal significance threshold (P < 0.01) are highlighted (red, upregulated compared with PWoH-NBF; blue, downregulated compared with PWoH-NBF). Volcano plots for the remaining pairwise comparisons are in Supplemental Figure 4. (B) Venn diagrams showing the number of genes downregulated (left) and upregulated (right) in pairwise comparisons between PWoH-NBF and PWoH-HBF, PWH-NBF, and PWH-HBF, respectively. Overlapping regions indicate genes shared across comparisons, highlighting distinct and convergent transcriptional patterns associated with HIV and increasing adiposity.
Reassuringly, our DGE analysis recapitulated transcriptional changes that are known to occur in the SAT of people responding to increased adiposity in the general population (51). For example, the comparison of PWoH-HBF versus PWoH-NBF (control) groups revealed several upregulated genes already reported to be induced by obesity, including those encoding inflammatory markers (CCL13, CCL19) and factors involved in ECM remodeling (LOX, LOXL1, LOXL4, TIMP2) (60, 61) (Supplemental Figure 4 and Table 2). Analysis of downregulated genes similarly confirmed well established findings in the literature (61–63), as mRNA levels of genes encoding adiponectin (ADIPOQ) and components of the insulin signaling cascade, including the insulin receptor (INSR), insulin receptor substrate 1 (IRS1), and phosphatidylinositol-4,5-bisphosphate 3-kinase catalytic subunit alpha (PIK3CA), were all downregulated in PWoH-HBF (Table 3). These confirmatory findings provide us with confidence in our cohort, tissue collection and processing methods, and analytical pipeline.
Identifying a fibrosis-related transcriptional signature unique to HIV infection and independent of adiposity. From these 3 sets of pairwise DGE analyses, we next focused on genes that were differentially regulated at the intersection of 2 or all 3 of the subgroups. Analyzing the DGEs found at these intersections (Figure 4B and Table 2) revealed mRNAs upregulated across each of the 3 DGE analyses we performed versus the reference PWoH-NBF group. Three genes (COL14A1, CSF1R, and CYP2C8) were upregulated in both the PWH-NBF and the PWH-HBF groups versus the PWoH-NBF reference group, indicative of genes that are transcriptionally induced in the SAT of PWH regardless of total body adiposity. By contrast, 3 other genes (CCL4, NCR1, and NLRP3) were transcriptionally upregulated in both the PWH-NBF and PWoH-HBF subgroups versus the reference group, indicative of genes involved both in the response of PWoH to obesity and also in the response of relatively leaner participants to HIV infection. This overlapping set of genes highlights the possibility that some transcriptional components of the SAT fibrosis seen in PWH-NBF reflect responses that are also induced by obesity in the general population. Furthermore, 16 genes were transcriptionally upregulated in the SAT of both PWoH-HBF and PWH-HBF participants compared with the reference group (PWoH-NBF), highlighting genes that are induced by obesity, regardless of HIV infection status.
Our parallel analysis of downregulated genes was also revealing (Figure 4B and Table 3). Specifically, 7 genes were transcriptionally downregulated in all 3 of the pairwise comparisons made versus the PWoH-NBF group. These notably include solute carrier family 2 member 4 (SLC2A4), which encodes GLUT4, the glucose transporter responsible for insulin-mediated glucose uptake by ATs, a function that is impaired in the context of IR. Three genes (FST, PNPLA3, and TNN) were transcriptionally downregulated in both PWH-NBF and PWH-HBF participants versus the PWoH-NBF reference group, reflecting transcriptional responses to HIV infection regardless of total body adiposity. Another 10 genes were downregulated in both PWH-HBF and PWoH-HBF groups, highlighting pathways repressed by obesity but independently of the presence or absence of chronic HIV infection. These genes include those encoding proteins associated with intracellular lipid handling (fatty acid binding protein 5; FABP5), fatty acid β-oxidation (hydroxyacyl-CoA dehydrogenase; HADH), mitochondrial membrane potential regulation (thioredoxin 2; TXN2), and mitochondrial respiratory electron transport (ubiquinol-cytochrome c reductase Rieske iron-sulfur polypeptide 1; UQCRFS1 and ubiquinol-cytochrome c reductase hinge protein; UQCRH) that are critical for normal AT metabolic function. In all, our granular subgroup analyses revealed fibrosis-related transcriptional responses in the SAT that are relatively specific to PWH as well as responses that are shared between obesity, regardless of HIV status, and chronically treated HIV infection.
Functional pathways corresponding to genes differentially expressed in the SAT were identified using Gene Set Enrichment Analysis (GSEA) with curated databases including the Kyoto Encyclopedia of Genes and Genomes (KEGG), Reactome, and Gene Ontology (GO) gene sets. KEGG and Reactome provide pathway-based maps describing molecular interactions and biological processes, while GO offers gene classifications based on molecular function, biological processes, and cellular components. This analysis enabled us to mechanistically distinguish important biological processes associated with excess SAT fibrosis in PWH-NBF from those operational in both PWH-HBF and PWoH-HBF, highlighting potential profibrotic transcriptional mechanisms in PWH that manifest independently of obesity. Figure 5 highlights select top-enriched pathways for each comparison; complete GSEA results, including all significantly enriched pathways and their contributing genes, are provided in the Supporting Data Values file.
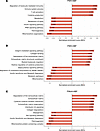 Figure 5
Pathway analysis reveals distinct and shared transcriptional programs across HIV and adiposity subgroups. Normalized enrichment scores (NES) from GSEA for select top significantly enriched pathways in (A) PWH-NBF versus PWoH-NBF, (B) PWH-HBF versus PWoH-NBF, and (C) PWoH-HBF versus PWoH-NBF. Positive NES indicates pathway upregulation, and negative NES indicates pathway downregulation relative to PWoH-NBF. FDR < 0.1. Complete GSEA results, including leading-edge genes, are provided in the Supporting Data Values file.
In PWH-NBF, pathways related to ECM remodeling, immune activation, and leukocyte migration were significantly upregulated, consistent with a profibrotic and inflammatory SAT phenotype (Figure 5A). Concurrently, there was significant downregulation of pathways related to insulin signaling, thermogenesis, and lipid metabolic processes. Together, these results suggest that SAT dysfunction in PWH-NBF is characterized by immune- and matrix-driven remodeling and impaired energy metabolism, even in the absence of obesity. In PWH-HBF, ECM, and immune-related pathways remained upregulated, overlapping with those upregulated in PWH-NBF, but with the additional enrichment of cytokine signaling, complement activation, and antigen presentation pathways, suggesting that adiposity may further amplify inflammation and immune dysregulation in the setting of HIV (Figure 5B). As expected, the SAT of PWoH-HBF also demonstrated upregulation of ECM pathways and downregulation of thermogenic and adipokine signaling, consistent with features of AT dysfunction that previous studies have established are present in obesity alone (Figure 5C). These findings support the concept that, while obesity independently contributes to fibrotic and metabolic remodeling, chronic, treated HIV introduces additional immune perturbations that distinguish the SAT environment of PWH from that of PWoH, underscoring the potential need for alternative metabolic risk assessment and therapeutic strategies that specifically target ECM remodeling and immune dysregulation in PWH.
Endotrophin is an adiposity-independent marker of SAT fibrosis in PWH. We next sought to determine if SAT fibrosis in PWH can be marked in a manner that does not require an invasive tissue biopsy. To this end, we focused on Endotrophin (ETP), a cleavage product of collagen 6A3 that promotes ECM remodeling, immune cell infiltration, and fibrotic signaling in the SAT, contributing to increased tissue stiffness and metabolic dysfunction (26, 64, 65). Beyond its role in AT remodeling, ETP has emerged as a systemic marker of fibroinflammatory burden and metabolic disease severity; circulating ETP levels are strongly associated with IR, progression of chronic kidney and cardiovascular disease, multimorbidity, and increased all-cause mortality across large longitudinal cohorts (66–69). Moreover, there is growing interest in targeting ETP and its downstream signaling pathways to restore metabolic health and glycemic control in metabolically unhealthy obesity (65, 66, 70). However, to our knowledge, ETP levels have not been previously assessed in PWH.
As a foundational step, we examined SAT gene expression from our NanoString dataset, comparing PWH with PWoH. We assessed expression of COL1A1, COL1A2, COL3A1, and COL6A3, all of which have been previously associated with AT fibrosis in human obesity. Although differences between groups were not statistically significant, we observed a consistent trend toward higher expression of all 4 genes in PWH (Supplemental Figure 6). These findings suggest that, beyond COL14A1, increased fibrotic remodeling in the SAT of PWH may involve multiple collagen genes and offers support for examining ETP as a potential circulating marker of tissue fibrosis in this population.
Interestingly, PWH had higher plasma ETP levels than PWoH in unadjusted analyses (Figure 6A; P = 0.0045), and this remained highly significant after multivariable linear regression adjustment for sex, age, race, and %BF (Supplemental Table 9 and Supplemental Figure 7A). Moreover, circulating ETP correlated positively with HOMA-IR in both PWH (Spearman ρ = 0.42, P = 0.006) and PWoH (ρ = 0.28, P = 0.019) even after adjusting for age, sex, race and ethnicity. Notably, neither %BF, sex, age, nor race were independently associated with circulating ETP levels in this model, indicating that the ETP elevation in PWH is not explained by differences in body composition or demographic factors. In a multivariable model restricted to PWH (Supplemental Table 10, Model 1), neither legacy d-drug exposure, current INSTI use, CD4+ T cell count, nor %BF was associated with plasma ETP levels. To evaluate robustness, we sequentially adjusted for additional demographic covariates: sex (Model 2), age (Model 3), and race (Model 4). Effect estimates for the primary covariates remained stable across all models, and no additional covariate reached statistical significance.
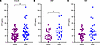 Figure 6
PWH have elevated plasma endotrophin levels, particularly among those with normal body fat. Plasma endotrophin (ETP) concentrations (ng/mL) were compared between persons without HIV (PWoH; purple) and persons with HIV (PWH; blue). (A) In the overall cohort (PWoH, n = 73; PWH, n = 46), plasma ETP levels were significantly higher in PWH than PWoH (P = 0.0045). (B) Among participants with normal body fat (NBF; PWoH, n = 31; PWH, n = 20), plasma ETP levels were significantly elevated in PWH compared with PWoH (P = 0.018). (C) Among participants with higher body fat (HBF; PWoH, n = 42; PWH, n = 26), the difference did not reach statistical significance (P = 0.10). Groups were compared using the Mann-Whitney U test. *P < 0.05, **P < 0.01.
We next again performed adiposity-stratified subgroup analyses. Among individuals with NBF, plasma ETP levels were significantly higher in PWH than PWoH in both unadjusted (P = 0.018; Figure 6B) and adjusted analyses (Supplemental Figure 7B), and %BF was not associated with plasma ETP in this subgroup (Supplemental Table 11). Among individuals with HBF, the difference between PWH and PWoH did not reach statistical significance in unadjusted (P = 0.10; Figure 6C) or adjusted analyses (Supplemental Figure 7C), although %BF was a significant independent predictor of circulating ETP levels in this subgroup (Supplemental Table 11). These analyses identify plasma ETP as a noninvasive marker of AT remodeling that is elevated in PWH independently of ART history and demographic factors. This elevation was significant among individuals with NBF, where %BF did not influence ETP levels, and trended in the same direction among those with HBF, where adiposity itself, rather than HIV status, was the dominant predictor of circulating ETP levels. As with tissue HYP, the HIV-associated elevation in ETP was most evident among individuals with relatively normal adiposity, reinforcing that the link between HIV and fibrotic remodeling goes beyond what can be attributed to excess body fat.


