
Research ArticleImmunologyNeuroscience
Open Access |  10.1172/jci.insight.197980
Microglial SWELL1 deficiency drives male-specific seizure vulnerability but paradoxical neuroprotection through impaired phagocytosis
Abhijeet S. Barath,1,2,3,4 Aastha Dheer,1 Laura Montier,3 Mekenzie M Peshoff,3,5 Emily Dale,1 Flavia Goche,1 Thanh Thanh Le Nguyen,6 Mastura Akter,3 FangFang Qi,1 Dimitrios Kleidonas,3 Lauren Harris,3 Sarah A. Jewanee,3 Rongzhuo Hua,3 Tejaswani Datla,3 Anthony D. Umpierre,1 Dale B. Bosco,1 Koichiro Haruwaka,3 Rajan Sah,7 and Long-Jun Wu1,3
1Department of Neurology, Mayo Clinic, Rochester, Minnesota, USA.
2Mayo Clinic Graduate School of Biomedical Sciences, Rochester, Minnesota, USA.
3Center for Neuroimmunology and Glial Biology, Institute of Molecular Medicine, University of Texas Health Science Center at Houston, Houston, Texas, USA.
4Department of Neurology, Yale New Haven Hospital, New Haven, Connecticut, USA.
5MD Anderson UTHealth Graduate School of Biomedical Sciences, Houston, Texas, USA.
6Department of Genetics, Yale School of Medicine, New Haven, Connecticut, USA.
7Department of Internal Medicine, Cardiovascular Division, Washington University School of Medicine, St. Louis, Missouri, USA.
Address correspondence to: Long-Jun Wu, Center for Neuroimmunology and Glial Biology, Institute of Molecular Medicine, University of Texas Health Science Center at Houston, 1825 Pressler Street, Houston, Texas 77030, USA. Phone: 713.500.3145; Email: longjun.wu@uth.tmc.edu.
Authorship note: ASB and AD contributed equally to this work and are co–first authors.
Find articles by Barath, A. in: PubMed | Google Scholar
1Department of Neurology, Mayo Clinic, Rochester, Minnesota, USA.
2Mayo Clinic Graduate School of Biomedical Sciences, Rochester, Minnesota, USA.
3Center for Neuroimmunology and Glial Biology, Institute of Molecular Medicine, University of Texas Health Science Center at Houston, Houston, Texas, USA.
4Department of Neurology, Yale New Haven Hospital, New Haven, Connecticut, USA.
5MD Anderson UTHealth Graduate School of Biomedical Sciences, Houston, Texas, USA.
6Department of Genetics, Yale School of Medicine, New Haven, Connecticut, USA.
7Department of Internal Medicine, Cardiovascular Division, Washington University School of Medicine, St. Louis, Missouri, USA.
Address correspondence to: Long-Jun Wu, Center for Neuroimmunology and Glial Biology, Institute of Molecular Medicine, University of Texas Health Science Center at Houston, 1825 Pressler Street, Houston, Texas 77030, USA. Phone: 713.500.3145; Email: longjun.wu@uth.tmc.edu.
Authorship note: ASB and AD contributed equally to this work and are co–first authors.
Find articles by Dheer, A. in: PubMed | Google Scholar
1Department of Neurology, Mayo Clinic, Rochester, Minnesota, USA.
2Mayo Clinic Graduate School of Biomedical Sciences, Rochester, Minnesota, USA.
3Center for Neuroimmunology and Glial Biology, Institute of Molecular Medicine, University of Texas Health Science Center at Houston, Houston, Texas, USA.
4Department of Neurology, Yale New Haven Hospital, New Haven, Connecticut, USA.
5MD Anderson UTHealth Graduate School of Biomedical Sciences, Houston, Texas, USA.
6Department of Genetics, Yale School of Medicine, New Haven, Connecticut, USA.
7Department of Internal Medicine, Cardiovascular Division, Washington University School of Medicine, St. Louis, Missouri, USA.
Address correspondence to: Long-Jun Wu, Center for Neuroimmunology and Glial Biology, Institute of Molecular Medicine, University of Texas Health Science Center at Houston, 1825 Pressler Street, Houston, Texas 77030, USA. Phone: 713.500.3145; Email: longjun.wu@uth.tmc.edu.
Authorship note: ASB and AD contributed equally to this work and are co–first authors.
Find articles by Montier, L. in: PubMed | Google Scholar
1Department of Neurology, Mayo Clinic, Rochester, Minnesota, USA.
2Mayo Clinic Graduate School of Biomedical Sciences, Rochester, Minnesota, USA.
3Center for Neuroimmunology and Glial Biology, Institute of Molecular Medicine, University of Texas Health Science Center at Houston, Houston, Texas, USA.
4Department of Neurology, Yale New Haven Hospital, New Haven, Connecticut, USA.
5MD Anderson UTHealth Graduate School of Biomedical Sciences, Houston, Texas, USA.
6Department of Genetics, Yale School of Medicine, New Haven, Connecticut, USA.
7Department of Internal Medicine, Cardiovascular Division, Washington University School of Medicine, St. Louis, Missouri, USA.
Address correspondence to: Long-Jun Wu, Center for Neuroimmunology and Glial Biology, Institute of Molecular Medicine, University of Texas Health Science Center at Houston, 1825 Pressler Street, Houston, Texas 77030, USA. Phone: 713.500.3145; Email: longjun.wu@uth.tmc.edu.
Authorship note: ASB and AD contributed equally to this work and are co–first authors.
Find articles by Peshoff, M. in: PubMed | Google Scholar
1Department of Neurology, Mayo Clinic, Rochester, Minnesota, USA.
2Mayo Clinic Graduate School of Biomedical Sciences, Rochester, Minnesota, USA.
3Center for Neuroimmunology and Glial Biology, Institute of Molecular Medicine, University of Texas Health Science Center at Houston, Houston, Texas, USA.
4Department of Neurology, Yale New Haven Hospital, New Haven, Connecticut, USA.
5MD Anderson UTHealth Graduate School of Biomedical Sciences, Houston, Texas, USA.
6Department of Genetics, Yale School of Medicine, New Haven, Connecticut, USA.
7Department of Internal Medicine, Cardiovascular Division, Washington University School of Medicine, St. Louis, Missouri, USA.
Address correspondence to: Long-Jun Wu, Center for Neuroimmunology and Glial Biology, Institute of Molecular Medicine, University of Texas Health Science Center at Houston, 1825 Pressler Street, Houston, Texas 77030, USA. Phone: 713.500.3145; Email: longjun.wu@uth.tmc.edu.
Authorship note: ASB and AD contributed equally to this work and are co–first authors.
Find articles by Dale, E. in: PubMed | Google Scholar
1Department of Neurology, Mayo Clinic, Rochester, Minnesota, USA.
2Mayo Clinic Graduate School of Biomedical Sciences, Rochester, Minnesota, USA.
3Center for Neuroimmunology and Glial Biology, Institute of Molecular Medicine, University of Texas Health Science Center at Houston, Houston, Texas, USA.
4Department of Neurology, Yale New Haven Hospital, New Haven, Connecticut, USA.
5MD Anderson UTHealth Graduate School of Biomedical Sciences, Houston, Texas, USA.
6Department of Genetics, Yale School of Medicine, New Haven, Connecticut, USA.
7Department of Internal Medicine, Cardiovascular Division, Washington University School of Medicine, St. Louis, Missouri, USA.
Address correspondence to: Long-Jun Wu, Center for Neuroimmunology and Glial Biology, Institute of Molecular Medicine, University of Texas Health Science Center at Houston, 1825 Pressler Street, Houston, Texas 77030, USA. Phone: 713.500.3145; Email: longjun.wu@uth.tmc.edu.
Authorship note: ASB and AD contributed equally to this work and are co–first authors.
Find articles by Goche, F. in: PubMed | Google Scholar
1Department of Neurology, Mayo Clinic, Rochester, Minnesota, USA.
2Mayo Clinic Graduate School of Biomedical Sciences, Rochester, Minnesota, USA.
3Center for Neuroimmunology and Glial Biology, Institute of Molecular Medicine, University of Texas Health Science Center at Houston, Houston, Texas, USA.
4Department of Neurology, Yale New Haven Hospital, New Haven, Connecticut, USA.
5MD Anderson UTHealth Graduate School of Biomedical Sciences, Houston, Texas, USA.
6Department of Genetics, Yale School of Medicine, New Haven, Connecticut, USA.
7Department of Internal Medicine, Cardiovascular Division, Washington University School of Medicine, St. Louis, Missouri, USA.
Address correspondence to: Long-Jun Wu, Center for Neuroimmunology and Glial Biology, Institute of Molecular Medicine, University of Texas Health Science Center at Houston, 1825 Pressler Street, Houston, Texas 77030, USA. Phone: 713.500.3145; Email: longjun.wu@uth.tmc.edu.
Authorship note: ASB and AD contributed equally to this work and are co–first authors.
Find articles by Nguyen, T. in: PubMed | Google Scholar
1Department of Neurology, Mayo Clinic, Rochester, Minnesota, USA.
2Mayo Clinic Graduate School of Biomedical Sciences, Rochester, Minnesota, USA.
3Center for Neuroimmunology and Glial Biology, Institute of Molecular Medicine, University of Texas Health Science Center at Houston, Houston, Texas, USA.
4Department of Neurology, Yale New Haven Hospital, New Haven, Connecticut, USA.
5MD Anderson UTHealth Graduate School of Biomedical Sciences, Houston, Texas, USA.
6Department of Genetics, Yale School of Medicine, New Haven, Connecticut, USA.
7Department of Internal Medicine, Cardiovascular Division, Washington University School of Medicine, St. Louis, Missouri, USA.
Address correspondence to: Long-Jun Wu, Center for Neuroimmunology and Glial Biology, Institute of Molecular Medicine, University of Texas Health Science Center at Houston, 1825 Pressler Street, Houston, Texas 77030, USA. Phone: 713.500.3145; Email: longjun.wu@uth.tmc.edu.
Authorship note: ASB and AD contributed equally to this work and are co–first authors.
Find articles by Akter, M. in: PubMed | Google Scholar
1Department of Neurology, Mayo Clinic, Rochester, Minnesota, USA.
2Mayo Clinic Graduate School of Biomedical Sciences, Rochester, Minnesota, USA.
3Center for Neuroimmunology and Glial Biology, Institute of Molecular Medicine, University of Texas Health Science Center at Houston, Houston, Texas, USA.
4Department of Neurology, Yale New Haven Hospital, New Haven, Connecticut, USA.
5MD Anderson UTHealth Graduate School of Biomedical Sciences, Houston, Texas, USA.
6Department of Genetics, Yale School of Medicine, New Haven, Connecticut, USA.
7Department of Internal Medicine, Cardiovascular Division, Washington University School of Medicine, St. Louis, Missouri, USA.
Address correspondence to: Long-Jun Wu, Center for Neuroimmunology and Glial Biology, Institute of Molecular Medicine, University of Texas Health Science Center at Houston, 1825 Pressler Street, Houston, Texas 77030, USA. Phone: 713.500.3145; Email: longjun.wu@uth.tmc.edu.
Authorship note: ASB and AD contributed equally to this work and are co–first authors.
Find articles by Qi, F. in: PubMed | Google Scholar
1Department of Neurology, Mayo Clinic, Rochester, Minnesota, USA.
2Mayo Clinic Graduate School of Biomedical Sciences, Rochester, Minnesota, USA.
3Center for Neuroimmunology and Glial Biology, Institute of Molecular Medicine, University of Texas Health Science Center at Houston, Houston, Texas, USA.
4Department of Neurology, Yale New Haven Hospital, New Haven, Connecticut, USA.
5MD Anderson UTHealth Graduate School of Biomedical Sciences, Houston, Texas, USA.
6Department of Genetics, Yale School of Medicine, New Haven, Connecticut, USA.
7Department of Internal Medicine, Cardiovascular Division, Washington University School of Medicine, St. Louis, Missouri, USA.
Address correspondence to: Long-Jun Wu, Center for Neuroimmunology and Glial Biology, Institute of Molecular Medicine, University of Texas Health Science Center at Houston, 1825 Pressler Street, Houston, Texas 77030, USA. Phone: 713.500.3145; Email: longjun.wu@uth.tmc.edu.
Authorship note: ASB and AD contributed equally to this work and are co–first authors.
Find articles by Kleidonas, D. in: PubMed | Google Scholar
1Department of Neurology, Mayo Clinic, Rochester, Minnesota, USA.
2Mayo Clinic Graduate School of Biomedical Sciences, Rochester, Minnesota, USA.
3Center for Neuroimmunology and Glial Biology, Institute of Molecular Medicine, University of Texas Health Science Center at Houston, Houston, Texas, USA.
4Department of Neurology, Yale New Haven Hospital, New Haven, Connecticut, USA.
5MD Anderson UTHealth Graduate School of Biomedical Sciences, Houston, Texas, USA.
6Department of Genetics, Yale School of Medicine, New Haven, Connecticut, USA.
7Department of Internal Medicine, Cardiovascular Division, Washington University School of Medicine, St. Louis, Missouri, USA.
Address correspondence to: Long-Jun Wu, Center for Neuroimmunology and Glial Biology, Institute of Molecular Medicine, University of Texas Health Science Center at Houston, 1825 Pressler Street, Houston, Texas 77030, USA. Phone: 713.500.3145; Email: longjun.wu@uth.tmc.edu.
Authorship note: ASB and AD contributed equally to this work and are co–first authors.
Find articles by Harris, L. in: PubMed | Google Scholar
1Department of Neurology, Mayo Clinic, Rochester, Minnesota, USA.
2Mayo Clinic Graduate School of Biomedical Sciences, Rochester, Minnesota, USA.
3Center for Neuroimmunology and Glial Biology, Institute of Molecular Medicine, University of Texas Health Science Center at Houston, Houston, Texas, USA.
4Department of Neurology, Yale New Haven Hospital, New Haven, Connecticut, USA.
5MD Anderson UTHealth Graduate School of Biomedical Sciences, Houston, Texas, USA.
6Department of Genetics, Yale School of Medicine, New Haven, Connecticut, USA.
7Department of Internal Medicine, Cardiovascular Division, Washington University School of Medicine, St. Louis, Missouri, USA.
Address correspondence to: Long-Jun Wu, Center for Neuroimmunology and Glial Biology, Institute of Molecular Medicine, University of Texas Health Science Center at Houston, 1825 Pressler Street, Houston, Texas 77030, USA. Phone: 713.500.3145; Email: longjun.wu@uth.tmc.edu.
Authorship note: ASB and AD contributed equally to this work and are co–first authors.
Find articles by Jewanee, S. in: PubMed | Google Scholar
1Department of Neurology, Mayo Clinic, Rochester, Minnesota, USA.
2Mayo Clinic Graduate School of Biomedical Sciences, Rochester, Minnesota, USA.
3Center for Neuroimmunology and Glial Biology, Institute of Molecular Medicine, University of Texas Health Science Center at Houston, Houston, Texas, USA.
4Department of Neurology, Yale New Haven Hospital, New Haven, Connecticut, USA.
5MD Anderson UTHealth Graduate School of Biomedical Sciences, Houston, Texas, USA.
6Department of Genetics, Yale School of Medicine, New Haven, Connecticut, USA.
7Department of Internal Medicine, Cardiovascular Division, Washington University School of Medicine, St. Louis, Missouri, USA.
Address correspondence to: Long-Jun Wu, Center for Neuroimmunology and Glial Biology, Institute of Molecular Medicine, University of Texas Health Science Center at Houston, 1825 Pressler Street, Houston, Texas 77030, USA. Phone: 713.500.3145; Email: longjun.wu@uth.tmc.edu.
Authorship note: ASB and AD contributed equally to this work and are co–first authors.
Find articles by Hua, R. in: PubMed | Google Scholar
1Department of Neurology, Mayo Clinic, Rochester, Minnesota, USA.
2Mayo Clinic Graduate School of Biomedical Sciences, Rochester, Minnesota, USA.
3Center for Neuroimmunology and Glial Biology, Institute of Molecular Medicine, University of Texas Health Science Center at Houston, Houston, Texas, USA.
4Department of Neurology, Yale New Haven Hospital, New Haven, Connecticut, USA.
5MD Anderson UTHealth Graduate School of Biomedical Sciences, Houston, Texas, USA.
6Department of Genetics, Yale School of Medicine, New Haven, Connecticut, USA.
7Department of Internal Medicine, Cardiovascular Division, Washington University School of Medicine, St. Louis, Missouri, USA.
Address correspondence to: Long-Jun Wu, Center for Neuroimmunology and Glial Biology, Institute of Molecular Medicine, University of Texas Health Science Center at Houston, 1825 Pressler Street, Houston, Texas 77030, USA. Phone: 713.500.3145; Email: longjun.wu@uth.tmc.edu.
Authorship note: ASB and AD contributed equally to this work and are co–first authors.
Find articles by Datla, T. in: PubMed | Google Scholar
1Department of Neurology, Mayo Clinic, Rochester, Minnesota, USA.
2Mayo Clinic Graduate School of Biomedical Sciences, Rochester, Minnesota, USA.
3Center for Neuroimmunology and Glial Biology, Institute of Molecular Medicine, University of Texas Health Science Center at Houston, Houston, Texas, USA.
4Department of Neurology, Yale New Haven Hospital, New Haven, Connecticut, USA.
5MD Anderson UTHealth Graduate School of Biomedical Sciences, Houston, Texas, USA.
6Department of Genetics, Yale School of Medicine, New Haven, Connecticut, USA.
7Department of Internal Medicine, Cardiovascular Division, Washington University School of Medicine, St. Louis, Missouri, USA.
Address correspondence to: Long-Jun Wu, Center for Neuroimmunology and Glial Biology, Institute of Molecular Medicine, University of Texas Health Science Center at Houston, 1825 Pressler Street, Houston, Texas 77030, USA. Phone: 713.500.3145; Email: longjun.wu@uth.tmc.edu.
Authorship note: ASB and AD contributed equally to this work and are co–first authors.
Find articles by Umpierre, A. in: PubMed | Google Scholar
1Department of Neurology, Mayo Clinic, Rochester, Minnesota, USA.
2Mayo Clinic Graduate School of Biomedical Sciences, Rochester, Minnesota, USA.
3Center for Neuroimmunology and Glial Biology, Institute of Molecular Medicine, University of Texas Health Science Center at Houston, Houston, Texas, USA.
4Department of Neurology, Yale New Haven Hospital, New Haven, Connecticut, USA.
5MD Anderson UTHealth Graduate School of Biomedical Sciences, Houston, Texas, USA.
6Department of Genetics, Yale School of Medicine, New Haven, Connecticut, USA.
7Department of Internal Medicine, Cardiovascular Division, Washington University School of Medicine, St. Louis, Missouri, USA.
Address correspondence to: Long-Jun Wu, Center for Neuroimmunology and Glial Biology, Institute of Molecular Medicine, University of Texas Health Science Center at Houston, 1825 Pressler Street, Houston, Texas 77030, USA. Phone: 713.500.3145; Email: longjun.wu@uth.tmc.edu.
Authorship note: ASB and AD contributed equally to this work and are co–first authors.
Find articles by Bosco, D. in: PubMed | Google Scholar
1Department of Neurology, Mayo Clinic, Rochester, Minnesota, USA.
2Mayo Clinic Graduate School of Biomedical Sciences, Rochester, Minnesota, USA.
3Center for Neuroimmunology and Glial Biology, Institute of Molecular Medicine, University of Texas Health Science Center at Houston, Houston, Texas, USA.
4Department of Neurology, Yale New Haven Hospital, New Haven, Connecticut, USA.
5MD Anderson UTHealth Graduate School of Biomedical Sciences, Houston, Texas, USA.
6Department of Genetics, Yale School of Medicine, New Haven, Connecticut, USA.
7Department of Internal Medicine, Cardiovascular Division, Washington University School of Medicine, St. Louis, Missouri, USA.
Address correspondence to: Long-Jun Wu, Center for Neuroimmunology and Glial Biology, Institute of Molecular Medicine, University of Texas Health Science Center at Houston, 1825 Pressler Street, Houston, Texas 77030, USA. Phone: 713.500.3145; Email: longjun.wu@uth.tmc.edu.
Authorship note: ASB and AD contributed equally to this work and are co–first authors.
Find articles by Haruwaka, K. in: PubMed | Google Scholar
1Department of Neurology, Mayo Clinic, Rochester, Minnesota, USA.
2Mayo Clinic Graduate School of Biomedical Sciences, Rochester, Minnesota, USA.
3Center for Neuroimmunology and Glial Biology, Institute of Molecular Medicine, University of Texas Health Science Center at Houston, Houston, Texas, USA.
4Department of Neurology, Yale New Haven Hospital, New Haven, Connecticut, USA.
5MD Anderson UTHealth Graduate School of Biomedical Sciences, Houston, Texas, USA.
6Department of Genetics, Yale School of Medicine, New Haven, Connecticut, USA.
7Department of Internal Medicine, Cardiovascular Division, Washington University School of Medicine, St. Louis, Missouri, USA.
Address correspondence to: Long-Jun Wu, Center for Neuroimmunology and Glial Biology, Institute of Molecular Medicine, University of Texas Health Science Center at Houston, 1825 Pressler Street, Houston, Texas 77030, USA. Phone: 713.500.3145; Email: longjun.wu@uth.tmc.edu.
Authorship note: ASB and AD contributed equally to this work and are co–first authors.
Find articles by
Sah, R.
in:
PubMed
|
Google Scholar
|

1Department of Neurology, Mayo Clinic, Rochester, Minnesota, USA.
2Mayo Clinic Graduate School of Biomedical Sciences, Rochester, Minnesota, USA.
3Center for Neuroimmunology and Glial Biology, Institute of Molecular Medicine, University of Texas Health Science Center at Houston, Houston, Texas, USA.
4Department of Neurology, Yale New Haven Hospital, New Haven, Connecticut, USA.
5MD Anderson UTHealth Graduate School of Biomedical Sciences, Houston, Texas, USA.
6Department of Genetics, Yale School of Medicine, New Haven, Connecticut, USA.
7Department of Internal Medicine, Cardiovascular Division, Washington University School of Medicine, St. Louis, Missouri, USA.
Address correspondence to: Long-Jun Wu, Center for Neuroimmunology and Glial Biology, Institute of Molecular Medicine, University of Texas Health Science Center at Houston, 1825 Pressler Street, Houston, Texas 77030, USA. Phone: 713.500.3145; Email: longjun.wu@uth.tmc.edu.
Authorship note: ASB and AD contributed equally to this work and are co–first authors.
Find articles by
Wu, L.
in:
PubMed
|
Google Scholar
|
Published June 22, 2026 - More info
JCI Insight. 2026;11(12):e197980. https://doi.org/10.1172/jci.insight.197980.
© 2026 Barath et al. This work is licensed under the Creative Commons Attribution 4.0 International License. To view a copy of this license, visit http://creativecommons.org/licenses/by/4.0/.
Received: August 6, 2025; Accepted: May 6, 2026


-
Results
Seizures downregulate microglial SWELL1 expression while microglia-specific SWELL1 deficiency leads to increased seizure severity. Microglia are known to regulate neuronal excitability during acute seizures and coordinate neuroimmune responses during the postictal period (1–3, 21). To explore the role of microglial VRAC in this context, we analyzed our previously published bulk RNA-seq data from CD11b+ cells isolated from WT mice before and 7 days after KA-induced seizures (11). This analysis revealed significant alterations in homeostatic and seizure-associated gene expression, as well as in all Lrrc8 family members expressed in microglia (Figure 1A). At baseline, Lrrc8a and Lrrc8d exhibited the highest expression levels among the VRAC subunits, with lower levels of Lrrc8b and Lrrc8c (Figure 1B). A similar subunit expression pattern was observed at the protein level in ex vivo and primary cultured microglia using publicly available proteomic data (Supplemental Figure 1C; supplemental material available online with this article; https://doi.org/10.1172/jci.insight.197980DS1) (32). Seven days after seizure induction, Lrrc8a, the obligate VRAC subunit, was significantly downregulated, and Lrrc8 subunits b-d were upregulated (Figure 1B), suggesting seizure-induced reconfiguration of VRAC subunit composition in microglia.
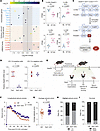 Figure 1
Bidirectional interplay between microglial VRAC expression and seizure severity. (A) A dot plot showing changes in microglial homeostatic, epilepsy-related, and Lrrc8 family genes at day 7 after kainate-induced seizure in WT mice (bulk sequencing of brain CD11b+ cells; n = 4–5 WT mice/group). (B) Lrrc8a-Lrrc8d expression in microglia at day 7 after seizures (statistic: q value [i.e., FDR-adjusted P value]). (C) Swell1 cKO mouse stop codons are placed around the E3 exon, which is spliced out after tamoxifen or 4-OHT treatment. tdTomato expression is also activated. (D) Relative Swell1 mRNA levels in CD11b+ and CD11b– cells showing cKO efficiency and selectivity (mRNA normalized to GAPDH) versus control animals treated with tamoxifen (statistic: Mann-Whitney U test and unpaired 2-tailed t test). (E) Seizure experiment timeline. (F) Longitudinal Racine seizure scores in SWELL1 cKO versus littermate controls (n = 25–35 mice/group; statistic: 2-way ANOVA). (G) Average seizure scores over the 2-hour observation period (statistic: unpaired 2-tailed t test). (H) Percentage of mice achieving a Racine score of 5 or higher at least once. (I) Survival rate. 4-OHT: 4-hydroxy tamoxifen (active metabolite of tamoxifen); FPKM, fragments per kilobase of exon per million mapped fragments; ICV, intracerebroventricular; KA, kainate; LM, vehicle-treated littermate controls; Tam, tamoxifen-treated controls. *P <0.05, **P <0.01, ***P or q <0.005, ****P or q <0.001
To investigate the functional consequences of this shift, we generated a tamoxifen-inducible, SWELL1 conditional KO (cKO) by crossing SWELL1(fl/fl) mice with CX3CR1(Cre-ER/Cre-ER) mice (Figure 1, C and E). This approach enabled selective deletion of SWELL1 in adult microglia. qPCR confirmed a robust and selective reduction in SWELL1 mRNA in CD11b+ brain cells after tamoxifen administration, achieving an average knockdown efficiency of 91% ± 8% (Figure 1D). Functional in vitro validation demonstrated impaired regulatory volume decrease in SWELL1-deficient microglia when exposed to a mild hypotonic challenge (osmolarity 200–215 mOsm/L; Supplemental Figure 1, A and B, and Supplemental Videos 1 and 2). SWELL1 cKO microglia displayed much slower kinetics of volume reduction and larger cell sizes than controls.
To assess the in vivo impact of microglial SWELL1 loss, we employed the intracerebroventricular KA (ICV-KA) model of temporal lobe epilepsy. This model produces a seizure for a few hours followed by a return to baseline. No spontaneous recurrent seizures are seen, unlike with intraperitoneal, intra-amygdala, and intrahippocampal administration of KA (11, 33). Interestingly, we found male SWELL1 cKO mice exhibited significantly increased seizure severity compared with vehicle-treated littermate controls, as assessed by the modified Racine scale (Figure 1, F and G). There were also nonsignificant trends toward higher rates of severe seizures (Racine score ≥ 5) and mortality in the cKO group (Figure 1, H and I). All mortality occurred within 2 hours of KA injection. These findings were replicated using tamoxifen-treated controls lacking either the Cre recombinase or floxed SWELL1 alleles (i.e., SWELL1(fl/fl) CX3CR1(WT/WT) and SWELL1(WT/WT) CX3CR1(Cre-ER/WT)), thereby ruling out off-target effects of tamoxifen (Supplemental Figure 1, D–G). Together, these results demonstrate that seizures alter microglial VRAC expression, and abrogating VRAC expression increases the severity of acute seizures in mice, suggesting a bidirectional relationship between seizure activity and microglial VRAC function.
Transient microglial loss and morphological remodeling in SWELL1 cKO mice. Previous studies have implicated VRAC/SWELL1 in cell proliferation and survival (29–31). Consistent with these roles, we observed an approximately 10%–20% reduction in microglial density in both the cortex and the cornu ammonis 3 (CA3) pyramidal layer of SWELL1 cKO mice at 4–6 weeks after tamoxifen induction (Figure 2, A–D, and Supplemental Figure 2, A and B). This reduction was accompanied by increased nearest neighbor distances (NNDs), indicative of altered microglial tiling, and a rightward shift in NND distribution curves (Supplemental Figure 2E). Importantly, microglial density returned to control levels by 10 weeks, confirming the transient nature of this reduction (Figure 2, A and C). These findings were further validated by Cre-ER–driven tdTomato expression (Supplemental Figure 2, C and D) and reduced ionized calcium-binding adapter molecule 1 (Iba1) immunoreactivity at 4–6 weeks (Figure 2E). At the time points associated with reduced microglial density, we also noted changes in microglial morphology. Specifically, microglial territory size was increased (Figure 2F), and Sholl analysis revealed complex alterations in arborization patterns (Figure 2G), suggesting structural remodeling in response to SWELL1 loss.
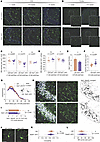 Figure 2
Transient microglial loss and morphological remodeling in SWELL1 cKO mice. (A) Microglia density in CA3 pyramidal layer of hippocampus at various time points after the last tamoxifen/vehicle administration (4–10 animals/group/time point examined). Scale bar: 50 μm. (B) Microglia density in cortex at various time points after the last tamoxifen/vehicle administration (8–10 animals/group/time point examined). Scale bar: 50 μm. (C) Quantification of microglia density in CA3 pyramidal layer (statistic: unpaired t test or Mann-Whitney U test). (D) Quantification of microglia density in cortex (statistic: unpaired 2-tailed t test). (E) Quantification of Iba1+ area in CA3 pyramidal layer (statistic: unpaired 2-tailed t test). (F) Quantification of microglia territory in CA3 pyramidal layer (dot, individual microglia; 10–40 microglia/mouse, 4–5 mice/group; statistic: nested 2-tailed t test). (G) Sholl analysis and representative thresholded images of microglia from SWELL1 cKO and LM control mice (10–40 microglia/mouse, 4–5 mice/group; statistic: 2-way ANOVA). (H) Microglia (Iba1)–neuron (NeuN) interaction in CA3 pyramidal layer at 2 hours after kainate-induced seizure (6 animals/group examined). Scale bar: 50 μm. (I) Iba1-NeuN double-positive volume as a percentage of CA3 pyramidal layer volume (statistic: unpaired 2-tailed t test). (J) Microglia soma changes at 2 hours after seizure induction (90–160 microglia/mouse, 5–6 mice/group examined). Scale bar: 20 μm. (K) Quantification of microglia soma circularity in CA3 (dot, individual microglia; 90–160 microglia/mouse, 5–6 mice/group; statistic: nested 2-tailed t test). (L) Quantification of microglia soma size in CA3 (dot, individual microglia; 90–160 microglia/mouse, 5–6 mice/group; statistic: nested 2-tailed t test). LM, vehicle-treated littermate control; PL, pyramidal layer; Tam, tamoxifen. *P <0.05, ****P <0.001.
Because these density and morphological changes coincided with the timing of our seizure behavioral experiments, we hypothesized that reduced microglial-neuronal contact might contribute to heightened seizure severity (Supplemental Figure 2F). To test this, we quantified microglia-neuron interactions 2 hours after seizure induction by calculating the percentage of CA3 voxels co-labeled with microglial markers (Iba1 or P2Y12) and the neuronal marker NeuN using high-resolution confocal microscopy (40× objective; voxel size 0.21 × 0.21 × 0.5 μm³). No significant differences were observed between SWELL1 cKO and control mice (Figure 2, H and I, and Supplemental Figure 2, G and H). However, morphometric analysis revealed larger microglial soma size and a trend toward reduced soma circularity in SWELL1 cKO mice (Figure 2, J–L), suggestive of altered activation states. Notably, soma sizes were reduced from baseline in both genotypes (Supplemental Figure 2, I and J). These morphological changes may be attributed to volume redistribution as microglia extend their processes and form bulbous endings or to a volume loss, raising the possibility that swelling-associated signaling mechanisms could contribute to the seizure phenotype in SWELL1-deficient mice.
SWELL1 deletion impairs microglial release of neuroactive metabolites. VRAC facilitates regulatory volume decrease through the efflux of a variety of organic and inorganic anions, several of which possess neuromodulatory properties (23, 24, 31, 34). Thus, we hypothesized that impaired release of inhibitory metabolites from seizure-activated SWELL1 cKO microglia could contribute to the increased seizure severity observed in this genotype (Supplemental Figure 3C). To test this, we used a mild hypotonic stimulus to activate VRAC in cultured microglia and measured the release of 14 neuroactive metabolites (via liquid chromatography/mass spectrometry [LC/MS]; Figure 3A) and ATP (via colorimetric assay; Supplemental Table 1). Eight metabolites, along with ATP, were reliably detected. Among these metabolites, the release of taurine, GABA, and glutamate was significantly reduced (~50%) in SWELL1 cKO microglia under hypotonic conditions (Figure 3, B–D), whereas the release of aspartate, adenosine, and ATP remained unaffected (Figure 3, D–G).
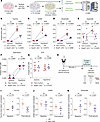 Figure 3
SWELL1 deletion impairs microglial release of neuroactive metabolites. (A) Experimental design for activation of SWELL1 (VRAC channel) in purified microglia cultures with a hypotonic stimulus and collection of supernatant for neuromodulator analysis. (B–G) Quantification of taurine, GABA, glutamate, aspartate, adenosine, and ATP levels in supernatant of SWELL1 cKO versus control microglia maintained in isotonic and hypotonic conditions (dot, 1 well; 4–5 wells/genotype; 50,000 microglia/well; statistic: 2-way ANOVA with Bonferroni’s multiple-comparison test). (H) Experimental design to test differences in CSF and plasma metabolites after seizure induction. (I–K) Batch-normalized taurine, GABA, and glutamate levels (statistic: permutation test). LC/MS, liquid chromatography/mass spectrometry; VRAC, volume regulated anion channel. *P <0.05, **P <0.01, ***P <0.005, ****P <0.001.
To determine whether these effects are reflected in vivo, we analyzed cerebrospinal fluid (CSF) samples collected from mice at baseline and 1 hour after KA-induced seizures (Figure 3H). Data were batch-normalized to minimize technical variability. At baseline, CSF levels of taurine, GABA, and glutamate were comparable between genotypes. However, after seizures, SWELL1 cKO mice exhibited significantly lower levels of taurine and glutamate compared with littermate controls (Figure 3, I–K), whereas postseizure GABA levels did not differ significantly (Figure 3J). In both genotypes, postseizure CSF levels of glutamate, GABA, and aspartate were strongly correlated (Supplemental Figure 3, D and E). Notably, taurine levels were highly correlated with these metabolites only in littermate controls, suggesting disrupted taurine regulation in SWELL1 cKO mice. Raw values for all CSF and plasma metabolite measurements are provided in Supplemental Tables 2–5.
SWELL1 deletion confers paradoxical neuroprotection after seizures. We next assessed the impact of SWELL1 cKO on seizure-induced neuronal loss. Using Nissl staining, we unexpectedly found that SWELL1 cKO mice exhibited significantly reduced neuronal loss in the CA3 region of the hippocampus compared with littermate controls, as assessed 3 days after KA-induced seizures (Figure 4, A and C). This neuroprotection was confirmed with NeuN staining (Figure 4, B and D). Importantly, baseline neuronal density did not differ between genotypes (Supplemental Figure 4, A–D). These findings were paradoxical, as SWELL1 cKO mice experienced more severe seizures.
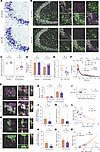 Figure 4
SWELL1 deletion confers paradoxical neuroprotection after seizures due to reduced lysosomal biogenesis. (A) Nissl staining showing neuronal loss in CA3 pyramidal layer at day 3 after seizure (arrowheads, pyknotic nuclei; 4–11 animals/group examined). Scale bar: 50 μm. (B) Immunofluorescence images showing neuronal loss and myeloid and CD68 responses in CA3 at day 3 after seizure (10–11 animals/group examined). Scale bar: 50 μm. (C) Quantification of Nissl-positive cell bodies at baseline and day 3 after seizure (statistic: unpaired t test). (D) Quantification of relative NeuN-positive area in CA3 at baseline and day 3 after seizure (statistic: unpaired 2-tailed t test). (E) Quantification of myeloid cell density in CA3 pyramidal layer at day 3 after seizure (statistic: unpaired 2-tailed t test). (F) Distribution and average of nearest neighbor distances for myeloid cells in CA3 pyramidal layer (statistic: Mann-Whitney U test and 2-way ANOVA). (G) 3D reconstructed and orthogonal views of NeuN-CD68 volumetric interactions in CA3 pyramidal layer (zoomed-in view of regions of interest [ROIs] shown B). Scale bar: 10 μm. (H) Quantification of CD68+ area in CA3 at baseline and day 3 after seizures (statistic: unpaired t test). (I) Quantification of mean CD68 granule sizes at day 3 after seizures. (J and K) Quantification of NeuN-CD68 double-positive voxels in CA3 pyramidal layer (statistic: Mann-Whitney U test). (L) Correlation between CD68+ and NeuN+ area in CA3 pyramidal layer at day 3 after seizure (statistic: Pearson’s correlation coefficient). (M) 3D reconstructed and orthogonal views of Iba1-CD68 volumetric interactions in CA3 pyramidal layer (zoomed-in view of ROIs shown in B). Scale bar: 10 μm. (N and O) Quantification of Iba1-CD68 double-positive voxels in CA3 pyramidal layer (statistic: unpaired 2-tailed t test). (P) Correlation between Iba1+ and CD68+ area in CA3 pyramidal layer at day 3 after seizure (statistic: Pearson’s correlation coefficient, r; simple linear regression to compare the slopes). *P <0.05, **P <0.01.
Given that seizure-induced neurodegeneration is closely linked to microglial phagocytosis, we next examined the microglial and lysosomal responses. We found that Iba1+ cells aggregated in the CA3 region in both groups; however, SWELL1 cKO mice showed significantly lower microglial cell density and Iba1 immunoreactivity (Figure 4, B and E, and Supplemental Figure 4, F and G). In line with lower cell density, NNDs were significantly increased in SWELL1 cKO mice, with a rightward shift in the distribution (Figure 4F), indicating more distant microglial tiling. Ki-67 staining was performed to assess whether differential proliferation contributed to less intense microgliosis in SWELL1 cKO animals, revealing no differences between genotypes (Supplemental Figure 4, N and O).
We next examined the lysosome marker CD68 in microglia. We found that SWELL1 cKO mice exhibited a blunted lysosomal response, as evidenced by significantly lower CD68 staining intensity and smaller, less numerous CD68+ granules in the CA3 region (Figure 4, B and G–I, and Supplemental Figure 4H). Notably, the NeuN+ area in the CA3 pyramidal layer showed a strong inverse correlation with CD68 intensity in littermate controls (Figure 4L), consistent with increased neuronal loss being associated with heightened microglial phagolysosomal activity. A moderate, nonsignificant negative correlation was observed in SWELL1 cKO mice, suggesting a disrupted link between neuronal loss and lysosomal engagement. To further investigate phagolysosomal function, we quantified the volume of double-positive NeuN+ CD68+ voxels — representing neuronal material in contact with or internalized by lysosomes — using high-resolution confocal imaging (20× magnification; voxel size 0.43 × 0.43 × 1 μm³; Figure 4G). SWELL1 cKO mice displayed a significantly smaller volume of NeuN+ CD68+ voxels compared with controls (Figure 4, J and K), supporting reduced neuronal clearance as the basis for the observed neuroprotection.
Given that CD68 expression is closely tied to microglial activation and proliferation, we examined whether reduced CD68 staining in SWELL1 cKO mice could be explained by fewer microglia. We quantified the volume of Iba1+ CD68+ voxels as a proportion of total Iba1+ volume. Both the absolute and relative volume of these double-positive voxels were significantly reduced in SWELL1 cKO mice (Figure 4, M–O). Moreover, CD68+ and Iba1+ areas were positively correlated in both genotypes, but the slope of this relationship was significantly lower in SWELL1 cKO mice (Figure 4P), indicating an impairment in the efficiency of lysosomal biogenesis. The data in Figure 4, L and P, represent averages pooled from 3–5 CA3 sections per animal. Notably, substantial variability in Iba1 and CD68 responses was observed between sections from the same animal, suggesting regional heterogeneity in microglial activation. To account for this, we conducted a secondary analysis treating individual sections as biological replicates. This approach confirmed the strong correlations between CD68+ and NeuN+ areas (Supplemental Figure 4I) and between Iba1+ and CD68+ areas (Supplemental Figure 4J), including the reduced slope in SWELL1 cKO mice, thus reinforcing our conclusions regarding the reduced efficiency of lysosomal synthesis in the latter. We also examined differences in inflammatory response between genotypes and found higher levels of IL-1β in SWELL1 cKO animals compared with controls (Supplemental Figure 4 K–M).
Cell-autonomous differences in number and phagocytic deficits in SWELL1 cKO microglia. To determine whether the differences in cell number and phagocytic impairments observed in SWELL1 cKO mice were cell-autonomous, we performed in vitro experiments using primary cultured microglia. When plated at equal density, SWELL1 cKO microglia exhibited approximately 25% lower cell numbers than tamoxifen-treated controls by day 10 in culture (Figure 5, A and B), indicating a defect in proliferation or survival. Because phagocytosis can be influenced by cell density, we performed the phagocytosis assay at a time point prior to the emergence of significant density differences (Supplemental Figure 5A). GFP+ latex beads opsonized with FBS IgG were used as the phagocytic substrate (Figure 5C). Microglia were activated during the assay due to incubation in serum-free medium, which reduces Fcγ receptor saturation (normally caused by serum IgG), thereby enhancing sensitivity to IgG-opsonized beads (Figure 5D). We found that SWELL1 cKO microglia displayed significantly impaired phagocytic kinetics compared with tamoxifen-treated controls, as measured by both the proportion of microglia containing bead inclusions and the average phagocytic load per cell (Figure 5, D–F). These findings were independently confirmed using vehicle-treated, genotype-matched controls (Supplemental Figure 5, B–D). To strengthen the physiological relevance of these findings, we repeated the above assay using apoptotic neuroblastoma cells as phagocytic substrate, reconfirming reduced phagocytosis in SWELL1 cKO microglia (Supplemental Figure 5, E and F). Together, these results demonstrate that the proliferative and phagocytic defects in SWELL1-deficient microglia are intrinsic and cell autonomous.
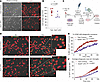 Figure 5
Cell-autonomous proliferative and phagocytic deficits in cultured SWELL1 cKO microglia. (A) Microglia density at 10 days in vitro after plating purified microglia at equal density (4–6 wells/genotype examined in a single experiment). Scale bar: 100 μm. (B) Quantification of microglia density at 12 days in vitro (statistic: unpaired 2-tailed t test). (C) Experimental design for in vitro phagocytosis assay with opsonized latex beads. (D) Bead phagocytosis assay (4 wells/genotype examined in a single experiment). Scale bar: 100 μm. (E) Quantification of percentage of microglia that were positive for phagocytic inclusions over a 2-hour observation window (n = 4 wells/genotype; statistic: 2-way ANOVA). (F) Quantification of average phagocytic load per microglia expressed as GFP+ area (n = 4 wells/genotype; results averaged per well; statistic: 2-way ANOVA). ****P <0.001.
Female SWELL1 cKO mice exhibit neuroprotection without increased seizure severity. Sex differences in microglial function have been reported in the contexts of neuropathic pain, phagocytosis, and P2Y12-dependent behaviors (31, 35–37). Therefore, we examined its role in SWELL1-dependent effects. Interestingly, unlike male SWELL1 cKO mice, females showed no differences in seizure severity or mortality compared with littermate controls (Figure 6, A and B, and Supplemental Figure 6, A and B). Although this trend was noted during early experiments, all female data were analyzed separately to systematically highlight similarities and sex-specific differences.
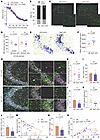 Figure 6
Female SWELL1 cKO mice exhibit neuroprotection without increased seizure severity. (A) Longitudinal Racine seizure scores in SWELL1 cKO versus littermate (LM) controls. (n = 15–24 mice/group; statistic: 2-way ANOVA). (B) Survival rate. (C) Microglia density in cortex at 4–6 weeks after the last tamoxifen/vehicle administration (6–8 animals/group examined). Scale bar: 50 μm. (D) Quantification of microglia density in cortex and CA3 (statistic: unpaired t test and Mann-Whitney U test, respectively). (E) Nissl staining showing neuronal loss in CA3 pyramidal layer at day 3 after seizure (7–8 animals/group examined). Scale bar: 50 μm. (F) Quantification of Nissl-positive cell bodies at day 3 after seizure (statistic: unpaired t test). (G) Immunofluorescence images showing neuronal loss and myeloid and CD68 responses in CA3 at day 3 after seizure (8–9 animals/group examined). Scale bar: 50 μm. (H and I) Quantification of myeloid cell density and Iba1+ area in CA3 pyramidal layer at day 3 after seizure (statistic: unpaired t tests). (J and K) Quantification of CD68+ area and mean granule size in CA3 at day 3 after seizures (statistic: unpaired t tests). (L) Quantification of NeuN-CD68 double-positive voxels in CA3 pyramidal layer (statistic: unpaired t test). (M) Correlation between CD68+ and NeuN+ area in CA3 pyramidal layer at day 3 after seizure (statistic: Pearson’s correlation coefficient). (N) Quantification of Iba1-CD68 double-positive voxels in CA3 pyramidal layer as a percentage of Iba1+ volume (statistic: unpaired 2-tailed t test). (O) Correlation between Iba1+ and CD68+ area in CA3 pyramidal layer at day 3 after seizure (statistic: Pearson’s correlation coefficient; simple linear regression to compare the slopes). *P < 0.05.
At 4–6 weeks after tamoxifen administration, SWELL1 cKO females displayed a significant reduction in microglial density in the cortex and a nonsignificant decrease in the CA3 pyramidal layer (Figure 6, C and D, and Supplemental Figure 6C), mirroring the pattern seen in males. Furthermore, like males, female SWELL1 cKO mice exhibited reduced neuronal loss in CA3 3 days after KA-induced seizures (Figure 6, E and F). However, unlike males, female SWELL1 cKO mice did not show significant differences in the overall microglial response, as measured by Iba1+ area and cell density (Figure 6, G–I). Despite this, CD68 expression remained reduced in the CA3 region, with significantly lower CD68+ area and a nonsignificant reduction in CD68+ granule size (Figure 6, G, J, and K). These results indicate that lysosomal activation, rather than general microglial recruitment, may underlie the neuroprotective phenotype in females. Consistent with this interpretation, SWELL1 cKO females showed reduced lysosome-neuron interaction, as evidenced by a lower volume of NeuN+CD68+ voxels and a moderate (versus strong) negative correlation between NeuN+ and CD68+ areas (Figure 6, G, L, and M). Additionally, lysosomal synthesis efficiency appeared impaired, as shown by a reduced proportion of Iba1+CD68+ voxels normalized to total Iba1 volume and a significantly flatter slope in the Iba1-CD68 correlation (Figure 6, G, N, and O). These findings suggest that, as in males, impaired phagolysosomal processing may contribute to neuroprotection in female SWELL1 cKO mice.
To further explore sex-specific effects, we conducted a post hoc analysis comparing neuropathology responses across sexes and genotypes. No significant sex differences were observed in Iba1+ or CD68+ area in CA3 for either genotype (Supplemental Figure 6, D–F). However, females exhibited less neuronal loss than males, with statistically significant protection in SWELL1 cKO mice and a nonsignificant trend in littermate controls. Additionally, female littermate controls had a higher proportion of CD68+ Iba1+ voxels (normalized to Iba1+ volume) compared with males, despite similar slopes in the CD68-Iba1 correlation (Supplemental Figure 6, G–L). This difference was attributed to a higher intercept, suggesting that at any given level of microglial activation, females produce more lysosomal content. Biologically, this implies that although the rate of CD68 upregulation per unit Iba1 is similar across sexes, female microglia may exhibit a higher baseline lysosomal load.


