
Research ArticleImmunologyOncology
Open Access |  10.1172/jci.insight.198701
PD-1–targeted IL-15 mutein activates CD8+ and CD4+ T cells in infection and cancer
Isaraphorn Pratumchai,1 Marie Bernardo,2 Julien Tessier,2 Jaroslav Zak,1 Kristi L. Marquardt,1 Joon Sang Lee,2 Maheeka Bimal,1 AHyun Choi,2 Anthony M. Byers,3 Mikielia G. Devonish,3 Roberto Carrio,3 Dan Lu,4 Stella Martomo,4 Jeegar Patel,4 Yu-an Zhang,2 Ingeborg M. Langohr,2 Virna Cortez-Retamozo,2 Dinesh S. Bangari,2 Angela Hadjipanayis,2 Xiangming Li,2 Valeria R. Fantin,2 Donald R. Shaffer,2 and John R. Teijaro1
1The Scripps Research Institute, Department of Immunology and Microbiology, La Jolla, California, USA.
2Sanofi, Cambridge, Massachusetts, USA.
3Sanofi Vaccines, Orlando, Florida, USA.
4Kadmon Corporation, A Sanofi Company, New York, New York, USA.
Address correspondence to: Donald R. Shaffer, 350 Water St. Cambridge, Massachusetts 02141, Phone: 617.947.2365; Email: Donald.Shaffer@sanofi.com. Or to: John R. Teijaro, 10550 North Torrey Pines Rd. La Jolla, California 92037, USA. Phone: 858.784.7397; Email: teijaro@scripps.edu.
Authorship note: IP, MB, and JT are co–first authors. DRS and JRT are co–senior authors.
Find articles by Pratumchai, I. in: PubMed | Google Scholar
1The Scripps Research Institute, Department of Immunology and Microbiology, La Jolla, California, USA.
2Sanofi, Cambridge, Massachusetts, USA.
3Sanofi Vaccines, Orlando, Florida, USA.
4Kadmon Corporation, A Sanofi Company, New York, New York, USA.
Address correspondence to: Donald R. Shaffer, 350 Water St. Cambridge, Massachusetts 02141, Phone: 617.947.2365; Email: Donald.Shaffer@sanofi.com. Or to: John R. Teijaro, 10550 North Torrey Pines Rd. La Jolla, California 92037, USA. Phone: 858.784.7397; Email: teijaro@scripps.edu.
Authorship note: IP, MB, and JT are co–first authors. DRS and JRT are co–senior authors.
Find articles by Bernardo, M. in: PubMed | Google Scholar
1The Scripps Research Institute, Department of Immunology and Microbiology, La Jolla, California, USA.
2Sanofi, Cambridge, Massachusetts, USA.
3Sanofi Vaccines, Orlando, Florida, USA.
4Kadmon Corporation, A Sanofi Company, New York, New York, USA.
Address correspondence to: Donald R. Shaffer, 350 Water St. Cambridge, Massachusetts 02141, Phone: 617.947.2365; Email: Donald.Shaffer@sanofi.com. Or to: John R. Teijaro, 10550 North Torrey Pines Rd. La Jolla, California 92037, USA. Phone: 858.784.7397; Email: teijaro@scripps.edu.
Authorship note: IP, MB, and JT are co–first authors. DRS and JRT are co–senior authors.
Find articles by Tessier, J. in: PubMed | Google Scholar
1The Scripps Research Institute, Department of Immunology and Microbiology, La Jolla, California, USA.
2Sanofi, Cambridge, Massachusetts, USA.
3Sanofi Vaccines, Orlando, Florida, USA.
4Kadmon Corporation, A Sanofi Company, New York, New York, USA.
Address correspondence to: Donald R. Shaffer, 350 Water St. Cambridge, Massachusetts 02141, Phone: 617.947.2365; Email: Donald.Shaffer@sanofi.com. Or to: John R. Teijaro, 10550 North Torrey Pines Rd. La Jolla, California 92037, USA. Phone: 858.784.7397; Email: teijaro@scripps.edu.
Authorship note: IP, MB, and JT are co–first authors. DRS and JRT are co–senior authors.
Find articles by
Zak, J.
in:
PubMed
|
Google Scholar
|

1The Scripps Research Institute, Department of Immunology and Microbiology, La Jolla, California, USA.
2Sanofi, Cambridge, Massachusetts, USA.
3Sanofi Vaccines, Orlando, Florida, USA.
4Kadmon Corporation, A Sanofi Company, New York, New York, USA.
Address correspondence to: Donald R. Shaffer, 350 Water St. Cambridge, Massachusetts 02141, Phone: 617.947.2365; Email: Donald.Shaffer@sanofi.com. Or to: John R. Teijaro, 10550 North Torrey Pines Rd. La Jolla, California 92037, USA. Phone: 858.784.7397; Email: teijaro@scripps.edu.
Authorship note: IP, MB, and JT are co–first authors. DRS and JRT are co–senior authors.
Find articles by Marquardt, K. in: PubMed | Google Scholar
1The Scripps Research Institute, Department of Immunology and Microbiology, La Jolla, California, USA.
2Sanofi, Cambridge, Massachusetts, USA.
3Sanofi Vaccines, Orlando, Florida, USA.
4Kadmon Corporation, A Sanofi Company, New York, New York, USA.
Address correspondence to: Donald R. Shaffer, 350 Water St. Cambridge, Massachusetts 02141, Phone: 617.947.2365; Email: Donald.Shaffer@sanofi.com. Or to: John R. Teijaro, 10550 North Torrey Pines Rd. La Jolla, California 92037, USA. Phone: 858.784.7397; Email: teijaro@scripps.edu.
Authorship note: IP, MB, and JT are co–first authors. DRS and JRT are co–senior authors.
Find articles by Lee, J. in: PubMed | Google Scholar
1The Scripps Research Institute, Department of Immunology and Microbiology, La Jolla, California, USA.
2Sanofi, Cambridge, Massachusetts, USA.
3Sanofi Vaccines, Orlando, Florida, USA.
4Kadmon Corporation, A Sanofi Company, New York, New York, USA.
Address correspondence to: Donald R. Shaffer, 350 Water St. Cambridge, Massachusetts 02141, Phone: 617.947.2365; Email: Donald.Shaffer@sanofi.com. Or to: John R. Teijaro, 10550 North Torrey Pines Rd. La Jolla, California 92037, USA. Phone: 858.784.7397; Email: teijaro@scripps.edu.
Authorship note: IP, MB, and JT are co–first authors. DRS and JRT are co–senior authors.
Find articles by Bimal, M. in: PubMed | Google Scholar
1The Scripps Research Institute, Department of Immunology and Microbiology, La Jolla, California, USA.
2Sanofi, Cambridge, Massachusetts, USA.
3Sanofi Vaccines, Orlando, Florida, USA.
4Kadmon Corporation, A Sanofi Company, New York, New York, USA.
Address correspondence to: Donald R. Shaffer, 350 Water St. Cambridge, Massachusetts 02141, Phone: 617.947.2365; Email: Donald.Shaffer@sanofi.com. Or to: John R. Teijaro, 10550 North Torrey Pines Rd. La Jolla, California 92037, USA. Phone: 858.784.7397; Email: teijaro@scripps.edu.
Authorship note: IP, MB, and JT are co–first authors. DRS and JRT are co–senior authors.
Find articles by Choi, A. in: PubMed | Google Scholar
1The Scripps Research Institute, Department of Immunology and Microbiology, La Jolla, California, USA.
2Sanofi, Cambridge, Massachusetts, USA.
3Sanofi Vaccines, Orlando, Florida, USA.
4Kadmon Corporation, A Sanofi Company, New York, New York, USA.
Address correspondence to: Donald R. Shaffer, 350 Water St. Cambridge, Massachusetts 02141, Phone: 617.947.2365; Email: Donald.Shaffer@sanofi.com. Or to: John R. Teijaro, 10550 North Torrey Pines Rd. La Jolla, California 92037, USA. Phone: 858.784.7397; Email: teijaro@scripps.edu.
Authorship note: IP, MB, and JT are co–first authors. DRS and JRT are co–senior authors.
Find articles by Byers, A. in: PubMed | Google Scholar
1The Scripps Research Institute, Department of Immunology and Microbiology, La Jolla, California, USA.
2Sanofi, Cambridge, Massachusetts, USA.
3Sanofi Vaccines, Orlando, Florida, USA.
4Kadmon Corporation, A Sanofi Company, New York, New York, USA.
Address correspondence to: Donald R. Shaffer, 350 Water St. Cambridge, Massachusetts 02141, Phone: 617.947.2365; Email: Donald.Shaffer@sanofi.com. Or to: John R. Teijaro, 10550 North Torrey Pines Rd. La Jolla, California 92037, USA. Phone: 858.784.7397; Email: teijaro@scripps.edu.
Authorship note: IP, MB, and JT are co–first authors. DRS and JRT are co–senior authors.
Find articles by Devonish, M. in: PubMed | Google Scholar
1The Scripps Research Institute, Department of Immunology and Microbiology, La Jolla, California, USA.
2Sanofi, Cambridge, Massachusetts, USA.
3Sanofi Vaccines, Orlando, Florida, USA.
4Kadmon Corporation, A Sanofi Company, New York, New York, USA.
Address correspondence to: Donald R. Shaffer, 350 Water St. Cambridge, Massachusetts 02141, Phone: 617.947.2365; Email: Donald.Shaffer@sanofi.com. Or to: John R. Teijaro, 10550 North Torrey Pines Rd. La Jolla, California 92037, USA. Phone: 858.784.7397; Email: teijaro@scripps.edu.
Authorship note: IP, MB, and JT are co–first authors. DRS and JRT are co–senior authors.
Find articles by Carrio, R. in: PubMed | Google Scholar
1The Scripps Research Institute, Department of Immunology and Microbiology, La Jolla, California, USA.
2Sanofi, Cambridge, Massachusetts, USA.
3Sanofi Vaccines, Orlando, Florida, USA.
4Kadmon Corporation, A Sanofi Company, New York, New York, USA.
Address correspondence to: Donald R. Shaffer, 350 Water St. Cambridge, Massachusetts 02141, Phone: 617.947.2365; Email: Donald.Shaffer@sanofi.com. Or to: John R. Teijaro, 10550 North Torrey Pines Rd. La Jolla, California 92037, USA. Phone: 858.784.7397; Email: teijaro@scripps.edu.
Authorship note: IP, MB, and JT are co–first authors. DRS and JRT are co–senior authors.
Find articles by Lu, D. in: PubMed | Google Scholar
1The Scripps Research Institute, Department of Immunology and Microbiology, La Jolla, California, USA.
2Sanofi, Cambridge, Massachusetts, USA.
3Sanofi Vaccines, Orlando, Florida, USA.
4Kadmon Corporation, A Sanofi Company, New York, New York, USA.
Address correspondence to: Donald R. Shaffer, 350 Water St. Cambridge, Massachusetts 02141, Phone: 617.947.2365; Email: Donald.Shaffer@sanofi.com. Or to: John R. Teijaro, 10550 North Torrey Pines Rd. La Jolla, California 92037, USA. Phone: 858.784.7397; Email: teijaro@scripps.edu.
Authorship note: IP, MB, and JT are co–first authors. DRS and JRT are co–senior authors.
Find articles by Martomo, S. in: PubMed | Google Scholar
1The Scripps Research Institute, Department of Immunology and Microbiology, La Jolla, California, USA.
2Sanofi, Cambridge, Massachusetts, USA.
3Sanofi Vaccines, Orlando, Florida, USA.
4Kadmon Corporation, A Sanofi Company, New York, New York, USA.
Address correspondence to: Donald R. Shaffer, 350 Water St. Cambridge, Massachusetts 02141, Phone: 617.947.2365; Email: Donald.Shaffer@sanofi.com. Or to: John R. Teijaro, 10550 North Torrey Pines Rd. La Jolla, California 92037, USA. Phone: 858.784.7397; Email: teijaro@scripps.edu.
Authorship note: IP, MB, and JT are co–first authors. DRS and JRT are co–senior authors.
Find articles by Patel, J. in: PubMed | Google Scholar
1The Scripps Research Institute, Department of Immunology and Microbiology, La Jolla, California, USA.
2Sanofi, Cambridge, Massachusetts, USA.
3Sanofi Vaccines, Orlando, Florida, USA.
4Kadmon Corporation, A Sanofi Company, New York, New York, USA.
Address correspondence to: Donald R. Shaffer, 350 Water St. Cambridge, Massachusetts 02141, Phone: 617.947.2365; Email: Donald.Shaffer@sanofi.com. Or to: John R. Teijaro, 10550 North Torrey Pines Rd. La Jolla, California 92037, USA. Phone: 858.784.7397; Email: teijaro@scripps.edu.
Authorship note: IP, MB, and JT are co–first authors. DRS and JRT are co–senior authors.
Find articles by Zhang, Y. in: PubMed | Google Scholar
1The Scripps Research Institute, Department of Immunology and Microbiology, La Jolla, California, USA.
2Sanofi, Cambridge, Massachusetts, USA.
3Sanofi Vaccines, Orlando, Florida, USA.
4Kadmon Corporation, A Sanofi Company, New York, New York, USA.
Address correspondence to: Donald R. Shaffer, 350 Water St. Cambridge, Massachusetts 02141, Phone: 617.947.2365; Email: Donald.Shaffer@sanofi.com. Or to: John R. Teijaro, 10550 North Torrey Pines Rd. La Jolla, California 92037, USA. Phone: 858.784.7397; Email: teijaro@scripps.edu.
Authorship note: IP, MB, and JT are co–first authors. DRS and JRT are co–senior authors.
Find articles by Langohr, I. in: PubMed | Google Scholar
1The Scripps Research Institute, Department of Immunology and Microbiology, La Jolla, California, USA.
2Sanofi, Cambridge, Massachusetts, USA.
3Sanofi Vaccines, Orlando, Florida, USA.
4Kadmon Corporation, A Sanofi Company, New York, New York, USA.
Address correspondence to: Donald R. Shaffer, 350 Water St. Cambridge, Massachusetts 02141, Phone: 617.947.2365; Email: Donald.Shaffer@sanofi.com. Or to: John R. Teijaro, 10550 North Torrey Pines Rd. La Jolla, California 92037, USA. Phone: 858.784.7397; Email: teijaro@scripps.edu.
Authorship note: IP, MB, and JT are co–first authors. DRS and JRT are co–senior authors.
Find articles by Cortez-Retamozo, V. in: PubMed | Google Scholar
1The Scripps Research Institute, Department of Immunology and Microbiology, La Jolla, California, USA.
2Sanofi, Cambridge, Massachusetts, USA.
3Sanofi Vaccines, Orlando, Florida, USA.
4Kadmon Corporation, A Sanofi Company, New York, New York, USA.
Address correspondence to: Donald R. Shaffer, 350 Water St. Cambridge, Massachusetts 02141, Phone: 617.947.2365; Email: Donald.Shaffer@sanofi.com. Or to: John R. Teijaro, 10550 North Torrey Pines Rd. La Jolla, California 92037, USA. Phone: 858.784.7397; Email: teijaro@scripps.edu.
Authorship note: IP, MB, and JT are co–first authors. DRS and JRT are co–senior authors.
Find articles by
Bangari, D.
in:
PubMed
|
Google Scholar
|
1The Scripps Research Institute, Department of Immunology and Microbiology, La Jolla, California, USA.
2Sanofi, Cambridge, Massachusetts, USA.
3Sanofi Vaccines, Orlando, Florida, USA.
4Kadmon Corporation, A Sanofi Company, New York, New York, USA.
Address correspondence to: Donald R. Shaffer, 350 Water St. Cambridge, Massachusetts 02141, Phone: 617.947.2365; Email: Donald.Shaffer@sanofi.com. Or to: John R. Teijaro, 10550 North Torrey Pines Rd. La Jolla, California 92037, USA. Phone: 858.784.7397; Email: teijaro@scripps.edu.
Authorship note: IP, MB, and JT are co–first authors. DRS and JRT are co–senior authors.
Find articles by Hadjipanayis, A. in: PubMed | Google Scholar
1The Scripps Research Institute, Department of Immunology and Microbiology, La Jolla, California, USA.
2Sanofi, Cambridge, Massachusetts, USA.
3Sanofi Vaccines, Orlando, Florida, USA.
4Kadmon Corporation, A Sanofi Company, New York, New York, USA.
Address correspondence to: Donald R. Shaffer, 350 Water St. Cambridge, Massachusetts 02141, Phone: 617.947.2365; Email: Donald.Shaffer@sanofi.com. Or to: John R. Teijaro, 10550 North Torrey Pines Rd. La Jolla, California 92037, USA. Phone: 858.784.7397; Email: teijaro@scripps.edu.
Authorship note: IP, MB, and JT are co–first authors. DRS and JRT are co–senior authors.
Find articles by Li, X. in: PubMed | Google Scholar
1The Scripps Research Institute, Department of Immunology and Microbiology, La Jolla, California, USA.
2Sanofi, Cambridge, Massachusetts, USA.
3Sanofi Vaccines, Orlando, Florida, USA.
4Kadmon Corporation, A Sanofi Company, New York, New York, USA.
Address correspondence to: Donald R. Shaffer, 350 Water St. Cambridge, Massachusetts 02141, Phone: 617.947.2365; Email: Donald.Shaffer@sanofi.com. Or to: John R. Teijaro, 10550 North Torrey Pines Rd. La Jolla, California 92037, USA. Phone: 858.784.7397; Email: teijaro@scripps.edu.
Authorship note: IP, MB, and JT are co–first authors. DRS and JRT are co–senior authors.
Find articles by Fantin, V. in: PubMed | Google Scholar
1The Scripps Research Institute, Department of Immunology and Microbiology, La Jolla, California, USA.
2Sanofi, Cambridge, Massachusetts, USA.
3Sanofi Vaccines, Orlando, Florida, USA.
4Kadmon Corporation, A Sanofi Company, New York, New York, USA.
Address correspondence to: Donald R. Shaffer, 350 Water St. Cambridge, Massachusetts 02141, Phone: 617.947.2365; Email: Donald.Shaffer@sanofi.com. Or to: John R. Teijaro, 10550 North Torrey Pines Rd. La Jolla, California 92037, USA. Phone: 858.784.7397; Email: teijaro@scripps.edu.
Authorship note: IP, MB, and JT are co–first authors. DRS and JRT are co–senior authors.
Find articles by Shaffer, D. in: PubMed | Google Scholar
1The Scripps Research Institute, Department of Immunology and Microbiology, La Jolla, California, USA.
2Sanofi, Cambridge, Massachusetts, USA.
3Sanofi Vaccines, Orlando, Florida, USA.
4Kadmon Corporation, A Sanofi Company, New York, New York, USA.
Address correspondence to: Donald R. Shaffer, 350 Water St. Cambridge, Massachusetts 02141, Phone: 617.947.2365; Email: Donald.Shaffer@sanofi.com. Or to: John R. Teijaro, 10550 North Torrey Pines Rd. La Jolla, California 92037, USA. Phone: 858.784.7397; Email: teijaro@scripps.edu.
Authorship note: IP, MB, and JT are co–first authors. DRS and JRT are co–senior authors.
Find articles by Teijaro, J. in: PubMed | Google Scholar
Published April 30, 2026 - More info
JCI Insight. 2026;11(12):e198701. https://doi.org/10.1172/jci.insight.198701.
© 2026 Pratumchai et al. This work is licensed under the Creative Commons Attribution 4.0 International License. To view a copy of this license, visit http://creativecommons.org/licenses/by/4.0/.
Received: August 11, 2025; Accepted: April 28, 2026

-
Results
SAR’877 prevents T cell inhibition by antagonizing PD-1. We generated SAR’877 by N-terminal fusion of a mutated variant of IL-15 bound to the sushi domain of IL-15Rα (referred to as mutIL-15) with a fully human anti–PD-1 antibody. SAR’877 is designed to facilitate delivery of IL-15 to PD-1+ T cells, resulting in superior proliferation and activation of tumor antigen-experienced CD8+ T cells capable of mediating antitumor activity (Figure 1A).
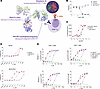 Figure 1
Functional activity of SAR’877. (A) SAR’877 design schematic. (B) PD-1/PD-L1 blockade measured by ELISA. (C) M07e cell proliferation following 3-day incubation with SAR’877 or control constructs (CTG assay). (D) Proliferation of parental (PD-1–) and PD-1+ M07e cells after 4-day incubation with immunocytokines (CTG assay; triplicate measurements). SAR’877 and IgG–mutIL-15 show equivalent potency in PD-1– cells, whereas SAR’877 is markedly more potent in PD-1+ cells, confirming cis-targeted activity. (E) pSTAT5 induction in prestimulated human T cells treated with immunocytokines for 15 minutes (flow cytometry; 2 representative donors of 4 tested).
We characterized binding and functional activity of the antibody-cytokine fusion using in vitro assays. SAR’877 exhibited potent binding to human PD-1 protein (Supplemental Figure 1A; supplemental material available online with this article; https://doi.org/10.1172/jci.insight.198701DS1). The extent of SAR’877 binding was equivalent to the anti–PD-1 antibody without cytokine fusion (anti–PD-1), as well as anti–PD-1 bound to WT IL-15 (anti–PD-1/wtIL-15). However, mutIL-15 fused to a nonspecific IgG (IgG–IL-15) showed no association with anti–PD-1. SAR’877 efficiently blocked the binding of human PD-1 to human PD-L1 in a dose-dependent manner and with similar potency compared with anti–PD-1 (Figure 1B). To examine the consequences of PD-1 blockade, an in vitro functional assay in which artificial antigen-presenting cells (APCs) overexpressing PD-L1 are cocultured with T cells expressing an activation induced luciferase reporter was used. SAR’877, anti–PD-1/wtIL-15 and anti–PD-1 each exhibited dose-dependent induction of T cell activation, consistent with reduced suppression through PD-1 engagement (Supplemental Figure 1B). A similar functional effect was observed when blocking the interaction between PD-1 and PD-L2 (Supplemental Figure 1C).
SAR’877 stimulates T cell proliferation with reduced potency compared with wtIL-15. We next investigated the activity of the cytokine moiety of SAR’877. Human IL-15 binds to the IL-2Rβ chain, which recruits IL-2Rγ chain to form a heterodimeric receptor and initiate signaling through the JAK/STAT pathway (7). IL-2Rβγ activation and downstream signaling results in lymphocyte proliferation and promotes cytotoxic effector function. SAR’877 IL-15 mutein contains a single amino acid mutation intended to decrease the potency of stimulation through IL-2Rβγ receptor. SAR’877 exhibited weak binding to HEK293 cells engineered to express human IL-2Rβ but lacking expression of PD-1 (Supplemental Figure 1D). Binding of SAR’877 was similar to IgG–mutIL-15, both of which were strongly reduced compared with anti–PD-1/wtIL-15. SAR’877 and IgG–mutIL-15 stimulated proliferation of human M07e leukemia cells (Figure 1C) as well as primary human peripheral blood mononuclear cells (PBMCs), including CD4+ and CD8+ T cells, in a dose-dependent manner (Supplemental Figure 1, E and F). Importantly, SAR’877 was less potent when compared with anti–PD-1/wtIL-15, demonstrating weaker activity of the mutated cytokine moiety.
The Fc region of SAR’877 is mutated to reduce activity through complement-dependent cytotoxicity (CDC) and antibody-dependent cytotoxicity (ADCC). SAR’877 and anti–PD-1 exhibit minimal binding to complement protein and minimal induction of CDC and ADCC compared with antibodies containing unmodified Fc regions (Supplemental Figure 1G). Together these results demonstrate that SAR’877 blocks PD-1–mediated immunosuppression, promotes lymphocyte proliferation through its mutIL-15 moiety, and exhibits minimal activity through CDC and ADCC.
SAR’877 activity is enhanced by expression of PD-1. To explore the effect of PD-1 expression on the activity of SAR’877, we engineered M07e cells to express human PD-1 protein and compared the activity of antibody-cytokine fusions in parental cells and PD-1+ engineered cells. M07e cells lacking PD-1 expression proliferated weakly in response to treatment with SAR’877 (Figure 1D). In the absence of PD-1 expression, there was no difference in activity of SAR’877 and IgG–mutIL-15, and both constructs were less potent compared with human WT, recombinant IL-15. In contrast, on PD-1+ M07e cells, the potency of SAR’877 was markedly higher (EC50 = 0.015 nM) compared with the nontargeted control IgG–mutIL-15 for which the EC50 was not quantifiable, confirming that SAR’877 activity is partially mediated by PD-1 expression (Figure 1D, panel 2). The effect of PD-1 expression on SAR’877 activity was further explored in primary human immune cells. Human T cells were isolated from PBMCs, prestimulated with a CD3/CD28 agonist, and treated with SAR’877 or various control antibody-cytokine fusions. Stimulation through IL-2Rβγ was measured using flow cytometry to detect phosphorylated STAT5 (pSTAT5). T cells that were preactivated and rested exhibit upregulation of surface PD-1 expression (Supplemental Figure 1H). Anti–PD-1 antibody on its own had no effect on pSTAT5, while SAR’877 induced pSTAT5 on both CD4+ and CD8+ T cells (Figure 1E). Strikingly, SAR’877 was 203-fold more potent compared with the nontargeted cytokine IgG–mutIL-15. SAR’877 activity overlapped with that of anti–PD-1/wtIL-15, demonstrating that expression of PD-1 compensates for the weaker activity of mutIL-15.
In a separate assay, we mixed M07e cells together with PD-1+ M07e cells at a 1:1 ratio and then added SAR’877, control IgG–mutIL-15, or recombinant IL-15 and measured pSTAT5. While antibiotic and clonal selection caused a higher overall pSTAT5 signal in our PD-1+ M07e cells, we observed that SAR’877 induced significantly higher levels of pSTAT5 than the control IgG–mutIL-15 (Supplemental Figure 1I). Indeed, SAR’877 induced nearly as much pSTAT5 as recombinant IL-15, whereas IgG–mutIL-15 showed only background levels of pSTAT5 at all but the 2 highest concentrations. In contrast, SAR’877 and control IgG–mutIL-15 showed overlapping pSTAT5 activation on PD-1– M07e cells. Thus, these results demonstrate that SAR’877 delivers IL-15–mediated stimulation through cis-targeting of PD-1+ cells and that PD-1 expression is critical to its functional activity.
The functional activity of SAR’877 was explored further in human primary immune cells. Human PBMCs were treated with SAR’877 for 6 days, and proliferation was measured through detection of Ki-67+ by flow cytometry. SAR’877 promoted proliferation of CD4+ T cells, CD8+ T cells, and NK cells (Supplemental Figure 1J). The strongest activity was observed in NK cells, which reached nearly 100% of cells proliferating, followed by CD8+ T cells, while effects in CD4+ T cells were limited. Since induction of proinflammatory cytokines may contribute to toxicity of cytokine therapies, the effect of SAR’877 on cytokine secretion was explored. PBMCs treated with SAR’877 secreted IFN-γ with virtually no secretion of IL-6 and TNF-α, in contrast to human recombinant IL-15, which induced high levels of all 3 cytokines (Supplemental Figure 1K). The effects of SAR’877 on activation of antigen-specific T cell responses were explored. PBMCs were treated with CD4 and CD8 antigen peptide pools in the presence of drug, and activation was measured through secretion of IFN-γ. SAR’877 stimulated IFN-γ release from both CD4+ and CD8+ T cells, with stronger activity compared with the control IgG–mutIL-15 and anti–PD-1 alone (Supplemental Figure 1L). To investigate function on NK cells, human NK cells were cocultured with K562 target cells in the presence of SAR’877 for 5 days, and target cell viability was monitored. SAR’877 and IgG–mutIL-15 similarly stimulated NK cell cytotoxicity against K562 target cells, while anti–PD-1 had no effect (Supplemental Figure 1M). Thus, SAR’877 stimulates proliferation, activation, and cytotoxic activity of CD4+ and CD8+ T cells as well as NK cells.
SAR’877 reverses T cell exhaustion in vitro. Our experiments suggest that SAR’877 preferentially stimulates PD-1–expressing immune cells. To understand how SAR’877 may modulate lymphocytes in the context of cancer, we investigated the expression of its target proteins using scRNA-seq data. Previously published datasets of tumor-infiltrating cells isolated from human lung, ovarian, colorectal, breast, and esophageal tumors were pooled and analyzed using the BioTuring Talk2Data (8). IL2RB and IL2RG genes were expressed in CD4+ T cells, CD8+ T cells, and NK cells, consistent with the known functions of the IL-2R (Supplemental Figure 2A). PDCD1 was limited to certain T cell subsets, including effector T cells and exhausted T cells. Having observed prominent expression of both PD-1 and IL-2 receptor in exhausted T cells, we explored the potential activity of SAR’877 on exhausted T cells in vitro. We utilized the human Modular Immune In vitro Construct (MIMIC) CD8+ T cell exhaustion assay previously described in the literature (9), in which in vitro derived dendritic cells (iDCs) are cocultured with autologous CD8+ T cells and repeatedly stimulated with antigen (Figure 2A). After repeated antigen stimulation, CD8+ T cells exhibit an exhausted phenotype characterized by diminished capacity to proliferate and reduced secretion of IFN-γ (Supplemental Figure 2B). Exhausted T cells also show elevated expression of PD-1 compared with unstimulated cells and functional T cells stimulated with antigen, consistent with the expression data from human tumor-infiltrating lymphocytes (TILs) (Supplemental Figure 2C). Exhausted CD8+ T cells were treated with SAR’877 or controls, followed by assessment of their proliferation and activation status. Exhausted CD8+ T cells treated with SAR’877 exhibited significantly increased proliferation upon antigen restimulation compared with untreated cells (Figure 2B). While both IgG–mutIL-15 and anti–PD-1 were also capable of stimulating proliferation, the effect was significantly lower compared with SAR’877. Similarly, exhausted CD8+ T cells treated with SAR’877 produced significantly higher levels of IFN-γ when compared with cells treated with either IgG–mutIL-15 or anti–PD-1 (Figure 2C). SAR’877 restores key functions of exhausted CD8+ T cells by promoting their proliferative capacity and enabling distinct expression of functional cytokines such as IFN-γ, 2 critical features typically lost during T cell exhaustion. Exhaustion marker surface staining performed at the end of the assay (day 19) revealed some minor decreases in PD-1, TIM-3, and LAG-3 median fluorescence intensity (MFI) after SAR’877 treatment relative to controls or other treatments (data not shown).
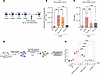 Figure 2
SAR’877 and anti–mPD-1–mutmIL-15 reverse CD8+ T cell exhaustion in vitro. (A) Schematic of the MIMIC human CD8+ T cell exhaustion assay. (B and C) Antigen-specific CD8+ T cell numbers and IFN-γ production following treatment with SAR’877 (10 mg/mL) or controls (n = 12 donors). Paired comparisons between treatment conditions were analyzed using the Wilcoxon signed-rank test. Data are shown as box plots with median and interquartile range. ***P < 0.001. (D) Schematic of the murine ex vivo T cell restimulation assay. (E) IFN-γ+ cell frequency among exhausted CD8+ T cells isolated from IFN-γ–YFP mice with chronic LCMV infection, following culture with anti–mPD-1–mutmIL-15 or controls (flow cytometry). Statistical significance was determined using one-way ANOVA followed by Šídák’s multiple comparisons test. Data are presented as bar plots showing mean ± SD. ****P < 0.0001.
We next sought to explore the activity of SAR’877 on exhausted T cells by leveraging a well-established model of chronic viral infection. C57BL/6J mice exposed to LCMV clone-13 develop persistent viral infection and develop dysfunctional, exhausted CD4+ and CD8+ T cells (10). Since SAR’877 does not cross react with mouse PD-1, we generated a murine surrogate version by fusing mutated mouse IL-15 (mutmIL-15) to a mouse anti–PD-1 antibody (anti–mPD-1). The functional activity of the surrogate molecule (herein referred to as anti–mPD-1–mutmIL-15 or PD-1–targeted IL-15 mutein) was characterized in in vitro assays. Anti–mPD-1–mutmIL-15 blocked interaction of murine PD-1 with its ligand PD-L1 (Supplemental Figure 2D) and stimulated proliferation of murine T lymphocyte cell line CTLL-2 (Supplemental Figure 2E). Like the human construct, anti–mPD-1–mutmIL-15 was less potent at stimulating lymphocyte proliferation compared with anti–PD-1 antibody fused to WT murine IL-15 (anti–PD-1–wtmIL-15) and, thus, demonstrated comparable activity to the human molecule. The ability of anti–mPD-1–mutmIL-15 to improve functions of exhausted CD8+ T cells was further tested using the in vitro T cell exhaustion assay as depicted in Figure 2D (11). Flow cytometry analysis following 5 days of in vitro stimulation of splenocytes from chronically LCMV-infected mice revealed that anti–mPD-1–mutmIL-15 not only strongly promoted IFN-γ production by CD8+ T cells, but it also enhanced expansion of TIM-3– DbGP33+ antigen-specific CD8+ T cells while concurrently reducing PD-1 expression (Figure 2E and Supplemental Figure 2, F–K), demonstrating superior functional restoration compared with anti–mPD-1 or nontargeted mIgG–mutmIL-15.
SAR’877 reverses T cell exhaustion in vivo. Given that CD8+ T cells play crucial roles in promoting antiviral immune response during chronic LCMV infection, we tested the in vivo function of the PD-1–targeted IL-15 mutein in promoting viral clearance in C57BL/6J WT mice persistently infected with LCMV CL13 (Figure 3A). Treatments with anti–mPD-1–mutmIL-15 promoted faster clearance of the virus from both serum and kidney compared with treatments with anti–mPD-1 or mIgG–mutmIL-15 (Figure 3, B and C). A combination of nontargeted mIgG–mutmIL-15 with anti–mPD-1 was able to effectively reduce viral titers in the serum but not the kidney (Figure 3C). Flow cytometry analyses of spleens at day 35 after infection revealed that in vivo treatments with anti–mPD-1–mutmIL-15 significantly increased antigen-specific CD8+ T cells and T precursor exhausted (Tpex) TCF1+TIM-3–CD8+ T cells compared with controls (Figure 3, D and E). In addition, ex vivo stimulation with LCMV-specific GP33 peptide showed that mice treated with the PD-1–targeted IL-15 mutein expressed markers indicative of effector function, including the degranulation marker CD107a, IFN-γ, TFN-α, and IL-2 compared with control treatments (Figure 3F and Supplemental Figure 3, A and B). Moreover, PD-1–targeted IL-15 mutein significantly increased antigen-specific CD4+ T cells and markedly improved their ability to produce IFN-γ upon ex vivo stimulation (Figure 3, G and H). Because both Tfh and Tregs express PD-1, we assessed whether our anti–mPD-1–mutmIL-15 molecule altered these cellular populations. We observed no significant change in either Tfh or Tregs compared with the isotype control with any of the treatments except the mIgG–mutmIL-15, which significantly increased Treg numbers (Supplemental Figure 3, C and D). Because IL-15 exerts significant effects on NK cell activation/differentiation, we also measured NK cell numbers in Clone-13–infected mice with all treatments. As anticipated, treatment with mIgG–mutmIL-15 or mIgG–mutmIL-15 + anti–PD-1 significantly increased NK cell numbers compared with the isotype control, and anti–mPD-1–mutmIL-15 modestly decreased NK cell numbers in spleen (Supplemental Figure 3E). We finally tested whether the CD8+ T cell compartment was solely responsible for the effects of anti–mPD-1–mutmIL-15 on reversing T cell exhaustion and promoting faster LCMV clearance by employing the in vivo CD4+ T cell depletion method as previously described (12). Notably, an intact-CD4+ T cell compartment was required for PD-1–targeted IL-15 mutein to expand GP33-specific CD8+ T cells (Supplemental Figure 3F). However, we did observe significant increases in IFN-γ+ GP33-41 specific CD8+ T cells (Supplemental Figure 3G). Furthermore, CD4+ T cell depletion also abolished the enhanced viral clearance in serum and lung tissues following anti–PD-1–mutmIL-15 (Supplemental Figure 3H). Thus, our data suggest that PD-1–targeted IL-15 mutein requires CD4+ T cell targeting for its functional outcomes.
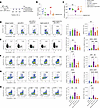 Figure 3
SAR’877 murine surrogate reverses T cell exhaustion in vivo and promotes clearance of persistent LCMV infection. (A) Schematic diagram of in vivo chronic LCMV infection model. (B and C) LCMV viral titer measured in serum and kidney of mice treated with 1 mg/kg anti–mPD-1–mutmIL-15 or controls at day 35 after infection. Mice harboring chronic LCMV infection were treated with antibody-cytokine fusions, and effects on immune cells in spleens were analyzed by flow cytometry. Anti–mPD-1–mutmIL-15 strongly increased expansion and activation viral specific T cells compared with anti–PD-1 or the nontargeted control cytokine mIgG–mutmIL-15. Data are shown as scatter dot plots with mean. Statistical significance was assessed using the Mann-Whitney U test. **P < 0.01. (D–H) Expansion of antigen-specific CD8+ T cells (D), expansion of antigen-specific TCF1+stem-like CD8+ T cells (E), expansion of IFN-γ-producing CD8+ T cells after ex vivo stimulation with LCMV-specific GP33–41 peptide (F), expansion of virus-specific CD4+ T cells (G), and (**P < 0.01) IFN-γ–producing CD4+ T cells (H) following ex vivo stimulation with LCMV-specific GP61–80 peptide stimulation were measured using flow cytometry. Experiments were carried out with n = 4–5 and repeated 3 times. Statistical significance was determined using 1-way ANOVA followed by Šídák’s multiple comparisons test. *P < 0.05, **P < 0.01, ***P < 0.001, ****P < 0.0001.
To better understand how the PD-1–targeted IL-15 mutein improves antiviral T cell responses, we analyzed splenic T cells in the LCMV model by scRNA-seq. Mice infected with LCMV clone-13 (Cl-13) were treated with anti–mPD-1–mutmIL-15, mIgG–mutmIL-15, mIgG–mutmIL-15 + anti–mPD-1, anti–mPD-1, or isotype control. Total splenic T cells were analyzed at day 30 after infection by scRNA-seq. Following removal of low-quality cells and doublets, clustering at resolution 0.7 produced 14 clusters including subset-specific clusters such as Tregs (C3) or naive/central memory CD8+ T cells (C4) but also mixed clusters defined by cell state such as mitotic CD4+ and CD8+ TCF1lo T cells (C12) (Figure 4, A and B, and Supplemental Figure 4A). These cell identities were corroborated using whole-transcriptome–based cell identification by the SingleR package with the ImmGen ultra-low input RNA-seq dataset (GSE109125) as reference (Supplemental Figure 4A). There were 4 clusters of cycling T cells, 2 containing TCF1+ T cells (C8, C10) and 2 containing more highly differentiated TCF1lo T cells (C11, C12). C11 primarily contains dividing effector CD8+ T cells characterized by Gzma expression (Figure 4, B and C).
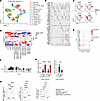 Figure 4
Single-cell transcriptomic analysis of anti–mPD-1–mutmIL-15 effects on T cells. C57BL/6 mice with chronic LCMV infection were treated with isotype control, anti–mPD-1, anti–mPD-1–mutmIL-15, mIgG–mutmIL-15, or mIgG–mutmIL-15 + anti–mPD-1. (A) UMAP clustering of pooled CD4+ and CD8+ T cells. (B) Violin plot of cluster marker genes. (C) Gene expression in UMAP space. (D) Relative cluster abundance per sample. (E) Dot plot of gene expression and cell fraction in Cluster 1. (F) CD4 expression across clusters. (G) Cell fractions in clusters C1, C11, C12 for anti–mPD-1–mutmIL-15 vs. other treatments Statistical significance was determined using a 2-tailed unpaired t test (**P = 0.0018). (H) Flow cytometry of Ki-67+ virus-specific CD4+ T cells and Ki-67+CD44+PD-1+TCF1– CD4+/CD8+ T cells at day 30 after infection. Statistical significance was determined using 1-way ANOVA followed by Šídák’s multiple comparisons test. **P < 0.01, ***P < 0.001, ****P < 0.0001.
Analyzing the relative fraction of T cells in each cluster by treatment revealed that PD-1–targeted IL-15 mutein uniquely enhanced the relative proportion of T cells in C11 and C12, whereas mIgG–mutmIL-15 enhanced C8 and C10 with both antibodies, reducing the relative fraction of C0 cells (Figure 4D). Interestingly, all the antibody-enhanced clusters contained actively cycling T cells, suggesting that anti–mPD-1–mutmIL-15 and mIgG–mutmIL-15 promote cycling of T cells. Specifically, the anti–mPD-1–mutmIL-15 enhanced C11 and C12 containing mostly S-phase TCF1lo T cells (C11) and mitotic TCF1lo T cells (C12), whereas mIgG–mutmIL-15 enhanced the mitotic TCF1+ T cells (C8) and G1 phase TCF1+ T cells (C10). The CD4+ T cell cluster C2, reduced in relative abundance by both antibodies, expressed the highest levels of inhibitory receptors and transcription factor Tox (Figure 4E). Of the dividing clusters, C11 and C12 also contained the highest percentage of CD4-expressing T cells, and the ratio of CD4/CD8a in C12 was increased in anti–PD-1–mutmIL-15–treated mice, suggesting the PD-1–targeted IL-15 mutein enhances the cycling of CD4+ T cells (Supplemental Figure 4B). Indeed, compared with other treatments, the fraction of C2 was significantly reduced in anti–mPD-1–mutmIL-15–treated mice, and the fraction of C11 and C12 significantly enhanced (Figure 4, F and G).
Examining the vectors estimated from RNA velocity data aligned with the identification of C2 as a cluster of terminally differentiated CD4+ T cells and C6 terminally differentiated, exhausted CD8+ T cells (Supplemental Figure 4C). The pattern of velocity vectors also supported the model of M-phase cluster C12 giving rise to TCF1– T cells, whereas M-phase cluster C10 containing TCF1+ T cells mostly connected to other TCF1+ clusters (Supplemental Figure 4C). These observations suggest that anti–mPD-1–mutmIL-15 selectively enhanced the cycling of TCF1lo T cells, whereas mIgG–mutmIL-15 selectively enhanced the cycling of TCF1+ T cells. The expression pattern of Pdcd1 and pseudotime predicted from RNA velocity data supported the notion that cluster C2 contains terminally differentiated/exhausted CD4+ T cells expressing the highest levels of Pdcd1, and PD-1–targeted IL-15 mutein and nontargeted IL-15 mutein, thus, prevent the formation of these cells by promoting the cycling of less terminally exhausted CD4+ T cells (Supplemental Figure 4, D and E). Partition-based graph abstraction analysis and random walk analysis provided data consistent with the hypothesis that differentiated clusters C0 and C6, and CD4+ T cells clusters C5 and C2, originate primarily from the pool of cycling T cells in C12–C11, suggesting that these cells are undergoing antigen-induced expansion rather than homeostatic proliferation (Supplemental Figure 4, E and F). Consistently, flow cytometry analyses of total splenocytes from day 30 after infection showed that anti–mPD-1–mutmIL-15 strongly induced proliferation of virus-specific CD4+ T cells, TCF1–PD-1+CD4+ T cells, and TCF1–PD-1+CD8+ T cells compared with other treatment groups (Figure 4H). Complementary ex vivo stimulation of transferred P14 T cells revealed that TCF1–CD8+ T cells produced slightly more IFN-γ than TCF1+ cells, indicating that these proliferating TCF1– cells retain effector function (Supplemental Figure 4D).
PD-1 targeted IL-15 mutein exhibits potent antitumor activity in mouse tumor models. We next explored the activity of the PD-1–targeted IL-15 mutein in different syngeneic mouse tumor models. Antitumor efficacy was observed broadly across 12 murine tumor models, with 5 models showing complete responses in several mice and all 12 models achieving statistically significant antitumor efficacy compared with vehicle control (P < 0.05) (Table 1 and Supplemental Figure 5A). Treatment was generally well tolerated, with minimal to no weight loss observed (Supplemental Figure 5B). In the MC38 tumor model, PD-1–targeted IL-15 delivery did not compromise NK cell activity; the mouse surrogate of SAR’877 induced robust NK cell expansion, comparable with untargeted mutmIL-15, and significantly increased the frequency of functionally active NK cells, as evidenced by elevated granzyme B expression (Supplemental Figure 5C). These data demonstrate that, despite its design to preferentially engage PD-1+ T cells, SAR’877 preserves NK cell expansion and cytotoxic function in vivo, supporting both adaptive and innate cytotoxic immune responses. In contrast, PD-1–WT IL-15 induced rapid lethal toxicity in MC38 tumor-bearing mice, highlighting the narrow therapeutic window of unmodified IL-15. SAR’877, incorporating an attenuated IL-15 variant, was well tolerated while maintaining PD-1–dependent immune activity (Supplemental Figure 5D). Collectively, these data emphasize that cytokine attenuation enables safe, dual engagement of adaptive and innate cytotoxic immunity with PD-1–targeted IL-15 therapy. To further dissect the mechanism of action of the PD-1–targeted IL-15 mutein in tumor-bearing mice, we used the well-characterized B16-F10-OVA mouse melanoma model (Figure 5A). Anti–mPD-1–mutmIL-15 antitumor efficacy was tested against isotype control, anti–mPD-1, and an untargeted murine IL-15 mutein (mIgG–mutmIL-15). At the end of the study, tumors were harvested for multiomic characterization. Anti–mPD-1–mutmIL-15 induced the strongest antitumor efficacy with tumor weights (Figure 5B) and tumor sizes (Supplemental Figure 5E) being significantly reduced compared with the isotype control group at day 21 when mice were sacrificed and tissues collected for analyses. Consistent with the LCMV model showing preferential expansion and activation of antigen-specific T cells, IFN-γ production by splenocytes restimulated with OVA in vitro 11 days after a single dose of drug was significantly increased in mice treated with anti–mPD-1–mutmIL-15 (Figure 5B). IHC staining revealed significant reduction of PD-L1+ cells only within the tumors treated with anti–mPD-1–mutmIL-15 compared with the isotype control (Supplemental Figure 5F). Parallel IHC staining showed significant increase of CD8+ cells in all treated groups in comparison with isotype control, with anti–mPD-1–mutmIL-15 inducing the most substantial effect (Supplemental Figure 5F). We also noticed an upward trend in NKp46+ cells in the treated groups compared with the isotype control group, although variability in data show only significance for the mIgG–mutmIL-15–treated group (Supplemental Figure 5F). These data were supported by flow cytometry performed on dissociated tumors with significant increase in CD8+ T cells and CD49b+ NK cells (Supplemental Figure 5G). Given that NK cells do not express PD-1 but express IL-2 receptor, it is reasonable to consider that they might be equally stimulated by untargeted IL-15 as they would be by our PD-1–targeted IL-15 approach as previously shown in the literature (13). Additionally, we observed significant increase in CD4+ T cells as well as in conventional DCs (cDCs) in anti–mPD-1–mutmIL-15–treated tumors relative to isotype control, while FoxP3+ Tregs were not affected by treatment (Supplemental Figure 5G).
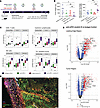 Figure 5
Anti–mPD-1–mutmIL-15 activity in murine B16-F10-OVA melanoma model. (A) Schematic of the B16-F10-OVA biomarker study. (B) B16-F10-OVA tumor weights at sacrifice and IFN-γ production by OVA-restimulated splenocytes 11 days after treatment. Data are shown as scatter dot plots with mean. Statistical significance was assessed by 1-way ANOVA followed by Dunnett’s multiple comparisons test versus anti–mPD-1–mutmIL-15. *P < 0.05; ***P < 0.001. (C) GeoMx DSP cell-type abundance (MCP-counter) and Th1 pathway enrichment (GSVA) by spatial compartment (Leading Edge, Tumor, Necrosis). Data are shown as box plots with median and interquartile range. *P < 0.05. (D) Representative GeoMx DSP image of CD8+ T cell infiltration in anti–mPD-1–mutmIL-15-treated tumors. Scale bar 100 μm. (E) GeoMx DSP volcano plots of DEGs in anti–mPD-1–mutmIL-15 vs. isotype control, per compartment. Group comparisons were performed using Wilcoxon rank-sum tests with FDR correction. FDR < 0.05 was considered statistically significant.
We further analyzed the treated tumors using the NanoString GeoMx Digital Spatial Profiler (DSP) platform with the mouse whole transcriptome assay. Antibodies against CD45 and CD8 were used as morphological markers to define immune cells, while a cocktail of antibodies against S100B/PMEL17 was used to mark melanoma cells (Figure 5D). Those markers, as well as parallel H&E images, were used to define 3 tumor compartments (“Leading-Edge”, “Tumor”, and “Necrosis”) and analyze over 300 regions of interest (ROIs). The abundances of 7 immune cell types were estimated using Microenvironment Cell Populations–counter (MCP-counter), including cytotoxic lymphocytes (CTLs) defined as the combination of T γδ cells, CD8+ T cells, and NK cells (14). For each compartment, the average estimated abundances of each cell type per tissue are compared against anti–mPD-1–mutmIL-15. Comparative analysis showed that anti–mPD-1–mutmIL-15 significantly increased the infiltration of CD8+ T cells and CTLs in both the leading-edge and tumor compartments (Figure 5C). Notably, CD8+ T cell infiltration in the leading edge was significantly greater with anti–mPD-1–mutmIL-15 than with anti–mPD-1 alone. Furthermore, treatment with anti–mPD-1–mutmIL-15 led to a significant increase in NK cell abundance in the tumor compartment, along with other innate and adaptive immune populations (Figure 5C and Supplemental Figure 5H). In contrast, anti–mPD-1 only significantly increased CTL infiltration in both compartments, without a significant effect on NK or CD8+ T cells compared with the isotype control (data not shown). Additionally, leveraging Th1 upregulated genes identified in a recently published mouse CD4+ T cell atlas (15), we further examined the pathway activity of CD4+ T cell subtype, Th1. The gene set variation analysis (GSVA) (16) showed that anti–mPD-1–mutmIL-15 significantly increased the activity of Th1 pathway in both the leading edge and the tumor compartments relative to the isotype control. In contrast, anti–mPD-1 only showed significance in the leading edge with a lower amplitude than the PD-1–targeted IL-15 mutein (data not shown). The results from GSVA supports previous observation in the LCMV model, in which we noted a strong potentiation of the CD4 response with viral-specific IFN-γ–secreting CD4+ T cells driven by anti–mPD-1–mutmIL-15. Overall, our findings illustrate that spatial transcriptomic profiling enables us to decipher various immune cell populations and pinpoint their responses to treatment within tumors.
We then performed gene expression analysis by comparing each treatment group to the isotype control group per spatial compartment. Differential gene expression (DGE) analysis revealed significant upregulation of genes associated with the cytotoxicity and activation of T and NK cells such as Gzma, Gzmb, Tnfrsf18, and Ncr1 by anti–mPD-1–mutmIL-15 in both tumor and leading-edge compartments compared with the isotype control group (Figure 5E), while anti–mPD-1 and mIgG–mutmIL-15 showed limited upregulation of the same genes (Supplemental Figure 5I). In concordance with the gene expression data, Ncr1, a marker of NK cell activation also known as NKp46, was confirmed by IHC to be upregulated in tumors treated with the PD-1–targeted IL-15 mutein relative to the isotype control (Supplemental Figure 5F). Ingenuity Pathway Analysis (IPA) predicts the anti–mPD-1–mutmIL-15 molecule induced more strongly various biological functions of T and NK cells including activation, cytotoxicity, maturation, and proliferation than isotype control (Table 2) or anti–mPD-1 alone (Supplemental Table 3). In addition, anti–mPD-1–mutmIL-15 highly upregulated genes associated with dendritic cell accumulation and the recruitment of effector T cells such as Xcl1, Ifng, Cxcr3, Cxcl9, and Cxcl10 in both leading edge and tumor compartment in comparison with isotype control (Figure 5E). The recruitment of cDCs confirmed by flow cytometry (Supplemental Figure 5G) as well as the upregulation of various biological functions of dendritic cells revealed by IPA (Table 3) suggest a positive immune feedback loop as previously described in the literature (17).
 Table 2
Comparison of biological functions of T and NK cells, treatment groups relative to isotype control
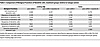 Table 3
Comparison of Biological Functions of Dendritic cells, treatment groups relative to isotype control.
Overall, these data show that PD-1–targeted IL-15 mutein promotes intratumoral infiltration of innate and adaptive immune cells such as NK and CD8+ T cells and enhances their cell killing activity while promoting a strong Th1 response with upregulation of genes such as Ifng which led to a more robust anti-tumor effect than that seen with anti–mPD-1 or mIgG–mutmIL-15.
SAR’877 human candidate molecule exhibits potent antitumor activity in mouse model. To test the human SAR’877 molecule, we utilized a mouse model in which BALB/c mice with knock-ins of human PD-1 and PD-L1 genes were engrafted with s.c. CT26 tumors expressing human PD-L1 (CT26-huPD-L1). A single i.v. dose of SAR’877 was administered to tumor-bearing mice, and tumor size was monitored. We initially tested a range of SAR’877 doses to gain insights into efficacy and tolerability profiles. All doses tested, ranging from 0.5 to 12 mg/kg, resulted in significant antitumor efficacy in a dose-dependent manner (Supplemental Figure 6A). Single-dose treatment was generally well tolerated, with no body weight loss observed at doses up to 6 mg/kg, while SAR’877 administered at 12 mg/kg induced a transient and reversible body weight loss of ~5% (Supplemental Figure 6A). In further experiments, we dosed mice once weekly for 3 weeks and observed SAR’877 induced strong inhibition in tumor growth resulting in tumor stasis at 6 mg/kg (Figure 6A). Among the treated mice, 2 individual mice treated with SAR’877 exhibited complete tumor clearance with no regrowth when monitored up to 87 days. Treatment with nontargeted IgG–mutIL-15 in combination with anti–PD-1 was less efficacious compared with SAR’877, inducing only a minor delay in tumor growth (Figure 6A). Similar results were observed when higher doses were tested, with 12 mg/kg SAR’877 showing stronger antitumor efficacy compared with the combination of anti–PD-1 + IgG–IL-15 mutein (Supplemental Figure 6, B and C). These results demonstrate the superior activity of SAR’877 compared with combination of anti–PD-1 and cytokine as separate agents. To further probe the role of PD-1 targeting on SAR’877 activity, SAR’877 was coadministered with anti–PD-1 antibody, which would compete for PD-1 binding and interrupt the PD-1–targeted activity of SAR’877. Coadministration of anti–PD-1 with SAR’877 resulted in reduced tumor growth inhibition (TGI = 68.2%) compared with SAR’877 (TGI=94.8%) (Supplemental Figure 6C).
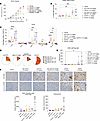 Figure 6
Antitumor efficacy of SAR’877 in a humanized mouse tumor model. SAR’877 was evaluated in BALB/c mice with human PD-1/PD-L1 knock-in bearing subcutaneous CT26-huPD-L1 tumors. (A) Tumor volume after IP treatment with SAR’877 or control antibody-cytokine fusions (anti–PD-1: BIW; all others: QW; n = 6/group). (B–F) Ex vivo tumor analyses: CD45+ cell frequency by flow cytometry (B), T and NK cell phenotyping (C), TIL subpopulation characterization (D), CD8+ T cell/Treg ratio (E), and CD8 and Granzyme B expression by IHC (F). Data are presented as bar plots showing mean ± SD. Statistical significance was assessed by 1-way ANOVA followed by Dunnett’s multiple comparisons test versus vehicle group. *P < 0.05; **P < 0.01; ***P < 0.001; ****P < 0.0001. Scale bar: 20 �m.
We utilized the same mouse tumor model to investigate the mechanism of action of the SAR’877 antibody-cytokine fusion. Human PD-1/PD-L1 knock-in mice bearing CT26-hPD-L1 tumors were treated with a single dose of SAR’877 or control treatments and tissues were collected 7 days later for analysis. Flow cytometry analysis revealed that SAR’877 at a dose of either 1 mg/kg or 6 mg/kg significantly increased the percentage of CD45+ cells in the tumor microenvironment, while anti–PD-1, IgG–mutIL-15, and the combination of anti–PD-1 and IgG–mutIL-15 had minimal to no effects (Figure 6B). Among CD45+ cells in the tumor, SAR’877 preferentially expanded CD8+ T cells, with no substantial effect on CD4+ T cells (Figure 6C). The percentage of Tregs and NK cells decreased, potentially resulting from the strong preferential expansion of CD8+ T cells (Figure 6C). Deeper analysis of T cell subsets revealed that SAR’877 induced a striking expansion of CD3+CD8+CD62L–CD44+ effector memory cells while other subsets were largely unchanged (Figure 6D). Consistent with the preferential expansion of CD8+ effector memory cells and limited effects on intratumoral CD4+ T cells, the CD8+ T cell/Treg ratio was strongly increased in tumors following SAR’877 treatment (Figure 6E). The increased T cell infiltration observed by flow cytometry was further confirmed by IHC analysis, which revealed significantly increased CD8+ positivity and increased granzyme B in the microenvironment of SAR’877-treated tumors (Figure 6F).


