
Research ArticleCardiologyHepatologyMetabolism
Open Access |  10.1172/jci.insight.198823
Single-cell spatial transcriptomics reveals hepatocyte reprogramming in Fontan-associated liver disease
Brandon M. Lehrich,1,2,3,4 Jordann N. Lewis,5,6 Vik Meadows,1,2,3 Lori Schmitt,7 Mylarappa B. Ningappa,8 Jia-Jun Liu,1,2,3 Silvia Liu,1,2,3 Catherine K. Gestrich,7 Victor O. Morell,8 Rakesh Sindhi,9 Satdarshan P. Monga,1,2,3,10 and Anita Saraf3,5,6,11
1Organ Pathobiology and Therapeutics Institute, and
2Department of Pharmacology and Chemical Biology, University of Pittsburgh School of Medicine, Pittsburgh, Pennsylvania, USA.
3Pittsburgh Liver Research Center, University of Pittsburgh and University of Pittsburgh Medical Center, Pittsburgh, Pennsylvania, USA.
4Medical Scientist Training Program, University of Pittsburgh, Pittsburgh, Pennsylvania, USA.
5Heart Institute, UPMC Children’s Hospital of Pittsburgh, Department of Pediatrics, Pittsburgh, Pennsylvania, USA.
6UPMC Heart and Vascular Institute, Department of Medicine, Pittsburgh, Pennsylvania, USA.
7Department of Pathology, University of Pittsburgh, Pittsburgh, Pennsylvania, USA.
8Division of Cardiothoracic Surgery, Department of Surgery, and
9Center for Computational Immunogenetics and Drug Repurposing (CCIDR), Pediatric Transplant Surgery, University of Pittsburgh, Pennsylvania, USA.
10Division of Gastroenterology, Hepatology and Nutrition, Department of Medicine, University of Pittsburgh School of Medicine, Pittsburgh, Pennsylvania USA.
11Division of Cardiology, Department of Medicine, University of Pittsburgh, Pittsburgh, Pennsylvania, USA.
12RK Mellon Institute for Pediatric Research, Department of Pediatrics, Pittsburgh, Pennsylvania, USA.
Address correspondence to: Anita Saraf, John G. Rangos Sr. Research Center, #8122, 4401 Penn Ave, Pittsburgh, Pennsylvania 15224, USA. Phone: 412.864.2545; Email: saraf@pitt.edu.
Find articles by Lehrich, B. in: PubMed | Google Scholar
1Organ Pathobiology and Therapeutics Institute, and
2Department of Pharmacology and Chemical Biology, University of Pittsburgh School of Medicine, Pittsburgh, Pennsylvania, USA.
3Pittsburgh Liver Research Center, University of Pittsburgh and University of Pittsburgh Medical Center, Pittsburgh, Pennsylvania, USA.
4Medical Scientist Training Program, University of Pittsburgh, Pittsburgh, Pennsylvania, USA.
5Heart Institute, UPMC Children’s Hospital of Pittsburgh, Department of Pediatrics, Pittsburgh, Pennsylvania, USA.
6UPMC Heart and Vascular Institute, Department of Medicine, Pittsburgh, Pennsylvania, USA.
7Department of Pathology, University of Pittsburgh, Pittsburgh, Pennsylvania, USA.
8Division of Cardiothoracic Surgery, Department of Surgery, and
9Center for Computational Immunogenetics and Drug Repurposing (CCIDR), Pediatric Transplant Surgery, University of Pittsburgh, Pennsylvania, USA.
10Division of Gastroenterology, Hepatology and Nutrition, Department of Medicine, University of Pittsburgh School of Medicine, Pittsburgh, Pennsylvania USA.
11Division of Cardiology, Department of Medicine, University of Pittsburgh, Pittsburgh, Pennsylvania, USA.
12RK Mellon Institute for Pediatric Research, Department of Pediatrics, Pittsburgh, Pennsylvania, USA.
Address correspondence to: Anita Saraf, John G. Rangos Sr. Research Center, #8122, 4401 Penn Ave, Pittsburgh, Pennsylvania 15224, USA. Phone: 412.864.2545; Email: saraf@pitt.edu.
Find articles by Lewis, J. in: PubMed | Google Scholar
1Organ Pathobiology and Therapeutics Institute, and
2Department of Pharmacology and Chemical Biology, University of Pittsburgh School of Medicine, Pittsburgh, Pennsylvania, USA.
3Pittsburgh Liver Research Center, University of Pittsburgh and University of Pittsburgh Medical Center, Pittsburgh, Pennsylvania, USA.
4Medical Scientist Training Program, University of Pittsburgh, Pittsburgh, Pennsylvania, USA.
5Heart Institute, UPMC Children’s Hospital of Pittsburgh, Department of Pediatrics, Pittsburgh, Pennsylvania, USA.
6UPMC Heart and Vascular Institute, Department of Medicine, Pittsburgh, Pennsylvania, USA.
7Department of Pathology, University of Pittsburgh, Pittsburgh, Pennsylvania, USA.
8Division of Cardiothoracic Surgery, Department of Surgery, and
9Center for Computational Immunogenetics and Drug Repurposing (CCIDR), Pediatric Transplant Surgery, University of Pittsburgh, Pennsylvania, USA.
10Division of Gastroenterology, Hepatology and Nutrition, Department of Medicine, University of Pittsburgh School of Medicine, Pittsburgh, Pennsylvania USA.
11Division of Cardiology, Department of Medicine, University of Pittsburgh, Pittsburgh, Pennsylvania, USA.
12RK Mellon Institute for Pediatric Research, Department of Pediatrics, Pittsburgh, Pennsylvania, USA.
Address correspondence to: Anita Saraf, John G. Rangos Sr. Research Center, #8122, 4401 Penn Ave, Pittsburgh, Pennsylvania 15224, USA. Phone: 412.864.2545; Email: saraf@pitt.edu.
Find articles by Meadows, V. in: PubMed | Google Scholar
1Organ Pathobiology and Therapeutics Institute, and
2Department of Pharmacology and Chemical Biology, University of Pittsburgh School of Medicine, Pittsburgh, Pennsylvania, USA.
3Pittsburgh Liver Research Center, University of Pittsburgh and University of Pittsburgh Medical Center, Pittsburgh, Pennsylvania, USA.
4Medical Scientist Training Program, University of Pittsburgh, Pittsburgh, Pennsylvania, USA.
5Heart Institute, UPMC Children’s Hospital of Pittsburgh, Department of Pediatrics, Pittsburgh, Pennsylvania, USA.
6UPMC Heart and Vascular Institute, Department of Medicine, Pittsburgh, Pennsylvania, USA.
7Department of Pathology, University of Pittsburgh, Pittsburgh, Pennsylvania, USA.
8Division of Cardiothoracic Surgery, Department of Surgery, and
9Center for Computational Immunogenetics and Drug Repurposing (CCIDR), Pediatric Transplant Surgery, University of Pittsburgh, Pennsylvania, USA.
10Division of Gastroenterology, Hepatology and Nutrition, Department of Medicine, University of Pittsburgh School of Medicine, Pittsburgh, Pennsylvania USA.
11Division of Cardiology, Department of Medicine, University of Pittsburgh, Pittsburgh, Pennsylvania, USA.
12RK Mellon Institute for Pediatric Research, Department of Pediatrics, Pittsburgh, Pennsylvania, USA.
Address correspondence to: Anita Saraf, John G. Rangos Sr. Research Center, #8122, 4401 Penn Ave, Pittsburgh, Pennsylvania 15224, USA. Phone: 412.864.2545; Email: saraf@pitt.edu.
Find articles by Schmitt, L. in: PubMed | Google Scholar
1Organ Pathobiology and Therapeutics Institute, and
2Department of Pharmacology and Chemical Biology, University of Pittsburgh School of Medicine, Pittsburgh, Pennsylvania, USA.
3Pittsburgh Liver Research Center, University of Pittsburgh and University of Pittsburgh Medical Center, Pittsburgh, Pennsylvania, USA.
4Medical Scientist Training Program, University of Pittsburgh, Pittsburgh, Pennsylvania, USA.
5Heart Institute, UPMC Children’s Hospital of Pittsburgh, Department of Pediatrics, Pittsburgh, Pennsylvania, USA.
6UPMC Heart and Vascular Institute, Department of Medicine, Pittsburgh, Pennsylvania, USA.
7Department of Pathology, University of Pittsburgh, Pittsburgh, Pennsylvania, USA.
8Division of Cardiothoracic Surgery, Department of Surgery, and
9Center for Computational Immunogenetics and Drug Repurposing (CCIDR), Pediatric Transplant Surgery, University of Pittsburgh, Pennsylvania, USA.
10Division of Gastroenterology, Hepatology and Nutrition, Department of Medicine, University of Pittsburgh School of Medicine, Pittsburgh, Pennsylvania USA.
11Division of Cardiology, Department of Medicine, University of Pittsburgh, Pittsburgh, Pennsylvania, USA.
12RK Mellon Institute for Pediatric Research, Department of Pediatrics, Pittsburgh, Pennsylvania, USA.
Address correspondence to: Anita Saraf, John G. Rangos Sr. Research Center, #8122, 4401 Penn Ave, Pittsburgh, Pennsylvania 15224, USA. Phone: 412.864.2545; Email: saraf@pitt.edu.
Find articles by Ningappa, M. in: PubMed | Google Scholar
1Organ Pathobiology and Therapeutics Institute, and
2Department of Pharmacology and Chemical Biology, University of Pittsburgh School of Medicine, Pittsburgh, Pennsylvania, USA.
3Pittsburgh Liver Research Center, University of Pittsburgh and University of Pittsburgh Medical Center, Pittsburgh, Pennsylvania, USA.
4Medical Scientist Training Program, University of Pittsburgh, Pittsburgh, Pennsylvania, USA.
5Heart Institute, UPMC Children’s Hospital of Pittsburgh, Department of Pediatrics, Pittsburgh, Pennsylvania, USA.
6UPMC Heart and Vascular Institute, Department of Medicine, Pittsburgh, Pennsylvania, USA.
7Department of Pathology, University of Pittsburgh, Pittsburgh, Pennsylvania, USA.
8Division of Cardiothoracic Surgery, Department of Surgery, and
9Center for Computational Immunogenetics and Drug Repurposing (CCIDR), Pediatric Transplant Surgery, University of Pittsburgh, Pennsylvania, USA.
10Division of Gastroenterology, Hepatology and Nutrition, Department of Medicine, University of Pittsburgh School of Medicine, Pittsburgh, Pennsylvania USA.
11Division of Cardiology, Department of Medicine, University of Pittsburgh, Pittsburgh, Pennsylvania, USA.
12RK Mellon Institute for Pediatric Research, Department of Pediatrics, Pittsburgh, Pennsylvania, USA.
Address correspondence to: Anita Saraf, John G. Rangos Sr. Research Center, #8122, 4401 Penn Ave, Pittsburgh, Pennsylvania 15224, USA. Phone: 412.864.2545; Email: saraf@pitt.edu.
Find articles by Liu, J. in: PubMed | Google Scholar
1Organ Pathobiology and Therapeutics Institute, and
2Department of Pharmacology and Chemical Biology, University of Pittsburgh School of Medicine, Pittsburgh, Pennsylvania, USA.
3Pittsburgh Liver Research Center, University of Pittsburgh and University of Pittsburgh Medical Center, Pittsburgh, Pennsylvania, USA.
4Medical Scientist Training Program, University of Pittsburgh, Pittsburgh, Pennsylvania, USA.
5Heart Institute, UPMC Children’s Hospital of Pittsburgh, Department of Pediatrics, Pittsburgh, Pennsylvania, USA.
6UPMC Heart and Vascular Institute, Department of Medicine, Pittsburgh, Pennsylvania, USA.
7Department of Pathology, University of Pittsburgh, Pittsburgh, Pennsylvania, USA.
8Division of Cardiothoracic Surgery, Department of Surgery, and
9Center for Computational Immunogenetics and Drug Repurposing (CCIDR), Pediatric Transplant Surgery, University of Pittsburgh, Pennsylvania, USA.
10Division of Gastroenterology, Hepatology and Nutrition, Department of Medicine, University of Pittsburgh School of Medicine, Pittsburgh, Pennsylvania USA.
11Division of Cardiology, Department of Medicine, University of Pittsburgh, Pittsburgh, Pennsylvania, USA.
12RK Mellon Institute for Pediatric Research, Department of Pediatrics, Pittsburgh, Pennsylvania, USA.
Address correspondence to: Anita Saraf, John G. Rangos Sr. Research Center, #8122, 4401 Penn Ave, Pittsburgh, Pennsylvania 15224, USA. Phone: 412.864.2545; Email: saraf@pitt.edu.
Find articles by Liu, S. in: PubMed | Google Scholar
1Organ Pathobiology and Therapeutics Institute, and
2Department of Pharmacology and Chemical Biology, University of Pittsburgh School of Medicine, Pittsburgh, Pennsylvania, USA.
3Pittsburgh Liver Research Center, University of Pittsburgh and University of Pittsburgh Medical Center, Pittsburgh, Pennsylvania, USA.
4Medical Scientist Training Program, University of Pittsburgh, Pittsburgh, Pennsylvania, USA.
5Heart Institute, UPMC Children’s Hospital of Pittsburgh, Department of Pediatrics, Pittsburgh, Pennsylvania, USA.
6UPMC Heart and Vascular Institute, Department of Medicine, Pittsburgh, Pennsylvania, USA.
7Department of Pathology, University of Pittsburgh, Pittsburgh, Pennsylvania, USA.
8Division of Cardiothoracic Surgery, Department of Surgery, and
9Center for Computational Immunogenetics and Drug Repurposing (CCIDR), Pediatric Transplant Surgery, University of Pittsburgh, Pennsylvania, USA.
10Division of Gastroenterology, Hepatology and Nutrition, Department of Medicine, University of Pittsburgh School of Medicine, Pittsburgh, Pennsylvania USA.
11Division of Cardiology, Department of Medicine, University of Pittsburgh, Pittsburgh, Pennsylvania, USA.
12RK Mellon Institute for Pediatric Research, Department of Pediatrics, Pittsburgh, Pennsylvania, USA.
Address correspondence to: Anita Saraf, John G. Rangos Sr. Research Center, #8122, 4401 Penn Ave, Pittsburgh, Pennsylvania 15224, USA. Phone: 412.864.2545; Email: saraf@pitt.edu.
Find articles by Gestrich, C. in: PubMed | Google Scholar
1Organ Pathobiology and Therapeutics Institute, and
2Department of Pharmacology and Chemical Biology, University of Pittsburgh School of Medicine, Pittsburgh, Pennsylvania, USA.
3Pittsburgh Liver Research Center, University of Pittsburgh and University of Pittsburgh Medical Center, Pittsburgh, Pennsylvania, USA.
4Medical Scientist Training Program, University of Pittsburgh, Pittsburgh, Pennsylvania, USA.
5Heart Institute, UPMC Children’s Hospital of Pittsburgh, Department of Pediatrics, Pittsburgh, Pennsylvania, USA.
6UPMC Heart and Vascular Institute, Department of Medicine, Pittsburgh, Pennsylvania, USA.
7Department of Pathology, University of Pittsburgh, Pittsburgh, Pennsylvania, USA.
8Division of Cardiothoracic Surgery, Department of Surgery, and
9Center for Computational Immunogenetics and Drug Repurposing (CCIDR), Pediatric Transplant Surgery, University of Pittsburgh, Pennsylvania, USA.
10Division of Gastroenterology, Hepatology and Nutrition, Department of Medicine, University of Pittsburgh School of Medicine, Pittsburgh, Pennsylvania USA.
11Division of Cardiology, Department of Medicine, University of Pittsburgh, Pittsburgh, Pennsylvania, USA.
12RK Mellon Institute for Pediatric Research, Department of Pediatrics, Pittsburgh, Pennsylvania, USA.
Address correspondence to: Anita Saraf, John G. Rangos Sr. Research Center, #8122, 4401 Penn Ave, Pittsburgh, Pennsylvania 15224, USA. Phone: 412.864.2545; Email: saraf@pitt.edu.
Find articles by Morell, V. in: PubMed | Google Scholar
1Organ Pathobiology and Therapeutics Institute, and
2Department of Pharmacology and Chemical Biology, University of Pittsburgh School of Medicine, Pittsburgh, Pennsylvania, USA.
3Pittsburgh Liver Research Center, University of Pittsburgh and University of Pittsburgh Medical Center, Pittsburgh, Pennsylvania, USA.
4Medical Scientist Training Program, University of Pittsburgh, Pittsburgh, Pennsylvania, USA.
5Heart Institute, UPMC Children’s Hospital of Pittsburgh, Department of Pediatrics, Pittsburgh, Pennsylvania, USA.
6UPMC Heart and Vascular Institute, Department of Medicine, Pittsburgh, Pennsylvania, USA.
7Department of Pathology, University of Pittsburgh, Pittsburgh, Pennsylvania, USA.
8Division of Cardiothoracic Surgery, Department of Surgery, and
9Center for Computational Immunogenetics and Drug Repurposing (CCIDR), Pediatric Transplant Surgery, University of Pittsburgh, Pennsylvania, USA.
10Division of Gastroenterology, Hepatology and Nutrition, Department of Medicine, University of Pittsburgh School of Medicine, Pittsburgh, Pennsylvania USA.
11Division of Cardiology, Department of Medicine, University of Pittsburgh, Pittsburgh, Pennsylvania, USA.
12RK Mellon Institute for Pediatric Research, Department of Pediatrics, Pittsburgh, Pennsylvania, USA.
Address correspondence to: Anita Saraf, John G. Rangos Sr. Research Center, #8122, 4401 Penn Ave, Pittsburgh, Pennsylvania 15224, USA. Phone: 412.864.2545; Email: saraf@pitt.edu.
Find articles by Sindhi, R. in: PubMed | Google Scholar
1Organ Pathobiology and Therapeutics Institute, and
2Department of Pharmacology and Chemical Biology, University of Pittsburgh School of Medicine, Pittsburgh, Pennsylvania, USA.
3Pittsburgh Liver Research Center, University of Pittsburgh and University of Pittsburgh Medical Center, Pittsburgh, Pennsylvania, USA.
4Medical Scientist Training Program, University of Pittsburgh, Pittsburgh, Pennsylvania, USA.
5Heart Institute, UPMC Children’s Hospital of Pittsburgh, Department of Pediatrics, Pittsburgh, Pennsylvania, USA.
6UPMC Heart and Vascular Institute, Department of Medicine, Pittsburgh, Pennsylvania, USA.
7Department of Pathology, University of Pittsburgh, Pittsburgh, Pennsylvania, USA.
8Division of Cardiothoracic Surgery, Department of Surgery, and
9Center for Computational Immunogenetics and Drug Repurposing (CCIDR), Pediatric Transplant Surgery, University of Pittsburgh, Pennsylvania, USA.
10Division of Gastroenterology, Hepatology and Nutrition, Department of Medicine, University of Pittsburgh School of Medicine, Pittsburgh, Pennsylvania USA.
11Division of Cardiology, Department of Medicine, University of Pittsburgh, Pittsburgh, Pennsylvania, USA.
12RK Mellon Institute for Pediatric Research, Department of Pediatrics, Pittsburgh, Pennsylvania, USA.
Address correspondence to: Anita Saraf, John G. Rangos Sr. Research Center, #8122, 4401 Penn Ave, Pittsburgh, Pennsylvania 15224, USA. Phone: 412.864.2545; Email: saraf@pitt.edu.
Find articles by Monga, S. in: PubMed | Google Scholar
1Organ Pathobiology and Therapeutics Institute, and
2Department of Pharmacology and Chemical Biology, University of Pittsburgh School of Medicine, Pittsburgh, Pennsylvania, USA.
3Pittsburgh Liver Research Center, University of Pittsburgh and University of Pittsburgh Medical Center, Pittsburgh, Pennsylvania, USA.
4Medical Scientist Training Program, University of Pittsburgh, Pittsburgh, Pennsylvania, USA.
5Heart Institute, UPMC Children’s Hospital of Pittsburgh, Department of Pediatrics, Pittsburgh, Pennsylvania, USA.
6UPMC Heart and Vascular Institute, Department of Medicine, Pittsburgh, Pennsylvania, USA.
7Department of Pathology, University of Pittsburgh, Pittsburgh, Pennsylvania, USA.
8Division of Cardiothoracic Surgery, Department of Surgery, and
9Center for Computational Immunogenetics and Drug Repurposing (CCIDR), Pediatric Transplant Surgery, University of Pittsburgh, Pennsylvania, USA.
10Division of Gastroenterology, Hepatology and Nutrition, Department of Medicine, University of Pittsburgh School of Medicine, Pittsburgh, Pennsylvania USA.
11Division of Cardiology, Department of Medicine, University of Pittsburgh, Pittsburgh, Pennsylvania, USA.
12RK Mellon Institute for Pediatric Research, Department of Pediatrics, Pittsburgh, Pennsylvania, USA.
Address correspondence to: Anita Saraf, John G. Rangos Sr. Research Center, #8122, 4401 Penn Ave, Pittsburgh, Pennsylvania 15224, USA. Phone: 412.864.2545; Email: saraf@pitt.edu.
Find articles by Saraf, A. in: PubMed | Google Scholar
Published February 24, 2026 - More info
JCI Insight. 2026;11(13):e198823. https://doi.org/10.1172/jci.insight.198823.
© 2026 Lehrich et al. This work is licensed under the Creative Commons Attribution 4.0 International License. To view a copy of this license, visit http://creativecommons.org/licenses/by/4.0/.
Received: August 5, 2025; Accepted: February 17, 2026


-
Results
A single-cell spatial transcriptomic atlas of human FALD with early and advanced fibrosis. Recent work has described intrahepatic biological differences underlying early and advanced fibrosis in FALD (11). Compared with FALD patients with early fibrosis, FALD patients with advanced fibrosis upregulate pathways associated with inflammation, angiogenesis, and hepatic congestion (11). However, the cellular composition, cell-to-cell interactions, and cellular spatial localization in FALD across varying degrees of fibrosis remains largely unknown. Here, through screening of liver explant tissues available from the FALD patients at the University of Pittsburgh Medical Center (UPMC), we aimed to develop a single-cell spatial transcriptomic atlas using the CosMx SMI platform with in situ hybridization of 6175 genes (Figure 1A). We identified 2 patients, one with early fibrosis (59 years old) and one with advanced fibrosis (21 years old) (Supplemental Figure 1, A–C; supplemental material available online with this article; https://doi.org/10.1172/jci.insight.198823DS1). The control biopsy sample was obtained, before perfusion, from a 4-year-old identified for liver donation with a congestive hepatic fibrosis (CHF) score of 0. After cell segmentation, assessment of quality control metrics, and data integration across pathologies, cells with high-quality reads (60,339 for control and 291,840 for FALD) were utilized for downstream analyses.
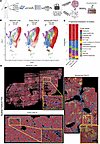 Figure 1
Single-cell spatial transcriptomic atlas of human FALD with early and advanced fibrosis. (A) Schematic diagram of workflow to develop single-cell spatial transcriptomic atlas of human FALD and data analysis pipeline. Figure created in BioRender. (B) Uniform manifold approximation and projection (UMAP) split by disease pathology across all annotated cell types. (C) Stacked bar plot indicating relative cell type proportions across the whole dataset by disease pathology colored by cell type annotation. (D) Spatial feature plots of all annotated cell types directly on sequenced tissue section by disease pathology.
We utilized the Harmony data integration algorithm (12) to integrate the cellular spatial transcriptomes of the normal liver along with the early and advanced FALD livers (Supplemental Figure 2A). We then performed unbiased dimensionality reduction and clustering on all 352,179 cells, which resulted in 12 annotated cell types: hepatocytes, hepatic stellate cells (HSCs), endothelial cells, macrophages, NK/T cells, “zonally ambiguous and stressed hepatocytes,” cholangiocytes, centrilobular hepatocytes, erythroid cells, B cells, mast cells, and undefined hepatocytes (Supplemental Figure 2, B and C), based on previously reported marker genes (13). The number of genes and detected transcripts was similar across the cell clusters (Supplemental Figure 2, D and E). Each of these cell types had distinct gene expression signatures, which defined their identity following differential gene expression per cell cluster (Supplemental Figure 3A and Supplemental Figure 4A). Cell type composition differed between normal liver, early, and advanced FALD (Figure 1B and Supplemental Figure 3B). Notably, centrilobular hepatocytes, characterized by high expression of GLUL, CYP2E1, OAT, and AXIN2, decreased in number as the disease progressed, becoming nearly nonexistent in advanced FALD. Additionally, HSCs, defined by high expression of TAGLN, COL6A2, and DCN, expanded in advanced FALD (Figure 1C). Spatial plots corroborated these findings, where central veins were lined by HSCs in early FALD, which further expanded in advanced FALD (Figure 1D). Further analysis showed an increasing population of HSCs with myofibroblast phenotype with a relative decrease in quiescent HSCs in advanced FALD (Supplemental Figure 5A). Upregulated markers associated with these distinct cellular subtypes are illustrated in Supplemental Figure 5, B and C. Additionally, the normal liver architecture with identifiable portal triads was no longer present, with the appearance of hepatic nodules within cirrhotic areas (Figure 1D). Thus, advanced fibrosis in FALD is characterized by increases in HSCs surrounding central veins.
A subset of hepatocytes are both zonally ambiguous and stressed and distributed across the entire lobule in advanced FALD. From our cell type proportion analyses, a unique population of hepatocytes emerged and was enriched 4-fold in advanced FALD compared with both normal liver and early FALD (Figure 1C and Supplemental Figure 3B). To gain further insights, we investigated their unique transcriptomic profile to glean potential functional perspective. First, these hepatocytes in advanced FALD were enriched in markers of classical stress response pathways, characterized by increased expression of HSPA1B, HSPH1, HSPA1A, JUN, and ATF3 (Supplemental Figure 4A). Hence, these hepatocytes were “stressed.” Furthermore, gene set enrichment analysis (GSEA) using Gene Ontology (GO) pathways comparing these cells to all other annotated cell types revealed significant enrichment of “GO: Response to Topologically Incorrect Protein” (normalized enrichment score [NES]: 2.66, P < 0.001) and ‘GO: Cellular Response to Unfolded Protein’ (NES: 2.44, P < 0.001) pathways (Figure 2A and Supplemental Figure 6, A and B). Additionally, GSEA using hallmark pathways comparing these unique “stressed hepatocytes” to all other annotated cell types revealed significant enrichment of “Hallmark: TNFA Signaling via NFKB” (NES: 2.01, P < 0.001) and “Hallmark: Reactive Oxygen Species” (NES: 1.56, P = 0.03) pathways (Supplemental Figure 6, C–E). Given the association between the unfolded protein response, inflammation, and oxidative stress with cellular senescence, we next investigated whether this hepatocyte subpopulation showed upregulation of various senescence markers (14). Interestingly, this subpopulation showed increased expression of CDKN1A and SPI1 (Supplemental Figure 7A), along with increased expression of various senescence-associated secretory phenotype (SASP) markers, including CXCL1, CXCL2, CXCL8, CCL4, GDF15, ICAM1, SERPINE1, and TIMP1 (Figure 2B and Supplemental Figure 7B), as compared with other hepatocyte subpopulations. As compared with healthy control and early FALD, CXCL1, CXCL2, CXCL8, CCL4, GDF15, ICAM1, and TNF were upregulated in advanced FALD (Supplemental Figure 7C). Next, to ascertain potential drivers of this senescence-like phenotype, we performed an upstream regulator analysis (Qiagen) on the differentially expressed genes (DEGs) (log2FC > 0.5, P < 0.05) from the “stressed hepatocyte” population, which identified that top kinases upstream of these genes were predicted to be MAP3K8, RAF1, MAPK3, IKBKB, and JAK1, which are all previously known to induce a senescence-like cellular state (Figure 2C) (15–18).
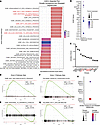 Figure 2
Characterization of zonally ambiguous and stressed hepatocytes demonstrates markers of cellular stress, senescence, and liver zonation. (A) Waterfall plot of top 10 upregulated and downregulated Gene Ontology (GO) pathways by normalized enrichment score (NES) and adjusted P value. (B) Dot plot illustrating expression of various senescence-associated secretory phenotype marker genes. (C) Waterfall plot of top kinases predicted to be activated based on differentially expressed genes. (D) Gene set enrichment analysis (GSEA) running enrichment score plot for “GO: Bile Acid Biosynthetic Process.” (E) GSEA running enrichment score plot for “GO: Response to Xenobiotic Stimulus.” (F) GSEA running enrichment score plot for Hallmark pathway “Oxidative Phosphorylation.” (G) GSEA running enrichment score plot for Hallmark pathway “Fatty Acid Metabolism.” (H) Dot plot illustrating expression of zone 1, zone 2, and zone 3 gene expression modules in zonally ambiguous and stressed hepatocytes. Zone 1 genes: FBP1, VTN, PIGR, ASS1, ARG1, PCK1, and SDS. Zone 2 genes: HAMP, TERT, and CCND1. Zone 3 genes: HMGCS2, CYP2E1, OAT, RGN, TBX3, AXIN2, CYP8B1, and COBLL1.
In normal liver, hepatocytes maintain a distinct pattern of compartmentalized gene expression where hepatocytes in distinct areas of the hepatic lobule perform specific functions, a phenomenon termed “liver zonation” (19). Specifically, hepatocytes in the periportal region (zone 1) perform key tasks such as gluconeogenesis, mitochondrial fatty acid β-oxidation, and ureagenesis, while hepatocytes in the pericentral region (zone 3) perform key tasks such as xenobiotic metabolism, bile acid metabolism, glycolysis, lipogenesis, peroxisomal fatty acid β-oxidation, and glutamine synthesis (20). In this manner, the liver is able to compartmentalize its functions and be efficient in performing multiple eclectic functions. Interestingly, in advanced FALD, the identified “stressed hepatocytes” were present across the entire lobule (Figure 1D). Thus, we hypothesized that given their pan-zonal distribution, these “stressed hepatocytes” likely dually express genes that are traditionally expressed solely in pericentral (zone 3) or periportal (zone 1) zones. Indeed, GSEA with GO and Hallmark pathways revealed significant enrichment of “GO: Bile Acid Biosynthetic Process” (NES: 1.87, P = 0.02), “GO: Glucose Metabolic Process” (NES: 1.80, P = 0.002), “GO: Response to Xenobiotic Stimulus” (NES: 1.44, P = 0.02), “Hallmark: Xenobiotic Metabolism” (NES: 2.31, P < 0.001), “Hallmark: Bile Acid Metabolism” (NES: 2.10, P < 0.001), and “Hallmark: MTORC1 Signaling” (NES: 1.38, P = 0.03) pathways, which are all canonical features of pericentral (zone 3) hepatocyte metabolism (20, 21). Additionally, GSEA with GO and Hallmark pathways revealed significant enrichment of “Hallmark: Oxidative Phosphorylation” (NES: 2.73, P < 0.001) and “Hallmark: Fatty Acid β-oxidation” (NES: 2.32, P < 0.001) pathways, which are canonical features of periportal (zone 1) hepatocyte metabolism (Figure 2, D–G). Additionally, gene expression module scores for zone 1 (FBP1, VTN, PIGR, ASS1, ARG1, PCK1, and SDS), zone 2 (HAMP, TERT, and CCND1), and zone 3 genes (HMGCS2, CYP2E1, OAT, RGN, TBX3, AXIN2, CYP8B1, and COBLL1) demonstrated enrichment of both zone 1 and zone 3 gene sets (Figure 2H). Overall, this analysis suggested these hepatocytes to be zonally ambiguous in their gene expression. Hence, we now annotate these hepatocytes that are both stressed and zonally misplaced in their gene expression profile and likely in their function as “zonally ambiguous and stressed hepatocytes” (Figure 2, D–G). The set of genes associated with these zonally ambiguous and stressed hepatocytes was upregulated as compared with other hepatocytes and parenchymal cell populations (Supplemental Figure 7D) and only observed in advanced FALD (Supplemental Figure 7E).
In summary, a hepatocyte population with both features of cellular stress and zonally mismatched gene expression is evident across the hepatic lobule in advanced FALD and may be contributing to hepatic dysfunction, representing maladaptation due to chronic insult evident in FALD disease progression.
Liver zonation is disrupted in advanced FALD. Next, to address hepatocyte gene expression and maladaptation more comprehensively in FALD, we performed further subclustering on the 3 original hepatocyte clusters, “centrilobular hepatocytes,” “zonally ambiguous and stressed hepatocytes,” and “hepatocytes,” identified in Figure 1B. We identified 6 unique hepatocyte populations consisting of periportal, mid-zonal, centrilobular, dedifferentiating, dedifferentiated, and zonally ambiguous and stressed hepatocytes (Figure 3A). Dedifferentiating and dedifferentiated hepatocytes were both defined by upregulation of pathways relating to epithelial-mesenchymal transition, Hedgehog signaling, and Notch signaling (Supplemental Figure 8, A and B), while dedifferentiated hepatocytes also uniquely expressed VIM, LGR5, ACTL6A, and MCM5, implying a more progenitor/stem-like hepatocyte phenotype, and concomitantly displaying downregulation of canonical zonation markers, CYP2E1 and ASS1 (Supplemental Figure 9) (22–24). Although the proportion of dedifferentiating hepatocytes was relatively stable across normal liver, early, and advanced FALD, the proportion of dedifferentiated hepatocytes increased in advanced FALD (Figure 3B). Additionally, pseudotime ordering revealed that centrilobular and periportal hepatocytes were the root node of the trajectory, with the lowest pseudotime values, reflecting their transcriptionally stable, mature, and functionally compartmentalized zonal states (Figure 3C). From these 2 endpoints, increasing pseudotime ordering captured a progressive loss of hepatic zonal identity, with emergence of a stress-adaptive, zonally ambiguous transcriptional program along the trajectory (Figure 3C). This continuum ultimately converged on dedifferentiating and fully dedifferentiated hepatocyte populations, which had the highest pseudotime values, minimal hepatocyte zonal identity, and upregulation of a progenitor/stem-like gene program (Figure 3C). Overall, this observation suggests that the 2 mature zonal hepatocyte states dedifferentiate toward a progenitor-like endpoint as part of maladaptive response during chronic liver injury.
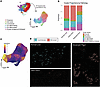 Figure 3
Liver hepatocyte zonation is disrupted in FALD. (A) Uniform manifold approximation and projection (UMAP) showing each hepatocyte subpopulation following subclustering of 3 hepatocyte populations: hepatocytes, centrilobular hepatocytes, and zonally ambiguous and stressed hepatocytes. (B) Stacked bar plot showing cluster proportions of hepatocyte subpopulations per disease pathology. (C) Pseudotime analysis of hepatocyte subpopulations in FALD. (D) Spatial plots of normal liver, FALD with early fibrosis, and FALD with advanced fibrosis for centrilobular and mid-zonal hepatocytes.
Interestingly, a key difference in overall hepatocyte zonation between early and advanced FALD was the expansion of mid-zonal (zone 2) hepatocytes, indicated by high expression of HAMP in this cell population (Figure 3B and Supplemental Figure 9A). In a normal liver, mid-zonal hepatocytes were represented by a few layers in between the central vein and the portal vein (Figure 3D). This was largely recapitulated in early FALD as well. However, in advanced FALD, mid-zonal hepatocytes expanded (Figure 3D), likely in response to chronic liver injury, as these hepatocytes are known to maintain liver homeostasis (25). Overall, as FALD progressed, we observed a notable change in hepatocyte zonal gene expression across the entire hepatic lobule, evidenced by loss of periportal and centrilobular hepatocytes, and appearance of de novo clusters including the zonally ambiguous and stressed hepatocytes and the expansion of mid-zonal hepatocytes. While it is unclear whether these adaptations are compensatory, and thus an attempt to maintain function, elucidating cellular and molecular basis driving these changes is highly relevant.
Endothelial cell zonation is disrupted in advanced FALD. Given the pan-zonal distribution of zonally ambiguous and stressed hepatocyte subpopulation, we were next interested in determining how these cells physically located in zone 1 were exhibiting gene expression (and in turn pathways) that are normally evident in zone 3 hepatocytes. Compared with zones 1 and 2, the major driver of zone 3 hepatocyte gene expression and function has been carefully dissected with a fundamental role of the Wnt/β-catenin signaling in this process (20). In fact, Wnts secreted from zone 3 endothelial cells, specifically Wnt2 and Wnt9b, directly control zonation via paracrine β-catenin activation (19). Knowing the key relevance of endothelial cells in the process of hepatocyte gene expression, especially in zone 3, we next subclustered the endothelial cells into zone 1 and zone 3 subpopulations using previously published marker genes (13). We then annotated these cell types in the larger CosMx dataset (Figure 4, A–C), based on gene expression module scores for zone 1 and zone 3 endothelial cells. Zone 1 endothelial cells showed increased expression of VWF and SPARCL1, while zone 3 endothelial cells showed increased expression of RAMP3 and RELN, which are known markers for each of these subpopulations (Figure 4, D and E) (26). Next, we performed GSEA with GO and Hallmark pathway sets for zone 1 and zone 3 endothelial cells to infer their biological significance. Interestingly, despite both endothelial cell populations demonstrating upregulation of the hypoxia pathways, zone 1 endothelial cells demonstrated upregulation of endothelial cell migration pathways (Supplemental Figure 10, A–D). Furthermore, to corroborate this, spatial plots of centrilobular hepatocytes and zone 1 and 3 endothelial cells demonstrated that in normal liver, zone 3 endothelial cells surround the central veins, while in FALD with advanced fibrosis, zone 1 endothelial cells expanded and lacked a clearly defined zonation pattern (Supplemental Figure 11A). Overall, in advanced FALD, endothelial cells lose their spatial patterning.
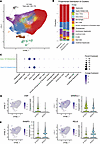 Figure 4
Liver endothelial cell zonation is disrupted in FALD. (A) Uniform manifold approximation and projection (UMAP) showing zone 1 and zone 3 endothelial cells. (B) Stacked bar plot showing relative proportions of zone 1 and zone 3 endothelial cells in FALD. (C) Dot plot showing expression of zone 1 and zone 3 endothelial cell gene expression module scores across the different cell types (module score: using the normal liver cell atlas, top 25 differentially expressed genes were selected for each endothelial cell subtype). (D) Feature and violin plots of zone 1 endothelial cells marker genes. (E) Feature and violin plots of zone 3 endothelial cells marker genes.
Ectopic WNT2 from periportal endothelial cells facilitates zone 3 hepatocyte gene expression across the hepatic lobule in FALD. Next, we hypothesized that cell-to-cell Wnt signaling was likely altered due to both an observed increase in zone 1 endothelial cells in the pericentral region, along with the presence of zonally ambiguous and stressed hepatocytes expressing zone 3 (pericentral) genes near zone 1 (or the periportal region). Thus, using CellChat (27) analysis on the CosMx dataset, we investigated global changes in Wnt signaling in FALD. Interestingly, across the entire dataset, endothelial cells (both zone 1 and zone 3) had the highest communication probability of Wnt signals to the zonally ambiguous and stressed hepatocytes (Supplemental Figure 12A). Additionally, when segregating out the cell-to-cell communication by disease pathology, zone 1 endothelial cell Wnt signals showed increased communication probability from normal liver to advanced FALD (Figure 5A). Next, using CellChat, we investigated which WNT-FZD/LRP interaction had the highest probability for communication. Across the entire dataset, WNT3A, WNT4, and WNT2 showed the highest relative contribution among all WNTs (Supplemental Figure 13A). Of these 3 WNTs, WNT2 (along with WNT9B) from the zone 3 endothelial cells has been conclusively identified as facilitating zone 3 (pericentral) hepatocyte gene expression and downstream functions (19). Interestingly, WNT2 expression was observed from both zone 3 and zone 1 endothelial cells across the entire dataset in advanced FALD (Supplemental Figure 13B). In normal liver, WNT2 is only expressed in zone 3 endothelial cells, but in FALD, WNT2 expression originates from zone 1 endothelial cells as well (Supplemental Figure 12, B and C). Further analysis revealed that WNT2 from both zone 1 and zone 3 endothelial cells communicates with zonally ambiguous and stressed hepatocytes via FZD5/LRP5/6 (Figure 5, B and C). Lastly, we quantified this WNT2 expression increase from zone 1 endothelial cells and observed an increased gradient of WNT2 expression from zone 1 endothelial cells in normal liver to FALD with early and advanced fibrosis (Figure 5D and Supplemental Figure 13C). Thus, we identified a putative cell signaling circuit whereby ectopic expression of WNT2 from zone 1 endothelial cells facilitates pericentral hepatocyte gene expression (and likely downstream functions) in zonally ambiguous and stressed hepatocytes within the periportal region via a WNT2/FZD5/LRP5/6 axis.
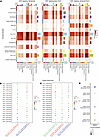 Figure 5
Periportal (zone 1) endothelial cell to zonally ambiguous and stressed hepatocyte crosstalk via WNT2/FZD5/LRP5/6 axis identified via CellChat. (A) Heatmap of cellular communication for WNT signaling by disease pathology. (B) Bubble plot of WNT/FZD signaling between zone 1 endothelial cells and zonally ambiguous and stressed hepatocytes across disease pathology. (C) Bubble plot of WNT/FZD signaling between zone 3 endothelial cells and zonally ambiguous and stressed hepatocytes across disease pathology. (D) Dot plot of WNT2 across zone 1 and zone 3 endothelial cells and disease pathology in the CosMx dataset.
Zonally ambiguous and stressed hepatocytes are enriched in end-stage liver disease. Lastly, we were interested in whether our findings were unique to FALD or shared among other progressive and chronic liver diseases. We analyzed a previously published single-nucleus RNA-seq dataset (GSE202379), which contained single-cell transcriptomes from normal adult liver, metabolic dysfunction–associated steatotic liver disease (MASLD), MASH with and without cirrhosis, and end-stage liver disease (Supplemental Figure 14, A and B). Interestingly, a subset of hepatocytes in end-stage liver disease patients had increased expression of the zonally ambiguous and stressed hepatocyte marker genes HSPA1B, HSPH1, HSPA1A, JUN, FOS, and ATF3 (Supplemental Figure 14C). Moreover, end-stage liver disease patients had increased expression of a gene module score based on DEGs from zonally ambiguous and stressed hepatocytes (Supplemental Figure 14D). The transcriptomics dataset also demonstrated a similar increase in HSP70 module score expression in end-stage liver disease, without significant upregulation in other samples of MASLD and MASH (Supplemental Figure 14D). While the HSP70 module score and contributing subunits were upregulated, albeit to a lesser degree in the healthy control samples (Supplemental Figure 14E), we are limited in providing a clinical correlation to this upregulation, as the study did not provide a clinical description of the “healthy control specimens.” Moreover, analogous to our endothelial cell analysis in FALD (Figure 4A), we subclustered the endothelial cells in this MASLD/MASH dataset as well. Similarly, we observed WNT2 upregulation in zone 1 endothelial cells in end-stage liver disease patients compared with healthy controls (Supplemental Figure 15, A and B), thereby indicating a significant overlap in pathophysiology at the end stage of multiple etiologies of metabolic liver diseases.
Thus, zonally ambiguous and stressed hepatocytes may be a feature of end-stage liver disease shared across multiple etiologies, but may be driven by mechanisms distinct to each underlying disease process.
HSP70 correlated with the CHF score in FALD. Immunofluorescent staining of zonation markers CYP2E1 (zone 3) and ASS1 (zone 1) confirmed the disruption of zonation at a protein level, as indicated by our spatial transcriptomic data (Figure 6, A and B, and Supplemental Figure 16). The CHF score was used to determine the extent of fibrosis in FALD clinical samples stained with H&E and trichrome staining, as this has been previously validated in FALD (28). Samples with CHF scores of 0–2 were classified as early FALD according to the following: 0, no fibrosis; 1, central zone fibrosis; 2A, central zone and mild portal fibrosis with accentuation at central zone; 2B, at least moderate portal fibrosis and central zone fibrosis, with accentuation at portal zone. CHF scores of 3 and 4 were classified as advanced FALD, where 3 indicates bridging fibrosis and 4 cirrhosis. Uniquely, a liver biopsy specimen obtained from a FALD patient with a CHF score of 0 showed relatively preserved hepatic lobule architecture, with minimal expansion of zone 1 and zone 3 markers. The majority of liver biopsy specimens obtained from FALD patients with CHF scores 1–4 showed abnormal zonation with unorganized CYP2E1 (zone 3) and ASS1 (zone 1) distribution. Interestingly, advanced FALD samples (CHF scores 3 and 4) had a significant increase in HSP70 expression. Interestingly, in FALD, HSP70 was expressed within the hepatic parenchyma, as compared with localization primarily to bile ducts in normal liver specimens (Figure 6, A and B). Indeed, correlational analysis showed that CHF score positively correlated with time of Fontan duration (Spearman’s r = 0.57, P = 0.04) (Figure 6B). Lastly, CHF score strongly correlated with HSP70 tissue area expression (Spearman’s r = 0.66, P = 0.005) (Figure 6C) and a trend toward increased HSP70 expression with disease pathology (early vs. advanced FALD; P = 0.09) (Figure 6D).
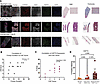 Figure 6
Immunofluorescence of hepatocyte zonation markers and HSP70 demonstrates altered zonation and increased cellular stress in advanced FALD. (A) Normal liver sample: Liver tissue obtained from a healthy control shows pericentral distribution of zone 3 marker CYP2E1, periportal distribution of ASS1, and minimal expression of HSP70 in liver parenchyma. Early FALD: Liver biopsy tissue obtained from a Fontan patient with a CHF score of 0 shows relatively preserved hepatic lobule architecture, but expansion of zone 1 and zone 3 markers as well as an increase of pericentral HSP70 expression. Advanced FALD: Liver biopsy tissue obtained from a patient with CHF score of 3, shows abnormal zonation with unorganized CYP2E1 and ASS1 distribution and an increase in HSP70 expression in liver parenchyma. Scale bar: 7.5 μm. Inset: ×200. H&E and trichrome: ×200. (B) Congestive hepatic fibrosis (CHF) score correlation with Fontan duration in FALD patients. (C) CHF score correlation with HSP70 expression in FALD patients. (D) Percentage positive HSP70 staining by disease pathology. Differences between groups (P values shown on top) were assessed using 1-way ANOVA followed by Tukey’s multiple-comparison test.


