
Research ArticleImmunologyNephrology
Open Access |  10.1172/jci.insight.201877
Interferon regulatory factor 5 in myeloid cells promotes obstructive nephropathy-induced renal fibrosis in vivo
Jia Wei,1 Gengyu Du,1 Zixia Li,1 Min Yang,2 Ting Chen,1 Zihao Xu,1 Zhen Yuan,3 Yidan Zheng,4 and Xiang Yan1
1Department of Urology and
2Department of Pathology, Children’s Hospital, Zhejiang University School of Medicine, National Clinical Research Center for Child Health, Hangzhou, China.
3Department of Cardiology, The First Affiliated Hospital, Zhejiang University School of Medicine, Hangzhou, China.
4Department of cardiovascular surgery, Union Hospital, Tongji Medical College, Huazhong University of Science and Technology, Wuhan, China.
Address correspondence to: Xiang Yan, Department of Urology, Children’s Hospital, Zhejiang University School of Medicine, National Clinical Research Center for Child Health, 3333 Binsheng Road, Binjiang District, Hangzhou 310052, China. Email: yanxiang@zju.edu.cn.
Authorship note: JW and GD have been designated as co–first authors.
Find articles by Wei, J. in: PubMed | Google Scholar
1Department of Urology and
2Department of Pathology, Children’s Hospital, Zhejiang University School of Medicine, National Clinical Research Center for Child Health, Hangzhou, China.
3Department of Cardiology, The First Affiliated Hospital, Zhejiang University School of Medicine, Hangzhou, China.
4Department of cardiovascular surgery, Union Hospital, Tongji Medical College, Huazhong University of Science and Technology, Wuhan, China.
Address correspondence to: Xiang Yan, Department of Urology, Children’s Hospital, Zhejiang University School of Medicine, National Clinical Research Center for Child Health, 3333 Binsheng Road, Binjiang District, Hangzhou 310052, China. Email: yanxiang@zju.edu.cn.
Authorship note: JW and GD have been designated as co–first authors.
Find articles by Du, G. in: PubMed | Google Scholar
1Department of Urology and
2Department of Pathology, Children’s Hospital, Zhejiang University School of Medicine, National Clinical Research Center for Child Health, Hangzhou, China.
3Department of Cardiology, The First Affiliated Hospital, Zhejiang University School of Medicine, Hangzhou, China.
4Department of cardiovascular surgery, Union Hospital, Tongji Medical College, Huazhong University of Science and Technology, Wuhan, China.
Address correspondence to: Xiang Yan, Department of Urology, Children’s Hospital, Zhejiang University School of Medicine, National Clinical Research Center for Child Health, 3333 Binsheng Road, Binjiang District, Hangzhou 310052, China. Email: yanxiang@zju.edu.cn.
Authorship note: JW and GD have been designated as co–first authors.
Find articles by Li, Z. in: PubMed | Google Scholar
1Department of Urology and
2Department of Pathology, Children’s Hospital, Zhejiang University School of Medicine, National Clinical Research Center for Child Health, Hangzhou, China.
3Department of Cardiology, The First Affiliated Hospital, Zhejiang University School of Medicine, Hangzhou, China.
4Department of cardiovascular surgery, Union Hospital, Tongji Medical College, Huazhong University of Science and Technology, Wuhan, China.
Address correspondence to: Xiang Yan, Department of Urology, Children’s Hospital, Zhejiang University School of Medicine, National Clinical Research Center for Child Health, 3333 Binsheng Road, Binjiang District, Hangzhou 310052, China. Email: yanxiang@zju.edu.cn.
Authorship note: JW and GD have been designated as co–first authors.
Find articles by Yang, M. in: PubMed | Google Scholar
1Department of Urology and
2Department of Pathology, Children’s Hospital, Zhejiang University School of Medicine, National Clinical Research Center for Child Health, Hangzhou, China.
3Department of Cardiology, The First Affiliated Hospital, Zhejiang University School of Medicine, Hangzhou, China.
4Department of cardiovascular surgery, Union Hospital, Tongji Medical College, Huazhong University of Science and Technology, Wuhan, China.
Address correspondence to: Xiang Yan, Department of Urology, Children’s Hospital, Zhejiang University School of Medicine, National Clinical Research Center for Child Health, 3333 Binsheng Road, Binjiang District, Hangzhou 310052, China. Email: yanxiang@zju.edu.cn.
Authorship note: JW and GD have been designated as co–first authors.
Find articles by Chen, T. in: PubMed | Google Scholar
1Department of Urology and
2Department of Pathology, Children’s Hospital, Zhejiang University School of Medicine, National Clinical Research Center for Child Health, Hangzhou, China.
3Department of Cardiology, The First Affiliated Hospital, Zhejiang University School of Medicine, Hangzhou, China.
4Department of cardiovascular surgery, Union Hospital, Tongji Medical College, Huazhong University of Science and Technology, Wuhan, China.
Address correspondence to: Xiang Yan, Department of Urology, Children’s Hospital, Zhejiang University School of Medicine, National Clinical Research Center for Child Health, 3333 Binsheng Road, Binjiang District, Hangzhou 310052, China. Email: yanxiang@zju.edu.cn.
Authorship note: JW and GD have been designated as co–first authors.
Find articles by Xu, Z. in: PubMed | Google Scholar
1Department of Urology and
2Department of Pathology, Children’s Hospital, Zhejiang University School of Medicine, National Clinical Research Center for Child Health, Hangzhou, China.
3Department of Cardiology, The First Affiliated Hospital, Zhejiang University School of Medicine, Hangzhou, China.
4Department of cardiovascular surgery, Union Hospital, Tongji Medical College, Huazhong University of Science and Technology, Wuhan, China.
Address correspondence to: Xiang Yan, Department of Urology, Children’s Hospital, Zhejiang University School of Medicine, National Clinical Research Center for Child Health, 3333 Binsheng Road, Binjiang District, Hangzhou 310052, China. Email: yanxiang@zju.edu.cn.
Authorship note: JW and GD have been designated as co–first authors.
Find articles by Yuan, Z. in: PubMed | Google Scholar
1Department of Urology and
2Department of Pathology, Children’s Hospital, Zhejiang University School of Medicine, National Clinical Research Center for Child Health, Hangzhou, China.
3Department of Cardiology, The First Affiliated Hospital, Zhejiang University School of Medicine, Hangzhou, China.
4Department of cardiovascular surgery, Union Hospital, Tongji Medical College, Huazhong University of Science and Technology, Wuhan, China.
Address correspondence to: Xiang Yan, Department of Urology, Children’s Hospital, Zhejiang University School of Medicine, National Clinical Research Center for Child Health, 3333 Binsheng Road, Binjiang District, Hangzhou 310052, China. Email: yanxiang@zju.edu.cn.
Authorship note: JW and GD have been designated as co–first authors.
Find articles by Zheng, Y. in: PubMed | Google Scholar
1Department of Urology and
2Department of Pathology, Children’s Hospital, Zhejiang University School of Medicine, National Clinical Research Center for Child Health, Hangzhou, China.
3Department of Cardiology, The First Affiliated Hospital, Zhejiang University School of Medicine, Hangzhou, China.
4Department of cardiovascular surgery, Union Hospital, Tongji Medical College, Huazhong University of Science and Technology, Wuhan, China.
Address correspondence to: Xiang Yan, Department of Urology, Children’s Hospital, Zhejiang University School of Medicine, National Clinical Research Center for Child Health, 3333 Binsheng Road, Binjiang District, Hangzhou 310052, China. Email: yanxiang@zju.edu.cn.
Authorship note: JW and GD have been designated as co–first authors.
Find articles by Yan, X. in: PubMed | Google Scholar
Published August 6, 2026 - More info
JCI Insight. 2026;11(19):e201877. https://doi.org/10.1172/jci.insight.201877.
© 2026 Wei et al. This work is licensed under the Creative Commons Attribution 4.0 International License. To view a copy of this license, visit http://creativecommons.org/licenses/by/4.0/.
Received: October 30, 2025; Accepted: July 31, 2026


-
Results
The expression of IRF5 is significantly increased in the renal tissues of patients with obstructive nephropathy. To elucidate the role of IRF5 in renal fibrosis associated with obstructive nephropathy, a total of 42 renal tissue samples were enrolled in this study (Supplemental Table 1 and Supplemental Table 2; supplemental material available online with this article; https://doi.org/10.1172/jci.insight.201877DS1). IHC was employed to evaluate the expression of fibrosis markers α-SMA and Vimentin (VIM), along with IRF5, in kidney tissues with varying degrees of fibrosis. Positive areas of α-SMA and VIM increased along with the extent of fibrosis (Figure 1, A and B). The number of IRF5+ cells was also significantly increased in the fibrotic tissues, and its expression is positively correlated with the degree of fibrosis (Figure 1, A and B). The results of immunofluorescence costaining indicated that the expression of IRF5 and α-SMA was increased. Spearman correlation analysis further revealed a significant positive correlation between the number of IRF5+ cells and the percentage area of α-SMA (rs = 0.7941, P < 0.001) (Figure 1, C and D).
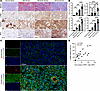 Figure 1
IRF5 was increased in human renal tissues with obstructive nephropathy. (A) Masson trichrome staining and IHC staining for α-SMA, VIM, and IRF5 in kidney tissues with varying degrees of fibrosis. Typical images and quantification are included. Arrows indicate strongly positive cells exhibiting macrophage-like nuclei under staining. Scale bars: 100 μm. (B) With the progression of fibrosis, collagen deposition, α-SMA+ and VIM+ areas gradually increased. Semiquantitative population of IRF5+ cells in kidneys with varying degrees of fibrosis. The number of IRF5+ cells increased in fibrotic tissues. (C and D) Representative images of immunofluorescence (IF) using IRF5 (red), α-SMA (green), and DAPI (blue) with normal kidney and fibrosis kidney. Scale bars: 50 μm. Spearman correlation analysis showed that the number of IRF5+ cells was significantly positively correlated with the expression of α-SMA (rs = 0.7941, P < 0.001). Data are expressed as the mean ± SD. Statistical comparisons among multiple groups were performed using 1-way ANOVA followed by Tukey’s post hoc test. n = 3–10. *P < 0.05; **P < 0.01; ***P < 0.001; ****P < 0.0001. HPF, high-power field.
IRF5 was significantly elevated in macrophages in kidneys from patients with obstructive nephropathy. Upon H&E staining, we detected large areas of densely packed, interstitial inflammatory cells in fibrotic areas. Higher infiltration of CD68+ macrophages, CD20+ B lymphocytes, and CD3+ T lymphocytes were also confirmed in the fibrotic tissues via IHC analysis (Figure 2, A and B). To clarify IRF5 localization within inflammatory cells, immunofluorescence was performed using IRF5, CD68 (macrophage marker), CD20 (B lymphocyte marker), and CD3 (T lymphocyte marker). The results showed that IRF5 was predominantly colocalized in CD68+ macrophages. In moderately to severely fibrotic tissues, a significantly higher percentage of IRF5+CD68+ cells were observed compared with IRF5+CD20+ and IRF5+CD3+ cells (Figure 2, C and D). Furthermore, we found that the ratio of IRF5+CD68+ cells to CD68+ cells was significantly elevated in fibrotic kidney tissue, and there was a strong positive correlation between the number of IRF5+CD68+ cells and α-SMA+ areas (rs = 0.8921, P < 0.001) (Figure 3, A and B).
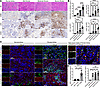 Figure 2
Elevated IRF5+CD68+ cell counts in renal tissues of patients with obstructive nephropathy. (A and B) Histologic images of kidney sections with varying degrees of fibrosis stained with H&E and IHC staining for CD68, CD20, and CD3. Typical images and quantification are included. Scale bars: 100 μm. (C) Representative images of normal and fibrosis kidney immunofluorescence using IRF5 (red), CD68/CD20/CD3 (green), and DAPI (blue). Representative high-power insets images of fibrosis kidney immunofluorescence using IRF5 (red), CD68 (green), and DAPI (blue). Scale bars: 50 μm. White arrows indicated double positive cells (colocatable cells). Randomly selected 10 fields of each patient’s kidney under 400× magnification were scored for quantification. (D) Ratio of IRF5+ cells to double-positive cells and ratio of IRF5+CD68+ cells in kidney sections with varying degrees of fibrosis. Data are expressed as the mean ± SD. Statistical comparisons among multiple groups were performed using 1-way ANOVA followed by Tukey’s post hoc test. n = 3–10. *P < 0.05; **P < 0.01; ***P < 0.001; ****P < 0.0001. HPF, high-power field.
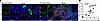 Figure 3
IRF5 localizes in macrophages and is associated with renal fibrosis. (A and B) Representative images of normal and fibrosis kidney immunofluorescence using IRF5 (yellow), CD68 (red), α-SMA (green), and DAPI (blue). Scale bars: 50 μm. The number of IRF5+CD68+ cells was significantly positively correlated with the α-SMA+ areas (rs = 0.8921, P < 0.001).
Macrophage IRF5 expression was significantly increased in the renal tissues of UUO mice. Unilateral ureteral obstruction (UUO) is a classic animal model of obstructive nephropathy (13). After 7 days of UUO in WT mice, the renal parenchyma in the UUO group was significantly thinner than that in the sham group (Supplemental Figure 1, A and B). H&E staining revealed tubular atrophy, epithelial cell apoptosis, and inflammatory cell infiltration following UUO. MTS showed the progression of renal fibrosis after UUO, with collagen primarily deposited around the glomeruli and tubule, localized in the corticomedullary junction (Supplemental Figure 1, C and D). IHC staining demonstrated a significant increase in α-SMA, VIM, and IRF5 expression in the obstructed kidneys (Supplemental Figure 1, E and F). Consistently, Acta2, Vim, and Irf5 mRNA levels were also significantly increased in renal tissues of UUO group as assessed by qPCR assay (Supplemental Figure 1G).
There was a significant increase in inflammatory cells, primarily CD68+ macrophages, in the obstructed kidneys after the UUO procedure. Moreover, IRF5 staining was localized to the same regions as CD68 staining, indicating localization of IRF5 expression to CD68+ macrophages. There was an increase in IRF5+CD68+ macrophages in the obstructed kidney after UUO. As expected, there was also a strong positive correlation between the number of IRF5+CD68+ cells and α-SMA+ areas in the obstructed kidneys (rs = 0.7623, P < 0.001) (Figure 4, A and B).
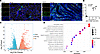 Figure 4
IRF5+CD68+ cell expression markedly increases in UUO mouse renal tissues. (A) Representative images of sham and UUO immunofluorescence using IRF5 (yellow), CD68 (red), α-SMA (green), and DAPI (blue). Scale bars: 50 μm. (B) The number of IRF5+CD68+ cells was significantly positively correlated with the α-SMA+ areas (rs = 0.7623, P < 0.001). (C) Gene expression difference of WT sham and WT UUO mice. (D) Gene ontology (GO) enrichment analysis of WT sham and WT UUO mice. The highly enriched categories include the extracellular matrix (ECM), external encapsulating structure, positive regulation of cytokine production, and regulation of lymphocyte activation.
We conducted RNA-seq on renal tissues from WT UUO and WT sham mice. Compared with the sham group, 2,726 genes were > 2-fold upregulated and 1,827 genes were > 2-fold downregulated in UUO kidneys (Figure 4C) (Supplemental Table 3). Gene ontology (GO) enrichment analysis of deferentially expressed genes showed highly enriched categories related to the ECM, external encapsulating structure, positive regulation of cytokine production, and regulation of lymphocyte activation (Figure 4D) (Supplemental Table 4).
Global deletion of Irf5 prevented UUO-induced renal fibrosis in vivo. To investigate our hypothesis, UUO was performed in WT mice and Irf5-KO (Irf5–/–) mice. Seven days after surgery, kidney tissue was collected for analysis. IRF5-KO efficiency in WT and KO mice was confirmed by Western blot analysis (Supplemental Figure 2A). MTS showed that total collagen deposition was significantly reduced in the obstructed kidneys of Irf5–/– mice compared with WT mice. An IHC assessment of α-SMA and VIM demonstrated a significant reduction in the α-SMA+ and VIM+ areas in the obstructed kidneys of Irf5–/– mice (Figure 5, A and B). Furthermore, the number of CD68+ cells was also significantly decreased (Figure 5, A and B). We then performed qPCR analysis of fibrosis-related indicators (Acta2 and Vim) and proinflammatory markers (Tnf-α, IL-6, and IL-1β) on the obstructed kidneys. Our results demonstrated that Acta2, Vim, Tnf-α, IL-6, and IL-1β levels significantly decreased in Irf5–/– mice (Figure 5, C and E). Expression of VIM and α-SMA protein further confirmed that renal fibrosis was more severe in the obstructed kidneys of WT mice (Figure 5, D and F). RNA-seq analysis also revealed that the differentially expressed genes were highly enriched in categories related to the ECM (Figure 6, A and B, and Supplemental Tables 5 and 6).
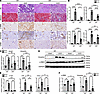 Figure 5
IRF5 KO mitigates inflammation and fibrosis in the UUO mouse model. (A) Representative H&E, masson staining, and IHC images of α-SMA, VIM, and CD68 of WT mice and Irf5–/– mice in sham group and UUO group. Scale bars: 50 μm. (B) Collagen deposition is increased in UUO-induced WT renal tissues yet decreased in Irf5–/– mice. VIM+α-SMA+ area was significantly upregulated in the UUO-induced WT renal tissues and downregulated in the Irf5–/– renal tissues. The number of CD68+ cells is markedly reduced in UUO-induced Irf5–/– renal tissues compared with WT renal tissues. (C) Renal mRNA expression of Acta2 and Vim in the indicated mouse groups were measured by qPCR. (D and F) Renal protein expression of α-SMA and VIM in the indicated mouse groups were measured by Western blot, the results were subjected to quantitative analysis. (E) Renal mRNA expression of Il-1β, Il-6, and Tnf-α in the indicated mouse groups were measured by qPCR. The mRNA expression level was reduced in the UUO-induced Irf5–/– renal tissues. Data are expressed as the mean ± SD. Statistical comparisons among multiple groups were performed using 1-way ANOVA followed by Tukey’s post hoc test. n = 3–9. *P < 0.05; **P < 0.01; ***P < 0.001; ****P < 0.0001.
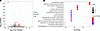 Figure 6
Irf5-KO mice display differential gene expression in RNA-seq analysis. (A) Gene expression difference of WT UUO and Irf5–/– UUO mice. (B) GO enrichment analysis of WT UUO and Irf5–/– UUO mice. The highly enriched categories include the extracellular matrix (ECM), external encapsulating structure, and renal system development.
Myeloid-specific Irf5 deficiency prevented UUO-induced renal fibrosis in vivo. Our data indicate that IRF5 was mainly induced in macrophages in kidneys of UUO group, and global Irf5 deletion prevents renal fibrosis induced by UUO, we further investigated whether Irf5 deletion in myeloid cells is able to suppress UUO-induced renal fibrosis as well. Western blot analysis demonstrated that IRF5 expression was significantly reduced in Irf5fl/flLyz2Cre UUO mice (Supplemental Figure 2B). H&E staining and MTS showed that renal fibrosis was markedly reduced in renal tissues of Irf5fl/flLyz2Cre UUO mice (Figure 7, A and B). IHC staining clarified the decrease of CD68+ cells in the obstructive kidney tissue between the Irf5fl/fl mice and Irf5fl/flLyz2Cre mice (Figure 8, A and B). The decreased expression of α-SMA and VIM in renal tissues of Irf5fl/flLyz2Cre UUO mice was verified by qPCR and WB (Figure 7, C–E). We also found both inflammatory cell infiltration and inflammatory factors were significantly decreased in renal tissues of Irf5fl/flLyz2Cre UUO mice, as demonstrated by qPCR and further validated at the protein level by WB (Figure 8, C and D).
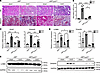 Figure 7
IRF5 deficiency in myeloid cells inhibits renal fibrosis in vivo. (A) Representative H&E and Masson staining images of Irf5fl/fl mice and Irf5fl/flLyz2Cre mice in sham-operated and 7 days after UUO. Scale bars: 50 μm. (B) Collagen deposition is augmented in UUO-induced Irf5fl/fl renal tissues yet diminished in Irf5fl/flLyz2Cre mice. (C) Renal Acta2 and Vim mRNA expression in the indicated mouse groups were measured by qPCR. (D and E) Renal α-SMA and VIM protein expression in the indicated mouse groups were measured by Western blot, the results were subjected to quantitative analysis. Data are expressed as the mean ± SD. Statistical comparisons among multiple groups were performed using 1-way ANOVA followed by Tukey’s post hoc test. n = 3–10. *P < 0.05; **P < 0.01; ***P < 0.001; ****P < 0.0001.
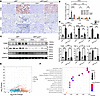 Figure 8
IRF5 deficiency in myeloid cells reduces renal inflammation in vivo. (A) IHC images of CD68 (macrophage marker), CD20 (B lymphocyte marker), and CD3 (T lymphocyte marker) of Irf5fl/fl mice and Irf5fl/flLyz2Cre mice in sham-operated and 7 days after UUO. Scale bars: 50 μm. (B) CD68+ macrophage numbers were markedly elevated in Irf5fl/fl UUO tissues yet significantly reduced in Irf5fl/flLyz2Cre UUO renal tissues (P < 0.05). (C and D) Renal protein expression of F4/80, IL-1β, TNF-α in the indicated mouse groups were measured by Western blot. Renal mRNA expression of Tnf-α, Il-1β, and Il-6 in the indicated mouse groups were measured by qPCR. (E) Gene expression difference of Irf5fl/fl UUO and Irf5fl/flLyz2Cre UUO mice. (F) GO enrichment analysis of Irf5fl/fl UUO and Irf5fl/flLyz2Cre UUO mice. The highly enriched categories include the extracellular matrix (ECM), external encapsulating structure, and epithelial cell proliferation. Data are expressed as the mean ± SD. Statistical comparisons among multiple groups were performed using 1-way ANOVA followed by Tukey’s post hoc test. n = 3–8. *P < 0.05; **P < 0.01; ***P < 0.001; ****P < 0.0001.
We next performed RNA-seq on renal fibrosis tissues from Irf5fl/flLyz2Cre UUO and Irf5fl/fl UUO mice. The differentially expressed genes were associated with immune response and ECM (Figure 8, E and F, and Supplemental Tables 7 and 8).
Myeloid-specific Irf5 deletion reduced MMP9 expression in kidneys of UUO mice. The RNA-Seq analysis further revealed that the most members of the matrix metalloproteinase (MMP) family were positively correlated with Irf5. Notably, Mmp9 showed the most substantial upregulation, with a log2 fold change (log2FC) of 3.37 from WT UUO and WT sham mice renal tissue (Supplemental Table 3). We further examined the expression of MMP9 from the sham and UUO groups of Irf5fl/fl and Irf5fl/flLyz2Cre mice using immunofluorescence (Figure 9A). The results showed that the number of MMP9+ cells in renal tissues of the Irf5fl/flLyz2Cre group was significantly fewer than in the Irf5fl/fl UUO group (Figure 9C). Consistently, the protein and mRNA levels of MMP9 were significantly lower in the renal tissues of Irf5fl/flLyz2Cre UUO mice compared with the Irf5fl/fl UUO mice (Figure 9, D–F). Furthermore, immunofluorescence results indicated that IRF5 and MMP9 colocalized in the tubulointerstitial regions of the Irf5fl/fl UUO mice. Additionally, the percentage of IRF5+MMP9+ cells among MMP9+ cells was significantly increased in renal tissues of the Irf5fl/fl UUO mice compared with Irf5fl/fl sham mice (Figure 9, B and C).
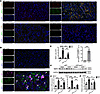 Figure 9
The regulatory effect of IRF5 on MMP9 expression in vivo. (A) Representative immunofluorescence images of MMP9 (green) and CD68 (red) expression in renal tissues from sham and UUO groups in Irf5fl/fl and Irf5fl/flLyz2Cre mice. Scale bars: 50 μm. (B) Representative immunofluorescence images of MMP9 (green) and IRF5 (red) expression in renal tissues from sham and UUO groups in Irf5fl/fl mice. White arrows indicate cells with obvious strong double-positive signals. Scale bars: 50 μm. (C) MMP9+ cell count in Irf5fl/flLyz2Cre UUO renal tissues was significantly lower than in Irf5fl/fl UUO group. The proportion of IRF5+MMP9+ cells within the MMP9+ cell was significantly higher in Irf5fl/fl UUO renal tissues than in sham group. (D) Renal MMP9 protein expression in Irf5fl/fl and Irf5fl/flLyz2Cre were measured by Western blot. MMP9 protein expression was markedly reduced in Irf5fl/flLyz2Cre UUO mice renal tissues versus Irf5fl/fl UUO controls. (E) Renal Mmp2, Mmp9 mRNA expression in Irf5fl/fl and Irf5fl/flLyz2Cre were measured by qPCR. (F) MMP9 protein expression was markedly reduced in Irf5fl/flLyz2Cre UUO mice renal tissues versus Irf5fl/fl UUO controls. Data are expressed as the mean ± SD. Statistical comparisons among multiple groups were performed using 1-way ANOVA followed by Tukey’s post hoc test. n = 3–7. *P < 0.05; **P < 0.01; ***P < 0.001; ****P < 0.0001.
IRF5 positively regulated MMP9 and inflammatory responses in bone marrow–derived macrophages. Our previous report showed that IRF5 directly regulate MMP9 in response to CpG, a TLR9 agonist (14). Similarly, we observed a significant increase in the expression of IRF5 and MMP9 in BMDMs after stimulation with TNF-α, with colocalization within the macrophages (Figure 10A). IRF5 KO in macrophages was verified by Western blotting (Supplemental Figure 2C). The expression of MMP9 in Irf5fl/flLyz2Cre BMDMs was significantly lower than those in control (Figure 10B). Likewise, we found that TNF-α stimulation significantly upregulated Mmp9 mRNA and MMP9 protein expression in BMDMs, and the increase was markedly less in Irf5fl/flLyz2Cre BMDMs (Figure 10, C and D). In addition, qPCR was performed to analyze BMDMs derived from Irf5fl/fl and Irf5fl/flLyz2Cre mice. The results demonstrated that mRNA expression of the proinflammatory factors Il1b, and Il6 was significantly upregulated in both groups after stimulation, but the increase was considerably lower in Irf5fl/flLyz2Cre BMDMs. Although TNF-α stimulation appeared to slightly upregulate profibrotic factor Tgfb1 expression in BMDMs, the difference did not reach statistical significance between the 2 groups (Figure 10C). CUT&Tag analysis of TNF-α–treated BMDMs demonstrated that IRF5 binding intensity at the Mmp9 promoter region was significantly enhanced compared with controls (Figure 10E). These findings suggest that IRF5 directly regulates Mmp9 transcription and may promote fibrosis through the MMP9 pathway rather than the classical TGF-β1 pathway.
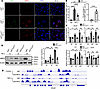 Figure 10
IRF5 positively regulates MMP9 expression and inflammation in BMDMs. (A) Representative images of dual immunofluorescence using IRF5 (green), MMP9 (red), and DAPI (blue) in BMDMs. Scale bars: 5 μm. (B) MMP9 expression significantly upregulated in BMDMs after TNF-α stimulation, with colocalization within the macrophages. The expression of MMP9 in BMDMs derived from Irf5fl/flLyz2Cre mice was significantly lower than those derived from Irf5fl/fl mice. (C and D) Mmp9 mRNA and MMP9 protein expression in Irf5fl/fl and Irf5fl/flLyz2Cre BMDMs after 0-, 8-, and 24-hour TNF-α stimulation were measured by qPCR and Western blot. MMP9 protein expression was significantly reduced in Irf5fl/flLyz2Cre BMDMs versus Irf5fl/fl BMDMs. Il-1β, Il-6, and Tgf-β1 mRNA expression in Irf5fl/fl and Irf5fl/flLyz2Cre BMDMs after 0-, 8-, and 24-hour TNF-α stimulation were measured by qPCR. TNF-α stimulation induced significant upregulation of Il-1β, and IL-6 mRNA in BMDMs, with Irf5fl/flLyz2Cre BMDMs showing a markedly reduced response compared with Irf5fl/fl BMDMs. (E) Representative chromatin landscapes of BMDMs across the Mmp9 region in the murine genome through CUT&TAG sequencing. Data are expressed as the mean ± SD. Statistical comparisons among multiple groups were performed using 1-way ANOVA followed by Tukey’s post hoc test. n = 3–5. *P < 0.05; **P < 0.01; ***P < 0.001; ****P < 0.0001. BMDMs, bone marrow–derived macrophages.
MMP9 expression was significantly increased and colocalized with IRF5 in the renal tissues of patients with obstructive nephropathy. We examined the expression and colocalization of IRF5 and MMP9 in the renal tissues of patients with obstructive nephropathy. The results indicate that the increased IRF5 and MMP9 expression was associated with the severity of renal fibrosis; their colocalization was evident (Figure 11A), and the proportion of IRF5+MMP9+ cells among MMP9+ cells was significantly higher (Figure 11B). This suggests that IRF5 plays a crucial role in the progression of renal fibrosis via the regulation of MMP9 expression.
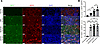 Figure 11
MMP9 expression was significantly elevated and colacalized with IRF5 in patients with obstructive nephropathy. (A) Representative images of dual immunofluorescence using IRF5 (green), MMP9 (red), and DAPI (blue) with varying degrees of fibrosis. White arrows indicate cells with obvious strong double-positive signals. Scale bars: 50 μm. (B) The number of MMP9+ cells increased in fibrotic tissues. IRF5+MMP9+ cells proportion was significantly greater among MMP9+ cells in obstructive nephropathy renal tissues than in controls. Data are expressed as the mean ± SD. Statistical comparisons among multiple groups were performed using 1-way ANOVA followed by Tukey’s post hoc test. n = 5–7. *P < 0.05; **P < 0.01; ****P < 0.0001.
IRF5 inhibitor attenuated UUO induced renal fibrosis in mice. In order to further investigate the role of IRF5 in promoting renal fibrosis, we established the UUO mouse model in WT mice. The treatment group received i.p. injections of IRF5 inhibitor (100 μg per mouse) on days 0, 1, 4, and 7 after UUO induction. An equal volume of saline was administered to the control group. Mice were sacrificed on day 14, and kidney samples were collected (Figure 12A). Western blot results confirmed the inhibitory effect on IRF5 (Supplemental Figure 2D). In the results of MTS, the fibrotic area of the obstructed kidneys from the treatment group was significantly smaller compared with the control group (P = 0.02). IHC staining showed a significant decline in the expression of α-SMA and VIM in the obstructed kidneys from the treatment group (Figure 12, B and C). Additionally, the numbers of IRF5+ cells and CD68+ cells were significantly decreased in the obstructed kidneys from the treatment group (Figure 12, B and D).
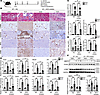 Figure 12
IRF5 inhibitors mitigated renal fibrosis in vivo. (A) Schematic graph to show the time point of normal saline or IRF5 inhibitor injection. The drug was administered after UUO on days 0, 1, 4, 7, and 14. (B) Representative Masson staining and immunohistochemical images of α-SMA, VIM, IRF5, and CD68 of kidney from mice receiving saline or IRF5 inhibitor treatment. Scale bars: 50 μm. (C) Collagen deposition is augmented in UUO-induced WT renal tissues yet diminished in IRF5 inhibitor-treated mice. α-SMA+ and VIM+ region was significantly upregulated in the UUO group and downregulated in the inhibitor-treated group. (D) The numbers of IRF5+ cells and CD68+ cells were significantly decreased in the obstructed kidneys from the treatment group. (E) Renal Acta2, Vim, Mmp9, Irf5, Tnf-α, Tgf-β1, Il-6, and Il-1β mRNA expression in the indicated mouse groups were measured by qPCR. (F) Renal MMP9 and α-SMA protein expression in the indicated mouse groups were measured by Western blot, the results were subjected to quantitative analysis. Data are expressed as the mean ± SD. Statistical comparisons among multiple groups were performed using 1-way ANOVA followed by Tukey’s post hoc test. n = 3–9. *P < 0.05; **P < 0.01; ***P < 0.001.
To investigate the effects of the IRF5 inhibitor on the expression of multiple proinflammatory and profibrotic factors, we subsequently conducted qPCR analyses of fibrosis-related indicators (Acta2, Mmp9, and Vim) and proinflammatory markers (Tnf-α, Tgf-β1, IL-6, and IL-1β) on the obstructed kidneys. Interestingly, our results demonstrated that Acta2, Mmp9, Vim, Tnf-α, IL-6, and IL-1β levels significantly decreased in the treatment group, with no significant difference observed in Tgf-β1 expression between the 2 groups (Figure 12E). Furthermore, it showed that the protein expression levels of MMP9 and α-SMA were significantly lower in the obstructed kidneys from the treatment group (Figure 12F).


