
Research ArticleImmunologyInflammation
Open Access |  10.1172/jci.insight.202802
Persistent infection is associated with divergent evolution of T cell repertoires
Daniel Y. Chang,1,2 Barbara Bravi,3 Sakshi Malik,4 Donald J. McGuire,1,2 Hasan Ahmed,5 Rustom Antia,5 Rafi Ahmed,1,2 and Ehsan Ghorani6
1Emory Vaccine Center, and
2Department of Microbiology and Immunology, Emory University School of Medicine, Atlanta, Georgia, USA.
3Department of Mathematics, Imperial College London, London, United Kingdom.
4Aflac Cancer and Blood Disorder Center, Department of Pediatrics, Children’s Healthcare of Atlanta, Emory University School of Medicine, Atlanta, Georgia, USA.
5Department of Biology, Emory University, Atlanta, Georgia, USA.
6Cancer Immunology and Immunotherapy Lab, Division of Cancer, Imperial College London, London, United Kingdom.
Address for correspondence. Ehsan Ghorani, Imperial College London, ICTEM Building Level 1, Hammersmith Campus, 72 Du Cane Road, London W12 0NN, United Kingdom. Email: e.ghorani@imperial.ac.uk. Daniel Y. Chang’s present address is: Department of Pathology, Mass General Brigham, Harvard Medical School, Boston, Massachusetts, USA.
Find articles by Chang, D. in: PubMed | Google Scholar
1Emory Vaccine Center, and
2Department of Microbiology and Immunology, Emory University School of Medicine, Atlanta, Georgia, USA.
3Department of Mathematics, Imperial College London, London, United Kingdom.
4Aflac Cancer and Blood Disorder Center, Department of Pediatrics, Children’s Healthcare of Atlanta, Emory University School of Medicine, Atlanta, Georgia, USA.
5Department of Biology, Emory University, Atlanta, Georgia, USA.
6Cancer Immunology and Immunotherapy Lab, Division of Cancer, Imperial College London, London, United Kingdom.
Address for correspondence. Ehsan Ghorani, Imperial College London, ICTEM Building Level 1, Hammersmith Campus, 72 Du Cane Road, London W12 0NN, United Kingdom. Email: e.ghorani@imperial.ac.uk. Daniel Y. Chang’s present address is: Department of Pathology, Mass General Brigham, Harvard Medical School, Boston, Massachusetts, USA.
Find articles by Bravi, B. in: PubMed | Google Scholar
1Emory Vaccine Center, and
2Department of Microbiology and Immunology, Emory University School of Medicine, Atlanta, Georgia, USA.
3Department of Mathematics, Imperial College London, London, United Kingdom.
4Aflac Cancer and Blood Disorder Center, Department of Pediatrics, Children’s Healthcare of Atlanta, Emory University School of Medicine, Atlanta, Georgia, USA.
5Department of Biology, Emory University, Atlanta, Georgia, USA.
6Cancer Immunology and Immunotherapy Lab, Division of Cancer, Imperial College London, London, United Kingdom.
Address for correspondence. Ehsan Ghorani, Imperial College London, ICTEM Building Level 1, Hammersmith Campus, 72 Du Cane Road, London W12 0NN, United Kingdom. Email: e.ghorani@imperial.ac.uk. Daniel Y. Chang’s present address is: Department of Pathology, Mass General Brigham, Harvard Medical School, Boston, Massachusetts, USA.
Find articles by Malik, S. in: PubMed | Google Scholar
1Emory Vaccine Center, and
2Department of Microbiology and Immunology, Emory University School of Medicine, Atlanta, Georgia, USA.
3Department of Mathematics, Imperial College London, London, United Kingdom.
4Aflac Cancer and Blood Disorder Center, Department of Pediatrics, Children’s Healthcare of Atlanta, Emory University School of Medicine, Atlanta, Georgia, USA.
5Department of Biology, Emory University, Atlanta, Georgia, USA.
6Cancer Immunology and Immunotherapy Lab, Division of Cancer, Imperial College London, London, United Kingdom.
Address for correspondence. Ehsan Ghorani, Imperial College London, ICTEM Building Level 1, Hammersmith Campus, 72 Du Cane Road, London W12 0NN, United Kingdom. Email: e.ghorani@imperial.ac.uk. Daniel Y. Chang’s present address is: Department of Pathology, Mass General Brigham, Harvard Medical School, Boston, Massachusetts, USA.
Find articles by McGuire, D. in: PubMed | Google Scholar
1Emory Vaccine Center, and
2Department of Microbiology and Immunology, Emory University School of Medicine, Atlanta, Georgia, USA.
3Department of Mathematics, Imperial College London, London, United Kingdom.
4Aflac Cancer and Blood Disorder Center, Department of Pediatrics, Children’s Healthcare of Atlanta, Emory University School of Medicine, Atlanta, Georgia, USA.
5Department of Biology, Emory University, Atlanta, Georgia, USA.
6Cancer Immunology and Immunotherapy Lab, Division of Cancer, Imperial College London, London, United Kingdom.
Address for correspondence. Ehsan Ghorani, Imperial College London, ICTEM Building Level 1, Hammersmith Campus, 72 Du Cane Road, London W12 0NN, United Kingdom. Email: e.ghorani@imperial.ac.uk. Daniel Y. Chang’s present address is: Department of Pathology, Mass General Brigham, Harvard Medical School, Boston, Massachusetts, USA.
Find articles by Ahmed, H. in: PubMed | Google Scholar
1Emory Vaccine Center, and
2Department of Microbiology and Immunology, Emory University School of Medicine, Atlanta, Georgia, USA.
3Department of Mathematics, Imperial College London, London, United Kingdom.
4Aflac Cancer and Blood Disorder Center, Department of Pediatrics, Children’s Healthcare of Atlanta, Emory University School of Medicine, Atlanta, Georgia, USA.
5Department of Biology, Emory University, Atlanta, Georgia, USA.
6Cancer Immunology and Immunotherapy Lab, Division of Cancer, Imperial College London, London, United Kingdom.
Address for correspondence. Ehsan Ghorani, Imperial College London, ICTEM Building Level 1, Hammersmith Campus, 72 Du Cane Road, London W12 0NN, United Kingdom. Email: e.ghorani@imperial.ac.uk. Daniel Y. Chang’s present address is: Department of Pathology, Mass General Brigham, Harvard Medical School, Boston, Massachusetts, USA.
Find articles by Antia, R. in: PubMed | Google Scholar
1Emory Vaccine Center, and
2Department of Microbiology and Immunology, Emory University School of Medicine, Atlanta, Georgia, USA.
3Department of Mathematics, Imperial College London, London, United Kingdom.
4Aflac Cancer and Blood Disorder Center, Department of Pediatrics, Children’s Healthcare of Atlanta, Emory University School of Medicine, Atlanta, Georgia, USA.
5Department of Biology, Emory University, Atlanta, Georgia, USA.
6Cancer Immunology and Immunotherapy Lab, Division of Cancer, Imperial College London, London, United Kingdom.
Address for correspondence. Ehsan Ghorani, Imperial College London, ICTEM Building Level 1, Hammersmith Campus, 72 Du Cane Road, London W12 0NN, United Kingdom. Email: e.ghorani@imperial.ac.uk. Daniel Y. Chang’s present address is: Department of Pathology, Mass General Brigham, Harvard Medical School, Boston, Massachusetts, USA.
Find articles by Ahmed, R. in: PubMed | Google Scholar
1Emory Vaccine Center, and
2Department of Microbiology and Immunology, Emory University School of Medicine, Atlanta, Georgia, USA.
3Department of Mathematics, Imperial College London, London, United Kingdom.
4Aflac Cancer and Blood Disorder Center, Department of Pediatrics, Children’s Healthcare of Atlanta, Emory University School of Medicine, Atlanta, Georgia, USA.
5Department of Biology, Emory University, Atlanta, Georgia, USA.
6Cancer Immunology and Immunotherapy Lab, Division of Cancer, Imperial College London, London, United Kingdom.
Address for correspondence. Ehsan Ghorani, Imperial College London, ICTEM Building Level 1, Hammersmith Campus, 72 Du Cane Road, London W12 0NN, United Kingdom. Email: e.ghorani@imperial.ac.uk. Daniel Y. Chang’s present address is: Department of Pathology, Mass General Brigham, Harvard Medical School, Boston, Massachusetts, USA.
Find articles by Ghorani, E. in: PubMed | Google Scholar
Published November 9, 2026 - More info
JCI Insight. 2026;11(21):e202802. https://doi.org/10.1172/jci.insight.202802.
© 2026 Chang et al. This work is licensed under the Creative Commons Attribution 4.0 International License. To view a copy of this license, visit http://creativecommons.org/licenses/by/4.0/.
Received: November 24, 2025; Accepted: September 24, 2026

-
Results
Dominant clonotypes that emerge during chronic viral infection are not shared. Studying the LCMV clone 13 model of chronic infection, we previously observed that TCR diversity was reduced over time in a process of repertoire narrowing (8). We first set out to describe evolution of the LCMV-reactive CD8+ T cell repertoire in more detail by CDR3β sequencing of CD8+ T cell clones responding to GP33 and GP276 epitopes in 8 different mice (n = 4 each at day 8 and 60 of infection, respectively).
Over time, the number of unique clonotypes (defined as unique CDR3β sequences) responding to GP33 decreased from 1084 to 482, while there was a small increase in the number of GP276-specific clonotypes (from 761 to 1034; Figure 1, A and C). Individual mice had similar numbers of unique clones at each time point in the GP33 repertoire, with a median of 274 clones (range 229–307) early in infection, compared with 107 (range 97–171) at the later time point. A similar pattern was observed for the GP276 repertoire, with a median of 186 clones (range 160–230) on day 8 versus 267 (range 172–329) on day 60 of infection (Figure 1, B and D).
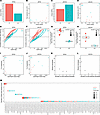 Figure 1
Emergence of dominant clones over time but limited repertoire sharing between LCMV-infected mice. LCMV clone 13–infected mice were euthanized on day 8 (d8) and d60 for peptide-MHC tetramer sorting of GP33- and GP276-reactive CD8+ T cells from the spleen and liver. (A–D) Total number of clones identified on d8 and d60 (4 mice at each time point) and the relationship between the number of clones and total repertoire size (the sum of CDR3βs sequenced) for individual mice for GP33- (A and B) and GP276-specific (C and D) T cells; total clones were aggregated across 4 mice in A and C. Cumulative proportion of the repertoire composed of clones of ascending size for GP33-specific (E) and GP276-specific (F) cells over time; each line represents 1 mouse. (G and H) Proportion of clones comprising 95% of the repertoire over time (point size indicates the total number of clones that occupy 95% of the repertoire) for GP33-specific (G) and GP276-specific T cells (H). (I and J) Proportion of the repertoire occupied by the largest clone over time for GP33- (I) and GP276-specific (J) cells. (K and L) Number of unique CDR3 sequences shared between mice for GP33- (K) and GP276-reactive (L) cells. (M) CDR3β sequence and clone size of public clonotypes shared by 3 or more mice (including mice studied at different time points).
Considering distribution of clone sizes, we found the majority of the GP33- and GP276-specific response (95% of the repertoire) was composed of clones consisting of greater than 10 reads on day 8 versus greater than 100 on day 60 after infection (Figure 1, E and F), demonstrating skewing of the repertoire towards dominant clones over time. In keeping with this, the top 95% of the repertoire was comprised of a median of 17.3% and 5.0% of clones in the GP33 and GP276 repertoires, respectively, at the later time point (Figure 1, G and H). In contrast, 47.0% and 28.3% of clones in the GP33 and GP276 repertoires comprised the majority at the early time point (Figure 1, G and H). The largest clone in each mouse comprised at least 32.8% and 27.6% of the GP33 and GP276 repertoires on day 60, respectively, while the largest clone on day 8 contributed 14.6% and 25.0% of the GP33 and GP276 repertoires (Figure 1, I and J).
Dominant clonotypes were not shared between mice. Only 25 GP276-specific and 38 GP33-specific public clonotypes (defined as clonotypes shared between 3 or more mice) were identified (Figure 1, K and L). These public sequences belonged to relatively small clones in individual mice (size 250 or less; Figure 1M).
These results highlight that although the emergence of dominant clones occurs across mice and in response to different antigens, public clonotypes are infrequent and subdominant. Thus, an evaluation of whether TCR sequence is a determinant of dominance requires an approach that does not rely on analysis of infrequently observed shared clonotypes.
CDR3β similarity analysis reveals clusters shared between mice. Previous observations noted that antigen-specific TCR sequences cluster into groups sharing similar motifs (35–37). Based on the hypothesis that shared TCR sequence features may mediate common patterns of TCR signaling responsible for the emergence of dominance, we grouped CDR3β sequences into clusters based on their similarity. To discover clusters, we carried out pairwise comparisons of all CDR3β sequences, to define similarity scores based on the degree of triplet amino acid sequence sharing, as previously described (38), followed by Louvain clustering (39).
To determine the general capability of this approach to distinguish biologically different CDR3s, we co-clustered sequences from GP33- and GP276-reactive T cells. We found particular clusters were enriched for CDR3βs with GP33 or GP276 reactivity, suggesting the clustering motifs discovered using this approach can correlate with antigen specificity (Supplemental Figure 1; supplemental material available online with this article; https://doi.org/10.1172/jci.insight.202802DS1).
We next applied this method to identify subgroups of GP33-reactive CDR3β sequences. Visualization of the pairwise similarity matrix revealed significant structure within the CDR3β sequence space of GP33-reactive cells (Figure 2A). Network analysis and clustering identified 136 CDR3β clusters, of which 12 were present in all 8 mice. We defined these as ubiquitous clusters (Figure 2B). Ubiquitous clusters were composed of differing numbers of clonotypes ranging from 16 to 134 combined across 8 mice (Figure 2C). There was no obviously dominant cluster, with the majority of clusters comprising approximately a median of 1% of the total mouse-specific repertoire, while clusters 1 and 2 comprised a median of approximately 5% and 19%, respectively (Figure 2C). J and V gene usage was heterogeneous across clusters, although J usage was more focused, with 9 clusters characterized by usage of a single J gene (Figure 2C). However, J gene usage was not cluster specific and most J genes were found in more than one cluster.
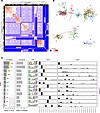 Figure 2
CDR3β similarity analysis identifies public clusters among GP33 tetramer–positive cells. (A) Heatmap depicts similarity scores between pairs of CDR3β sequences from GP33-reactive CD8+ T cells. Similarity was calculated according to the degree of triplet amino acid content sharing between pairs. (B) Network plot depicts CDR3β sequences (nodes) that belong to clusters (colored) that are shared between all 8 mice in the experiment. CDR3β sequences with greater than threshold similarity are connected by edges. (C) Composition, abundance, motif analysis, and V/J gene usage among ubiquitous clusters shared by all 8 mice. Left-hand bar plot depicts the number of unique CDR3β sequences in each cluster; colored segments represent unique CDR3s contributed by individual mice. The adjacent bar plot shows the median abundance of each cluster (as a proportion of the repertoire of each mouse). Sequence logo plots show common motifs within each cluster. J and V gene usage is shown as the percentage of clones in the cluster utilizing a particular gene in each category.
GP276-specific TCRs were analyzed using the same methodology (Figure 3A). We identified 132 CDR3β clusters, 12 of which were ubiquitously found in all 8 mice (Figure 3B). The total number of TCRs found within each ubiquitous cluster ranged from 17 to 119. Unlike the GP33 clusters, half contributed close to a median of 1%–10% of the repertoire of each mouse, with the dominant cluster 4 comprising approximately 11% of the repertoire (Figure 3C). Similarly to the GP33 repertoire, J and V gene usage was distributed between clusters (Figure 3C).
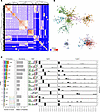 Figure 3
CDR3 similarity analysis identifies public clusters among GP276 tetramer–positive cells. (A) Heatmap depicts similarity scores between pairs of CDR3β sequences from GP276-reactive CD8+ T cells. Similarity was calculated according to the degree of triplet amino acid content sharing between pairs. (B) Network plot depicts CDR3β sequences (nodes) that belong to clusters (colored) that are shared between all 8 mice in the experiment. CDR3β sequences with significant similarity are connected by edges. (C) Composition, abundance, motif analysis, and V/J gene usage among ubiquitous clusters shared by all 8 mice. Left-hand bar plot depicts the number of unique CDR3β sequences in each cluster; colored segments represent unique CDR3s contributed by individual mice. The adjacent bar plot shows the median abundance of each cluster (as a proportion of the repertoire of each mouse). Sequence logo plots show common motifs within each cluster. J and V gene usage is shown as the percentage of clones in the cluster utilizing a particular gene in each category.
To confirm the clusters identified using our approach are not an artifact of the particular method used, we also utilized the TCRdist package to calculate pairwise similarity scores between TCRs based on amino acid sequence alignment with BLOSUM62 (36), followed by graph-based clustering as before. Similar to our triplet motif–based (TM-based) approach described above, TCRdist identified ubiquitous clusters in both the GP33 and GP276 repertoires (Supplemental Figure 2, A and B). To explore the relationship between ubiquitous TCRdist and TM clusters, we calculated how clones in each TCRdist cluster were distributed across each TM cluster. For most TCRdist clusters, constituent clones were focused into 1 or 2 TM clusters, indicating these two approaches identified similar clusters in both the GP33 (Supplemental Figure 2C) and GP276 repertoires (Supplemental Figure 2D). We quantified the degree of agreement between clusters defined using these two approaches using the adjusted Rand index and found values of 0.46 and 0.34 for GP33- and GP276-reactive repertoires, respectively, indicating moderate concordance between TM and TCRdist clusters.
Overall, ubiquitous clusters present in all 8 mice within GP33- and GP276-specific repertoires comprised the majority of the CD8+ T cell response (Supplemental Figure 3, A and B). In the GP33 repertoire, the ubiquitous clusters represented around 50% of the response on day 8 and more than 75% on day 60 for most mice. Not all CDR3β sequences had sufficiently high pairwise similarity to fall within a cluster. Such unclustered CDR3s comprised on average less than 20% of the repertoire at both time points (Supplemental Figure 3C). Similarly for the GP276 repertoire, ubiquitous clusters made up more than 50% of the repertoire at the early time point and approximately 15%–75% of the response at the later time point, with a minor contribution of unclustered CDR3β sequences (Supplemental Figure 3D).
Finally, we evaluated whether the CDR3β clusters we identified can be found in other datasets. We obtained GP33-reactive CD8+ T cell TCR sequencing data from the VDJdb database (40–42). Among 123 CDR3β sequences identified in this database, 15 were found in our data, 14 of which fell within ubiquitous clusters (Supplemental Figure 4A). Notably, the CDR3β sequence of the well-studied GP33-reactive P14 TCR (CASSDAGGRNTLYF) was located within cluster 13 (Supplemental Figure 4B). Of the remaining 108 external sequences with no direct match in our dataset, we carried out pairwise comparisons to identify the CDR3β sequence of known cluster identity they most closely resemble. The majority of external CDR3βs were matched to ubiquitous clusters (Supplemental Figure 4C).
Taken together, our data show that antigen-specific repertoires with very few public CDR3β sequences are comprised of clusters of CDR3βs marked by shared sequence similarity and that these clusters are found across mice.
Chronic viral infection is associated with mouse-specific changes in CDR3 cluster usage. In LCMV clone 13 and other chronic infections, dominant CD8+ clones emerge over time (8, 10). It is unknown whether CDR3β sequence features determine clonal fitness. As most CDR3β sequences are private, this has been challenging to evaluate. Since clusters defined by CDR3β sequence similarity are shared between mice, we hypothesized that if CDR3β sequence contributes to clonal fitness, similar patterns of cluster expansion would be observed across mice.
Within the GP33 repertoire, visualization of clonal expansion within each cluster revealed dominance of clusters 2 and 1 at the early time point (Figure 4A). This was followed by a more diverse pattern of clonal expansion on day 60, with multiple clusters showing evidence of one or more highly expanded clones (e.g., clusters 6, 5, and 7). Notably, the previously dominant clusters 2 and 1 were no longer expanded on day 60, with an apparent decrease in the abundance of cluster 1 across all mice.
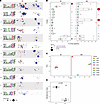 Figure 4
Repertoire evolution among GP33-reactive T cells. (A) GP33-reactive ubiquitous clusters, showing sequence motifs and network plots for each cluster on d8 and d60 after infection with LCMV clone 13. Node size represents the degree of clone expansion; nodes are colored according to whether the corresponding clone was found in the stem-like gate (PD1+, CD39–, Tim3–; green), the exhausted gate (PD1+, CD39+, Tim3+; red), or within both gates (blue). Edges connect CDR3βs with significant similarity measured by sharing of triplet amino acids. (B) Percentage of the repertoire of each mouse occupied by each ubiquitous cluster on d8 and d60. The proportion of the repertoire occupied by non-shared CDR3βs belonging to non-ubiquitous clusters (mouse specific, Sp; found in 7 or fewer mice) or not allocated to a cluster (unclustered; UC) are also shown. Circles to the right of the box-and-whisker plots indicate the fold change in cluster abundance compared to what is expected by chance (red, greater than expected; blue, less than expected), and whether this difference is statistically significant (solid circles, P < 0.05; lightly shaded circles, P > 0.05). (C) PCA of cluster abundance on d8 and d60. (D) Repertoire similarity in terms of cluster abundance between mice on d8 and d60, measured by calculating the Morisita-Horn index between all pairs of mice at each time point. P value calculated by 2-tailed Wilcoxon rank-sum test.
We next quantified cluster abundance as a proportion of the total repertoire for individual mice. For each cluster, we measured relative abundance by calculating the expected abundance level under a null model where clones were not grouped into clusters based on sequence similarity but rather were randomly assigned to clusters. We observed statistically significant expansion of cluster 2 at the early time point (Figure 4B). This single cluster comprised approximately 20% of the repertoire in all 4 mice on day 8 of infection, in contrast to the other clusters, which ranged from 1% to 10%.
Notably, the pattern of cluster abundance was highly similar between all 4 mice at the early time point (Figure 4B). In contrast, individual mice became divergent in their patterns of cluster abundance at the later time point. For example, expanded clones within clusters 6 and 5 in two mice drove an overall significant growth of these clusters. A third mouse further expanded cluster 2 in contrast to the other mice studied, among whom this cluster lost dominance. Cluster 7 became dominant in this same mouse, with over 50% of the repertoire occupied by this cluster alone. A fourth mouse expanded clones within non-ubiquitous clusters and among unclustered clones. While a number of clusters were of low abundance at both early and late time points, e.g., clusters 13 and 11, their abundance was not significantly lower than expected at each time point.
To further explore the hypothesis that a shared pattern of cluster abundance is established early in infection but is lost over time, we carried out principal component analysis (PCA) of cluster abundance. This showed a tight grouping of individual mice early in infection, supporting the notion that mice initially share a common pattern of cluster abundance. In contrast, the hierarchical pattern of cluster abundance diverged at the later time point (Figure 4C). We quantified this by measuring cluster abundance similarity between pairs of mice, using the Morisita-Horn index (Figure 4D). This confirmed that high similarity in the pattern of cluster abundance between mice early in infection is lost on day 60.
We found a similar pattern in the GP276 repertoire, with initial expansion of a single cluster (cluster 4) in all but 1 mouse followed by greater variability of cluster usage over time, particularly with non-ubiquitous clusters gaining importance (Figure 5, A and B). As for the GP33 repertoire, quantification of repertoire similarity confirmed strongly related cluster usage between mice on day 8 followed by divergence on day 60 (Figure 5, C and D).
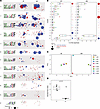 Figure 5
Repertoire evolution among GP276-reactive T cells. (A) GP276-reactive ubiquitous clusters showing sequence motifs and network plots for each cluster on d8 and d60 after infection with LCMV clone 13. Node size represents the degree of clone expansion; nodes are colored according to whether the corresponding clone was found in the stem-like gate (PD1+, CD39–, Tim3–; green), the exhausted gate (PD1+, CD39+, Tim3+; red), or within both gates (blue). Edges connect CDR3βs with significant similarity measured by sharing of triplet amino acids. (B) Percentage of the repertoire of each mouse occupied by each ubiquitous cluster on d8 and d60. The proportion of the repertoire occupied by non-shared CDR3βs belonging to non-ubiquitous clusters (mouse specific, Sp; found in 7 or fewer mice) or not allocated to a cluster (unclustered; UC) are also shown. Circles to the right of the box-and-whisker plots indicate the fold change in cluster abundance compared to what is expected by chance (red, greater than expected; blue, less than expected), and whether this difference is statistically significant. (C) PCA of cluster abundance on d8 and d60. (D) Repertoire similarity in terms of cluster abundance between mice on d8 and d60, measured by calculating the Morisita-Horn index between all pairs of mice at each time point. P value calculated by 2-tailed Wilcoxon rank-sum test.
To verify these findings using a different clustering approach, we evaluated changes in the abundance of TCRdist clusters over time. As before, within both GP33- and GP276-reactive repertoires, we found that high similarity of cluster abundance early in infection gave way to significantly greater repertoire heterogeneity between mice later in infection (Supplemental Figure 5, A and D). PCA carried out on the distribution of cluster abundance showed mice were closely related early in infection, with divergence later on. Pairwise comparisons of repertoire similarity using the Morisita-Horn index confirmed a significant decline in the similarity of cluster abundance at the later time point (Supplemental Figure 5, B, C, E, and F).
We previously observed a high degree of overlap between the repertoires of stem-like and exhausted populations, with most clones found in both states. However, within clusters and over time, we found no clear patterns in the proportion of clones found in the exhausted but not stem-like states (Supplemental Figure 6).
Overall, we found the early repertoire of both GP33- and GP276-reactive cells to be highly similar between mice in terms of the pattern of cluster abundance. At the later time point, clusters that were dominant early in the response occupied less of the repertoire and individual mice expanded clusters in a variable manner. These results suggest that early in the infection, the hierarchy of clonal expansion is related to CDR3β sequence usage and potentially driven by TCR fitness. Later, mice generate individual solutions with no single cluster dominant across them all, suggesting that clonal fitness early versus late in infection may be determined by different factors.
Chronic viral infection leads to clonal bias not observed during acute viral infection. To explore the hypothesis that the antigen-specific repertoire structure is shaped by shared CDR3β motifs early in infection, we characterized CDR3β cluster abundance in mice infected with the acute Armstrong strain of LCMV that shares the GP33 epitope with LCMV clone 13. We reasoned that the early response to both Armstrong and clone 13 strains should be similarly patterned if dependent on the CDR3β motif.
We sorted GP33 tetramer–positive CD8+ T cells from LCMV Armstrong–infected mice on day 8 and day 200 after infection (3 mice in each group) for CDR3β sequencing. CDR3β sequences from Armstrong strain–infected mice were assigned to previously defined clusters by identification of the most similar CDR3β sequence from clone 13 strain–infected mice and cluster labels were assigned accordingly. For each mouse at each time point, we calculated the percentage of the repertoire occupied by each cluster for both strains. PCA revealed a striking similarity in the pattern of cluster abundance between mice at the early time point, independent of strain of infection (Figure 6A). In contrast to the repertoire divergence observed among clone 13–infected mice, the pattern of cluster abundance among Armstrong-infected mice on day 200 remained strongly similar to the day 8 state (Figure 6A). To quantitate this, we calculated Morisita-Horn index values comparing each pair of Armstrong repertoires between mice on day 8, day 200, and comparing day 8 mice to day 200 mice (Figure 6B). High similarity values were observed in all comparisons. This suggests that the pattern of cluster abundance established on day 8 is similar between mice and does not significantly change over time, indicating a preservation of repertoire structure in the memory phase of the response in a manner that is stable between mice. Analysis of individual clusters revealed dominance of cluster 2 for both Armstrong- and clone 13–infected mice early in infection, with continued cluster 2 dominance in Armstrong but not clone 13 LCMV–infected mice (Figure 6, C and D).
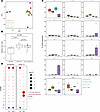 Figure 6
CDR3 cluster usage in acute and chronic infection. Mice were infected with LCMV Armstrong or clone 13 and GP33-reactive CD8+ T cells sorted for CDR3β sequencing early after infection (d8) or late after infection (d60 for clone 13, d200 for Armstrong). Different mice were sampled at each time point. CDR3βs from Armstrong-infected mice were assigned to previously found clone 13 clusters based on identification of the most similar matching CDR3β sequence. (A) PCA plot of cluster abundance as a proportion of the repertoire, across strains (Armstrong vs. clone 13) and time points (early vs. late after infection). (B) Comparison of the TCR repertoire similarity among mice sampled on d8, d200, or comparing mice between d8 and d200 (P values calculated by Wilcoxon rank-sum tests). (C) Abundance of each cluster across the 4 groups. (D) Fold change of observed over expected cluster abundance. Circle size depicts fold change. Red circles denote clusters that are significantly more abundant than expected; blue circles denote cluster is significantly less abundant than expected. P values in B were calculated by 2-tailed Wilcoxon rank-sum tests and in D by permutation (see Methods).
Using TCRdist-defined clusters, we similarly found that repertoire structure was preserved comparing early Armstrong infection to the day 200 memory response (Supplemental Figure 7, A–C). Once again, the pattern of cluster abundance was similar between early clone 13 and Armstrong infection (Supplemental Figure 7B).
Finally, since the probability of generation (pgen) may represent an important factor in shaping the TCR repertoire, we tested whether this is different comparing early and later time points of clone 13 infection. For both GP33- and GP276-reactive repertoires, we found no difference in pgen on day 8 and day 60 after infection (Supplemental Figure 8, A and C), suggesting that clones that persist and become dominant do not have a higher pgen. However, in keeping with the shared nature of ubiquitous clusters, we found that CDR3β sequences belonging to ubiquitous clusters of both GP33 and GP276 repertoires had a significantly higher pgen compared with their non-ubiquitous counterparts (Supplemental Figure 8, B and D). Overall, while the early repertoire in both acute and chronic infection was found to be similar, the memory response that develops after clearance of the acute challenge resembled the effector repertoire. In contrast, persistent infection is associated with development of repertoire instability, which may be driven by continuous antigen exposure.
Stem-like and exhausted repertoires are unstable over time in chronic infection. Stem-like populations give rise to the exhausted pool (8, 43, 44) but it is unknown whether repertoire stability differs between these populations in the context of chronic infection. To evaluate this, we characterized the pattern of cluster abundance in the stem-like and exhausted GP33 and GP276 repertoires. Strikingly, there was strong similarity between stem-like and exhausted repertoires at the early time point across mice, but this common pattern of cluster abundance diverged over time for both GP33- (Figure 7A) and GP276-reactive cells (Figure 7D). PCA of cluster abundance revealed repertoire similarity between stem-like and exhausted populations early in infection, with repertoire divergence over time in both subsets (Figure 7, B and E).
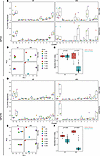 Figure 7
CDR3 cluster usage is highly similar between stem-like and exhausted populations during chronic viral infection. Abundance of each CDR3 cluster across GP33-specific (A) and GP276-specific (D) stem-like (PD1+CD39–Tim3–) and exhausted subsets (PD1+CD39+Tim3+). PCA plots of cluster abundance across GP33-specific (B) and GP276-specific (E) stem-like and exhausted subsets on d8 and d60. Morisita-Horn index measurements of the similarity of cluster abundance comparing stem-like versus exhausted repertoires, within and between mice on d8 and d60 for GP33-specific (C) and GP276-specific (F) repertoires. P values calculated by 2-tailed Wilcoxon rank-sum test.
Notably, repertoire structure within the stem-like and exhausted repertoires of individual mice appeared to have high similarity throughout time. We quantified this using the Morisita-Horn index. For both GP33 and GP276, repertoire similarity of stem-like and exhausted populations obtained from the same mouse was high both early and later in infection. In contrast, similarity of stem-like and exhausted populations comparing between pairs of mice was high at the early time point, significantly falling off later in infection (Figure 7, C and F). These results suggest a close alignment between the pattern of cluster abundance in stem-like and exhausted populations and that this similarity persists over time within individual mice, consistent with the notion that stem-like cells differentiate to populate the exhausted pool. Since mice diverge in their repertoire structure over time, these results suggest the emergence of dominant clones later in infection is driven by changes within stem-like cells that gives rise to the exhausted population.


