Go to The Journal of Clinical Investigation
  • About
  • Editors
  • Consulting Editors
  • For authors
  • Journal stats
  • Publication ethics
  • Publication alerts by email
  • Transfers
  • Advertising
  • Job board
  • Contact
  • Physician-Scientist Development
  • Current issue
  • Past issues
  • By specialty
    • COVID-19
    • Cardiology
    • Immunology
    • Metabolism
    • Nephrology
    • Oncology
    • Pulmonology
    • All ...
  • Videos
  • Collections
    • In-Press Preview
    • Resource and Technical Advances
    • Clinical Research and Public Health
    • Research Letters
    • Editorials
    • Perspectives
    • Physician-Scientist Development
    • Reviews
    • Top read articles

  • Current issue
  • Past issues
  • Specialties
  • In-Press Preview
  • Resource and Technical Advances
  • Clinical Research and Public Health
  • Research Letters
  • Editorials
  • Perspectives
  • Physician-Scientist Development
  • Reviews
  • Top read articles
  • About
  • Editors
  • Consulting Editors
  • For authors
  • Journal stats
  • Publication ethics
  • Publication alerts by email
  • Transfers
  • Advertising
  • Job board
  • Contact
Top
  • View PDF
  • Download citation information
  • Send a comment
  • Terms of use
  • Standard abbreviations
  • Need help? Email the journal
  • Top
  • Abstract
  • Introduction
  • Results
  • Discussion
  • Methods
  • Manuscript information
  • Supplemental material
  • Acknowledgments
  • Footnotes
  • References
  • Version history
  • Article usage
  • Citations to this article
Advertisement

Research ArticleCardiologyOncology Open Access | 10.1172/jci.insight.203276

Elucidating cancer cachexia–mediated aberrant cardiac wasting signaling in human iPSC-derived cardiac muscle

Nora Hosny, Houda Cohen, Mohamed Waleed Elafany, Jeff Schreifels, John Bauer, Rishi Gulati, Brian R. Thompson, Julia C. Liu, and Joseph M. Metzger

Department of Integrative Biology and Physiology, University of Minnesota Medical School, Minneapolis, Minnesota, USA.

Address for correspondence. Joseph M. Metzger, Department of Integrative Biology and Physiology, University of Minnesota Medical School, 6-125 Jackson Hall, 321 Church Street SE, Minneapolis, Minnesota, 55455, USA. Phone: 612.625.8296; Email: metzgerj@umn.edu.

Find articles by Hosny, N. in: PubMed | Google Scholar

Department of Integrative Biology and Physiology, University of Minnesota Medical School, Minneapolis, Minnesota, USA.

Address for correspondence. Joseph M. Metzger, Department of Integrative Biology and Physiology, University of Minnesota Medical School, 6-125 Jackson Hall, 321 Church Street SE, Minneapolis, Minnesota, 55455, USA. Phone: 612.625.8296; Email: metzgerj@umn.edu.

Find articles by Cohen, H. in: PubMed | Google Scholar

Department of Integrative Biology and Physiology, University of Minnesota Medical School, Minneapolis, Minnesota, USA.

Address for correspondence. Joseph M. Metzger, Department of Integrative Biology and Physiology, University of Minnesota Medical School, 6-125 Jackson Hall, 321 Church Street SE, Minneapolis, Minnesota, 55455, USA. Phone: 612.625.8296; Email: metzgerj@umn.edu.

Find articles by Elafany, M. in: PubMed | Google Scholar

Department of Integrative Biology and Physiology, University of Minnesota Medical School, Minneapolis, Minnesota, USA.

Address for correspondence. Joseph M. Metzger, Department of Integrative Biology and Physiology, University of Minnesota Medical School, 6-125 Jackson Hall, 321 Church Street SE, Minneapolis, Minnesota, 55455, USA. Phone: 612.625.8296; Email: metzgerj@umn.edu.

Find articles by Schreifels, J. in: PubMed | Google Scholar

Department of Integrative Biology and Physiology, University of Minnesota Medical School, Minneapolis, Minnesota, USA.

Address for correspondence. Joseph M. Metzger, Department of Integrative Biology and Physiology, University of Minnesota Medical School, 6-125 Jackson Hall, 321 Church Street SE, Minneapolis, Minnesota, 55455, USA. Phone: 612.625.8296; Email: metzgerj@umn.edu.

Find articles by Bauer, J. in: PubMed | Google Scholar

Department of Integrative Biology and Physiology, University of Minnesota Medical School, Minneapolis, Minnesota, USA.

Address for correspondence. Joseph M. Metzger, Department of Integrative Biology and Physiology, University of Minnesota Medical School, 6-125 Jackson Hall, 321 Church Street SE, Minneapolis, Minnesota, 55455, USA. Phone: 612.625.8296; Email: metzgerj@umn.edu.

Find articles by Gulati, R. in: PubMed | Google Scholar

Department of Integrative Biology and Physiology, University of Minnesota Medical School, Minneapolis, Minnesota, USA.

Address for correspondence. Joseph M. Metzger, Department of Integrative Biology and Physiology, University of Minnesota Medical School, 6-125 Jackson Hall, 321 Church Street SE, Minneapolis, Minnesota, 55455, USA. Phone: 612.625.8296; Email: metzgerj@umn.edu.

Find articles by Thompson, B. in: PubMed | Google Scholar

Department of Integrative Biology and Physiology, University of Minnesota Medical School, Minneapolis, Minnesota, USA.

Address for correspondence. Joseph M. Metzger, Department of Integrative Biology and Physiology, University of Minnesota Medical School, 6-125 Jackson Hall, 321 Church Street SE, Minneapolis, Minnesota, 55455, USA. Phone: 612.625.8296; Email: metzgerj@umn.edu.

Find articles by Liu, J. in: PubMed | Google Scholar

Department of Integrative Biology and Physiology, University of Minnesota Medical School, Minneapolis, Minnesota, USA.

Address for correspondence. Joseph M. Metzger, Department of Integrative Biology and Physiology, University of Minnesota Medical School, 6-125 Jackson Hall, 321 Church Street SE, Minneapolis, Minnesota, 55455, USA. Phone: 612.625.8296; Email: metzgerj@umn.edu.

Find articles by Metzger, J. in: PubMed | Google Scholar

Published November 9, 2026 - More info

Published in Volume 11, Issue 21 on November 9, 2026
JCI Insight. 2026;11(21):e203276. https://doi.org/10.1172/jci.insight.203276.
© 2026 Hosny et al. This work is licensed under the Creative Commons Attribution 4.0 International License. To view a copy of this license, visit http://creativecommons.org/licenses/by/4.0/.
Published November 9, 2026 - Version history
Received: December 11, 2025; Accepted: September 14, 2026
View PDF
Abstract

Cancer cachexia is a debilitating syndrome of involuntary body mass loss featuring profound skeletal muscle wasting and high mortality. Cardiac muscle wasting is prominent in cancer patients and cancer survivors. We developed a human induced pluripotent stem cell–derived cardiac myocyte (hiPSC-CM) platform modeling cancer cachexia using conditioned media and Transwell coculture with C26 or HCT116 tumor cells. Cachectic hiPSC-CMs exhibited atrophy, reduced contraction amplitude, prolonged relaxation time, and elevated oxygen consumption rate, reflecting wasting, contractile dysfunction, and metabolic dysregulation. Mechanistically, suppression of the AKT/mTORC1/S6 signaling axis notably reduced total and p-AKT, decreased the p-S6/S6 ratio, and downregulated RPTOR, which coincided with FOXO1/3 activation and FOXO1 nuclear translocation, promoting downstream atrophic remodeling. Concurrently, Atrogin-1 upregulation reduced calcineurin A, impairing NFAT nuclear translocation, thereby suppressing downstream growth signaling. Increased autophagic flux with an elevated LC3BII/LC3BI ratio accompanied these changes. Following withdrawal of cachexia-inducing stimuli, Atrogin-1 and autophagy markers normalized within 1 week; however, contractile and metabolic impairments persisted, indicating delayed functional recovery. These findings establish the FOXO/Atrogin-1/calcineurin A/NFAT axis, operating within the broader context of AKT/mTORC1 suppression, as a central regulatory mechanism of cachexia-induced cardiac wasting, unveiling a tractable therapeutic target.

Graphical Abstract
graphical abstract
Introduction

Cardiovascular disorders and cancer, the top two leading causes of death in the United States, present a dual threat to global health affecting tens of millions of patients (1–3). Cardio-oncology represents a new frontier that has emerged due to the convergence of these two significant health crises (4). Cachexia is a severe condition, characterized by involuntary skeletal muscle wasting, affecting approximately 80% of cancer patients. Cancer cachexia is directly responsible for the deaths of about 30% cancer patients, often because of heart or respiratory failure (5, 6). With the increasing number of cancer patients worldwide, the burden of cardiac complications in cancer cachexia, namely cardiac atrophy and functional insufficiency, is increasing and this has become a significant health issue (3–8).

Chronic cardiac disease sequelae have become increasingly clinically relevant because of improved prognosis of cancer patients (4, 8). In the United States, there are nearly 20,000,000 cancer survivors, representing 6% of the population. Cardiovascular disease, surpassing cancer, is the leading cause of death among this population (4, 8). Cardio-oncology has traditionally centered on drug toxicities (4); however, this approach has to be expanded to encompass the cardiac insult caused directly by cancer itself, uncoupled from drug toxicities (8). This expanded understanding deepens insights into the underlying pathophysiology of the disease and positions the field for seeking oncological therapies with minimal or no cardiotoxic effects.

Recent studies have reported that the poor cardiac status of patients may intensify the process of cancer and cancer cachexia progression (9). Thus, a bidirectional relationship between cancer and the cardiac system exists. In short, cancer cachexia causes cardiomyopathy, and cardiomyopathy can exacerbate cancer progression (10, 11). Addressing cancer cachexia–induced cardiomyopathy is crucial to improving outcomes and longevity in both cancer patients and cancer survivors.

The processes leading to cardiac atrophy induced by cancer are understudied. This gap in knowledge presents an obstacle to the development of therapeutics for patients with cancer cachexia–induced heart disease. Current models of cancer cachexia–induced cardiac complications use rodents, or their cells, and although they offer valuable insights, they are limited owing to low throughput, short cell survival time ex vivo, and their restricted ability to recapitulate the complex nature of cardiac atrophy in humans (5, 12, 13). Thus, these approaches can fail to fully capture the progressive structural and functional changes in the heart caused by cachexia, affecting their capacity to test therapeutic interventions that promote cardiac recovery. In sum, to date, there is no cure for cancer cachexia–induced cardiomyopathy nor any effective treatments to prevent, halt, or reverse disease (14–16).

New models that employ human tissue for tracking cardiac impairment associated with cancer cachexia are needed. By harnessing advances in regenerative medicine, particularly via human induced pluripotent stem cell–derived cardiac myocytes (hiPSC-CMs), new opportunities arise to overcome these limitations. HiPSC-CMs provide a unique system to model human-specific cardiac function in the context of cachexia. HiPSC-CMs can be used to create patient-specific cardiac models, enabling a more personalized understanding of chronic disease effects on cardiac health (17–19). Furthermore, using hiPSC-CM models provides a platform to identify molecular mechanisms and evaluate future therapeutics aimed at mitigating cancer cachexia–induced cardiac dysfunction, making them ideal for testing the effects of novel treatments over extended periods.

We investigated here the mechanism of cancer cachexia–induced cardiomyopathy using a hiPSC-CM experimental platform. Data show that cachectic hiPSC-CMs replicate the cardiac phenotype of patients with cancer cachexia along multiple dimensions, including morphological, metabolic, and functional characteristics. Cachectic hiPSC-CMs enabled deeper mechanistic insights into the protein synthesis and degradation pathways involved in the pathogenesis of cancer cachexia–induced cardiac dysfunction. Specifically, we report herein a central role of the Atrogin-1/calcineurin A/NFAT axis in mediating cancer-induced cardiac atrophy in this setting.

Results

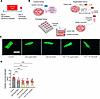
Animal-based cancer cachexia validates Transwell insert coculture model in cachexia induction. To advance establishing experimental parameters, as a prelude to enable hiPSC-CM studies (12, 13), we first used adult rat CMs along with either a conventional protocol using cancer cell–conditioned media or a Transwell insert as an alternative approach in the context of cancer cachexia–induced cardiomyopathy. Two different colon cancer cell lines that are well established for their ability to induce cachexia were employed: C26 cells, widely recognized as the benchmark cachexia-inducing model and HCT116 cells, selected for further clinical relevance (20, 21). Experimental groups included control groups that received regular cardiac maintenance media, supernatant groups that received cancer cell–conditioned media, and the Transwell group that had cancer cells seeded on the insert bottom with CMs growing on the plate underneath (Figure 1B and Supplemental Figure 1A; supplemental material available online with this article; https://doi.org/10.1172/jci.insight.203276DS1). In each condition, the medium was freshly changed every 24 hours. Cachexia was confirmed by reduced CM diameter as a readout (Figure 1D). Both Transwell and supernatant groups exhibited significant reduction in CM diameter compared with the control group. CM diameter was reduced by approximately 32.95%, 40.2%, 39.69%, and 36.92% for C26 supernatant, C26 Transwell, HCT116 supernatant, and HCT116 Transwell groups, respectively (Figure 1C and Supplemental Figure 1B). The duration of this experiment was 2 days and was stopped owing to the observation of marked cell death predominantly in the cachectic groups that limited the study of extended cachexia duration or the study of CMs after cachexia cessation (post-cachexia phase). The experimental timeline is shown in Figure 1A. These findings highlight the limitation of the rodent CM system in studying cachexia over prolonged periods or in the post-cachexia phase.
Cachexia induction in rat CMs.Figure 1

Cachexia induction in rat CMs. (A) Experimental timeline. (B) Experimental grouping for the model (Control group: received regular CM maintenance media; Supernatant group: received cancer-conditioned media; Transwell group: cells were co-cultured with C26 or HCT116 cancer cell lines). (C) Representative image of the cachectic rat CMs using C26 or HCT116 colon cancer cells. Cells were stained with phalloidin and DAPI and imaged using confocal microscopy. Scale bar: 50 μm. (D) Reduction in diameter of cachectic rat CMs (n = 18–21 fiber/group). Data are presented as mean ± SEM from 3 independent experiments. ***P < 0.001 by ANOVA.

Cachectic hiPSC-CMs recapitulate the structural and morphological alterations of cancer cachexia–induced cardiac impairment. While the previously described cancer cachexia studies using rodents offer valuable insights into the pathology of cachexia-induced cardiac dysfunction (12, 13, 20, 21), this approach is limited by short survival time ex vivo. In addition, compared with in vivo studies, there is a need to understand the direct effect of cancer cachexia on the CMs, which is difficult to achieve with bulk analysis of the heart. We therefore developed a human-based, high-throughput, long-survival in vitro model of cancer cachexia–induced cardiac impairment using hiPSC-CMs to enable mechanistic studies and future therapeutic testing.

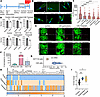
HiPSC-CMs were differentiated using hiPSCs and purified using glucose-free medium (Supplemental Figure 2 and Supplemental Video 1). The cancer cachexia setup consisted of either the pulse addition of conditioned media (supernatant group) or gradual release of cancer cell secretions (Transwell group), as described above (Figure 1A). The Transwell mimics in vivo kinetics with the presence of the tumor cells in the system and the continuous release in the media. The medium was refreshed every 24 hours for both treatments. The hiPSC-CMs were induced to develop cachexia using C26 cells (3 day protocol) or HCT116 cells (4 day protocol), as shown in the timeline (Figure 2A). Length of induction period was supported by the amount of secreted IL-6 as an established cachexokine from each cell line (Figure 2F) (22–25), together with evidence from previous studies that used C26 and HCT116 for cachexia induction (20, 26).
Cachectic hiPSC-CMs: morphological analysis and inflammatory response.Figure 2

Cachectic hiPSC-CMs: morphological analysis and inflammatory response. (A) Timeline of the experiment indicating cachexia phase. (B) Cell size reduction in cachectic hiPSCs-CM as shown in the representative immunofluorescence images stained with phalloidin and DAPI. Scale bar: 10 μm. (C) Summary of cell size reduction in cachectic hiPSC-CMs (n = 80–115/group). (D) Summary of nuclei number reduction in cachectic groups (supernatant and Transwell) in the 2 tested models (C26 or HCT116) (n = 6). (E) Representative images from control and cachectic hiPSCs-CMs showing cell death assessed using live/dead cell viability assay. Live cells were detected with calcein AM (green) dye and dead cells were detected using propidium iodide (red). Scale bar: 300 μm. (F) Summary of IL-6 protein expression in the media of cultured cells: C26 or HCT116 cells compared to hiPSC-CMs. (G) Violin plot of qPCR analysis of IL6 mRNA expression in C26 and HCT116 cells. (H) Heatmap of cytokine array measured in the collected media at the end of cachexia phase from C26-CM cachectic model. Data normalized using Z-score analysis (as explained in Methods). (I) Summary of qPCR analysis of IL6 mRNA expression in control and cachectic hiPSC-CMs (C26-CM cachectic model). Data are presented as mean ± SEM from 3 independent experiments. *P < 0.05; **P < 0.01; ***P < 0.001; ****P < 0.0001 by ANOVA (C and I) or paired t test (D).

HiPSC-CMs developed cancer cachexia using supernatant treatment or the Transwell system, characterized by significant reduction in CM area and decreased number of nuclei (Figure 2, B–D, and Supplemental Figure 3, A–F). Cell loss and dead cells as seen in live/dead imaging assay were observed in all the cachectic groups, with prominent areas of cell death seen in the supernatant group (Figure 2E).

Both treatments successfully induced cachexia in hiPSC-CMs, with cell area reduced by 33.45%, and 41.46% for supernatant and Transwell groups in the C26-treated group, respectively, and by 42.82%, and 45.51% for supernatant and Transwell groups in the HCT116-treated group, respectively (Figure 2C). These findings indicate that both C26 and HCT116 colon cancer cell lines can induce cardiac wasting through the release of pro-cachectic mediators to cause cardiac atrophy. Of note, with both cancer cell lines, there was a greater magnitude of atrophy when cardiac muscle was exposed to the Transwell inserts containing cancer cells compared with the supernatant group. On the other hand, decreased nuclei number and percentage of dead cells were more prominent in the supernatant group compared with the Transwell group with both the tested cell lines (Figure 2, C–E).

It is worth noting that transcriptomic analysis, carried out to further interrogate this phenotypic divergence, corroborated these findings. Compared with their respective controls, the Transwell condition yielded substantially more differentially expressed genes (DEGs) (2,168 unique genes) than the supernatant condition (107 unique genes), with 1,092 genes shared between both (Supplemental Figure 4A), indicating that the Transwell system elicits a quantitatively broader transcriptional response in the same biological direction. Notably, direct comparison between the two conditions did not yield significant differential expression, suggesting that the Transwell induces a more robust version of the same transcriptional program rather than a qualitatively distinct one.

Pro-cachectic mediators driving cardiac atrophy. As functions of IL-6 contributing to cachexia pathogenesis have been well established (22–25), we characterized the expression profile of IL-6 as a pro-cachectic mediator in the media collected from growing C26 or HCT116 tumor cell lines. IL-6 protein levels were higher in both tumor cell lines compared with controls (hiPSC-CMs), with C26 cells showing higher expression levels compared with HCT116 cells (Figure 2F). Similarly, IL6 mRNA levels were higher in C26 compared with HCT116 cells as measured by qPCR (Figure 2G).

We next analyzed a cytokine/myokine array panel in the media of cachectic groups compared to control cardiac muscle group in the C26-CM model at the end of the cachexia phase. This profile reflects the crosstalk between cancer cell secretion and the proinflammatory response of CMs during the cancer cachexia phase. Cytokine profiling revealed a unique pattern in inflammatory response in the media collected from cachectic hiPSC-CMs (Figure 2H). The inflammatory cytokines IL-1a, IL-1b, IFN-γ, IL-2, and TNF-α were higher in both cachectic groups compared with controls. Notably, IL-6 levels were 1,000-fold higher in the supernatant group (light orange) versus 150-fold higher in the Transwell group (gray) compared with controls (blue) (Figure 2H and Supplemental Figure 4B). Despite these quantitative differences in cytokine expression, the degree of cardiac atrophy observed was comparable in both conditions (Figure 2, B and C), suggesting that maximal atrophic signaling may occur even at lower cytokine thresholds. Additionally, IL6 mRNA levels were measured in the hiPSC-CMs at the end of the cachexia phase to assess the inflammatory response in the cachectic cardiac muscle compared to controls. Significant IL6 mRNA upregulation was detected in both cachectic groups, with the supernatant group showing higher IL6 expression levels (Figure 2I). This experiment thus identified a signature panel of cachexokines that are sufficient to drive CM atrophy in response to colon cancer growth, independent from secondary host responses.

Molecular drivers of cachectic CM atrophy. To further investigate the molecular basis of the cachectic phenotype, we performed bulk RNA-seq and analyzed differential gene expression (DEGs), focusing on canonical markers of CM stress. This analysis revealed significant upregulation of key stress-responsive genes, as well as pathways related to apoptosis and mitophagy (Supplemental Figure 5 and Supplemental Tables 1 and 2). Notably, expression of NPPB (BNP) and GDF15 was significantly increased, supporting the presence of a stress-induced, cachectic CM phenotype (27).

In parallel, we observed upregulation of DIABLO (SMAC) and CASP9, indicating activation of the apoptotic pathway (28). Additionally, increased expression of BNIP3 and BNIP3L (NIX) suggests enhanced mitophagy (29) (Supplemental Figure 5 and Supplemental Tables 1 and 2). Consistent with the transcriptomic findings, immunoblot analysis demonstrated significantly elevated BNIP3 protein levels in cachectic hiPSC-CMs compared with controls, further supporting activation of mitophagy pathways (Supplemental Figure 5D).

Together, these molecular changes complement the observed reduction in cell area and represent key contributors to the mechanisms underlying CM wasting.

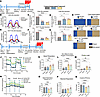
Contractile and metabolic deficits in cachectic hiPSC-CMs. Cardiac dysfunction has been described as a severe complication in the cachectic state as induced by different cancer entities in both experimental animals and humans, including tumors of the colon, lung, or pancreas (8, 10, 12, 30, 31). We paced cardiac cells to compare cells with the same rate, using C-pace IonOptix electrodes incubated in a gas-, humidity-, and temperature-controlled chamber, and compared cardiac contractility between control and cachectic hiPSC-CMs using a video-based method illustrated in Supplemental Figure 6, A and B. The contractile amplitude significantly decreased in the cachectic hiPSC-CMs (supernatant and Transwell groups) compared with the control hiPSC-CMs. This effect was consistently observed among both tested models (C26-CM and HCT116-CM). Moreover, the relaxation time of the cachectic hiPSC-CMs was significantly prolonged, with similar results in both models (Figure 3, A–G, and Supplemental Videos 2–7). These results are evidence that in vitro cancer cachexia induction in hiPSC-CMs can effectively replicate the contractile dysfunction observed clinically in patients with cancer cachexia (30). It is worth mentioning that irregular beats along with inability to follow the electrical pacing stimuli were noted in all cachectic groups, with a higher incidence in the Transwell group of either the C26- or HCT116-induced cachectic cardiac muscle (Figure 3H and Supplemental Figure 6C).
Contractile function and metabolic profile of cachectic cardiac muscle.Figure 3

Contractile function and metabolic profile of cachectic cardiac muscle. (A) Timeline of experiment indicating cachexia phase. (B) Representative muscle motion traces visualizing paced contraction curves of C26-induced cachectic hiPSC-CMs compared to controls. (C and D) Quantitative analysis of hiPSC-CM contraction amplitude and relaxation time in C26-induced cachectic hiPSC-CMs compared to controls. (E) Representative muscle motion traces visualizing paced contraction curves of HCT116-induced cachectic hiPSC-CMs compared to controls. (F and G) Quantitative analysis of hiPSC-CM contraction amplitude and relaxation time in HCT116-induced cachectic hiPSC-CMs compared to controls. (H) Proportion of arrhythmic hiPSC-CMs in response to C-pace electrode stimulation across all groups. Recorded videos were analyzed using the MUSCLEMOTION plugin and ImageJ software. Traces not following pace were excluded from data analysis. (I) Experimental timeline of the metabolic studies indicating cachexia phase. (J and N) Representative mean kinetic profile of OCR (J) and ECAR (N) in cachectic hiPSC-CMs (induced by conditioned media of C26 or HCT116 cells compared to control hiPSC-CMs receiving regular cardiac muscle maintenance media only or conditioned media from growing hiPSCs). Quantification of basal OCR (K), non-mitochondrial oxygen consumption (L), proton leak (M), percentage spare respiratory capacity (O), maximal respiration calculated as FCCP-stimulated OCR after subtraction of non-mitochondrial respiration (rotenone/antimycin A–insensitive OCR) (P), and coupling efficiency (Q) in cachectic and control hiPSC-CMs (n = 6–12 wells/group for each experiment). Data are presented as mean ± SEM from 3 independent experiments. *P < 0.05, **P < 0.01, ***P < 0.001, ****P < 0.001 by ANOVA.

Given that metabolism plays a fundamental role in cancer cachexia and could potentially drive cardiac contractile impairment (25, 32), we next assessed metabolic rates of the cachectic hiPSC-CMs using Seahorse technology. This experiment was done using conditioned media for cachexia induction, as the Seahorse plate is not compatible with Transwell inserts. We also used hiPSC-conditioned media (collected from growing hiPSCs) as an additional control group for this experiment to test whether regular cell metabolites will change CM metabolic rates. We observed significantly higher basal respiration, non-mitochondrial oxygen consumption, and proton leak levels in the cachectic hiPSC-CMs versus the control hiPSC-CMs (Figure 3, I–Q). However, because maximal respiration was not significantly altered, spare respiratory capacity and coupling efficiency of the cachectic hiPSC-CMs were significantly reduced compared with controls (Figure 3, J–Q). These data suggest an energy wasting condition associated with higher metabolic rates and inefficient energy utilization. To evaluate whether the increased basal respiration levels in the cachectic hiPSC-CMs can be attributed to proteins released from the cancer cells or are due to altered metabolites, we repeated the Seahorse experiment after boiling supernatants prior to media conditioning to denature proteins released from the cancer cells. Boiling the media abrogated the observed increase in basal respiration levels, resulting in comparable oxygen consumption rates (OCRs) between the cachectic and control hiPSC-CMs (Supplemental Figure 7, A–C).

LC3B and FBXO32/Atrogin-1, but not MuRF1, underlie atrophic remodeling in cachectic hiPSC-derived cardiac muscle. Studies of cachectic hearts have produced conflicting evidence as to whether autophagy or the ubiquitin-proteasome system (UPS) predominates, in contrast with skeletal muscle where the UPS and its E3 ligases, MuRF1 and Atrogin-1, have been clearly implicated (33), indicating tissue-specific regulation of proteolytic signaling. Notably, while some rodent models report MuRF1 and Atrogin-1 upregulation, others find no such induction (7, 34, 35). To date, no downstream substrates of these ligases have been described in human CMs or preclinical models, underscoring the unresolved molecular mechanisms governing cardiac proteolysis in cancer cachexia.

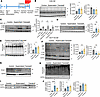
To gain molecular insight into the mechanisms of CM wasting in hiPSC-CMs, we investigated the two main protein degradative pathways involved in cardiac proteostasis, autophagy and the UPS (8, 25, 36). Relative LC3BII/LC3BI levels are used as a major marker of autophagic activity (30, 37), and an indicator of autophagosome abundance (37). We measured the LC3BII/LC3BI ratio to determine whether autophagy-mediated protein degradation contributes to cardiac wasting in cancer cachexia. Our results showed a marked reduction in LC3BI levels in cachectic hiPSC-CMs compared with control hiPSC-CMs across the 2 tested models (Figure 4, A, B, and F), suggesting LC3BI conversion to LC3BII. However, LC3BII levels remained comparable among all the investigated groups. Calculating the LC3BII/LC3BI ratio showed a significant increase in the cachectic hiPSC-CMs (Figure 4, B and F). However, since the LC3BII protein levels did not increase among the tested groups, we sought to investigate autophagic flux to determine whether the lack of elevation in LC3BII levels was due to increased autophagic flux or other upstream defects. To investigate this, we treated control and cachectic hiPSC-CMs with the autophagy inhibitor Bafilomycin A1 (200 nM) for 5 hours. This led to the accumulation of LC3BII, confirming that cachectic cells exhibit increased autophagic flux (Figure 4C). Together, these findings indicate increased autophagic flux in the cachectic hiPSC-CMs, supporting the role of autophagy in cardiac atrophy.
Protein degradation markers in control and cachectic hiPSC-CMs.Figure 4

Protein degradation markers in control and cachectic hiPSC-CMs. (A) Timeline of the experiment indicating cachexia phase. (B) Immunoblot analysis of LC3BI, LC3BII, and MuRF-1 in the C26 cachectic model, with corresponding quantification. (C) LC3BI and LC3BII levels following Bafilomycin A1 treatment in C26 cachectic model. (D) Immunoblot analysis of Atrogin-1 in the C26 cachectic model, with corresponding quantification. (E) Immunoblot analysis of global ubiquitinated proteins in the C26 cachectic model, with corresponding quantification. (F) Immunoblot analysis of LC3BI, LC3BII, and CnAα (32 kDa) in the HCT116-CM model, with corresponding quantification. (G) Immunoblot analysis of Atrogin-1 in the HCT116 cachectic model. (H) Immunoblot analysis of global ubiquitinated proteins in the HCT116 cachectic model. (I) Immunoblot analysis of MuRF-1 in the HCT116 cachectic model. (J) Quantification of Atrogin-1, MuRF-1, and ubiquitinated protein levels in the HCT116 cachectic model, normalized to GAPDH. Data are presented as mean ± SEM, experiments done in triplicate. *P < 0.05; **P < 0.01; ****P < 0.0001 by ANOVA.

We next examined the ubiquitin E3 ligases FBXO32/Atrogin-1 and TRIM63/MuRF1 as a striated muscle–specific UPS markers and critical regulators of skeletal muscle size and mass. Atrogin-1 and MuRF1 are well documented to be upregulated in cancer cachexia–induced skeletal muscle atrophy (33). Nonetheless, it remains unclear whether they are regulated in the same manner in human heart tissue (38). Therefore, we examined whether cancer cachexia induction in hiPSC-CMs would lead to an increase in Atrogin-1 and MuRF1 expression. Following cachexia induction, the expression of Atrogin-1 protein was elevated in the hiPSC-CMs in both the supernatant and Transwell groups (Figure 4, D, G, and J), consistent with directional, albeit non-significant, increased levels of FBXO32 mRNA by RNA-seq (Supplemental Figure 7D and Supplemental Table 1). In contrast, MuRF1 proteins levels remained unchanged between groups (Figure 4, B, I, and J), concordant with the absence of MuRF1 mRNA induction at the transcript level (Supplemental Figure 7E and Supplemental Table 1). Furthermore, the levels of ubiquitinated proteins demonstrated modest, but statistically significant, increase in cachectic hiPSC-CMs compared with control hiPSC-CMs (Figure 4, E, H, and J). Data from the two models (HCT116 and C26) showed similar results. These data suggest that increased UPS-mediated protein degradation is contributing to the observed cardiac muscle atrophy in the cachectic hiPSC-CMs. Overall, these results demonstrate that the autophagy effector LC3B and the ubiquitin ligase FBXO32/Atrogin-1 are important regulators of protein degradation during cachectic atrophic remodeling of the heart.

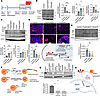
FOXO signaling activation in cachectic hiPSC-CMs. To determine whether FOXO1/3 activation underlies these changes, we examined FOXO1/3 phosphorylation status and FOXO1 subcellular localization. Western blot analysis revealed a significant reduction in the ratio of p-FOXO1 (Ser256) to total FOXO1 and p-FOXO3 (Ser318/321) to total FOXO3 in cachectic hiPSC-CMs compared with controls (Figure 5, A–C), indicating reduced inhibitory phosphorylation and thus net FOXO activation. Consistent with this, immunofluorescence analysis of FOXO1 demonstrated a shift toward nuclear localization in cachectic hiPSC-CMs relative to controls (Figure 5D), confirming transcriptional activation of FOXO1 in response to cachectic stimuli.
FOXO/CnA signaling axis studies in hiPSC-CMs.Figure 5

FOXO/CnA signaling axis studies in hiPSC-CMs. (A) Timeline of the experiment indicating cachexia phase. (B) Immunoblot analysis of FOXO1 and p-FOXO1 (S256) along with normalized (p-FOXO1 [S256]/total FOXO1) ratio relative protein quantification. (C) Immunoblot analysis of FOXO3 and p-FOXO3 (S318/S321) along with normalized (p-FOXO3 [S318/S321]/total FOXO3) ratio, shown below the representative blot. The relative expression ratio was set as 1 in control group. All blots derived from the same experiment were processed in parallel on 2 blots. (D) Top: Immunofluorescence confocal imaging for control and cachectic hiPSC-CMs. Cells stained with DAPI and FOXO1. Scale bars: 50 μm (main image) and 2.5 μm (inset). Bottom: Schematic illustration showing the relationship between FOXO activation and its subcellular localization. (E) Immunoblot analysis of CnAα (32 kDa) levels in C26-CM model and its quantification shown below. (F) Schematic illustration of CnA structure, activation, and the constitutively active form of CnA. (G) Immunoblot analysis of CnAα (60 kDa) levels using antibody specific for the N-terminus of CnAα. (H) Schematic illustration for CnA phosphatase activity and NFAT downstream effect. Data are presented as mean ± SEM, experiments done in triplicate. *P < 0.05; **P < 0.01; ***P < 0.001 by ANOVA.

Kyoto Encyclopedia of Genes and Genomes (KEGG) pathway analysis of the FOXO signaling pathway (Supplemental Figure 8A) further revealed convergence of both IL-6 and Atrogin-1 on FOXO (39), providing pathway-level support for a mechanistic link between cachectic inflammatory signaling and atrogene induction in our hiPSC-CM model.

Calcineurin A/NFAT pathway in the atrophic cardiac muscle. We next tested whether Atrogin-1 upregulation induces cardiac atrophy in response to cancer cachexia and plays a role in the cardiac wasting and contractile dysfunction. Among targets of Atrogin-1 in striated muscle, calcineurin A (CnA), a calcium/calmodulin–dependent serine/threonine protein phosphatase, is prominent because of its role in coordinating CM gene expression programs that determine cell size in the context of cardiac hypertrophy (38, 40, 41). To investigate this axis in the context of cardiac atrophy, we measured α-calcineurin A (CnAα) levels among groups. Strikingly, CnAα levels showed a distinct pattern in the cachectic groups of the tested models. We observed a significant reduction in the CnA ~32 kDa band, which is indicative of the active constitutive form of CnAα (42, 43) (Figure 4F and Figure 5, E and F). This form has been previously reported in various cell types and represents the catalytic functional domain of the catalytic subunit (42, 43). In addition, we observed high-MW bands exclusively in cachectic groups, suggesting a modified form of the protein that resulted from cachexia induction (Figure 4F and Figure 5E). Together with the upregulated Atrogin-1 (E3 ligase), this may indicate ongoing ubiquitination of CnAα (44). Consistent with this, ubiquitin enrichment (ubiquitin immunoprecipitation) revealed altered CnA ubiquitination between experimental conditions (Supplemental Figure 8, B and C). Furthermore, we utilized another anti-CnAα antibody that targets the N-terminal region of CnAα, detecting the full-length CnAα (60 kDa). Notably, the full-length CnAα exhibited a significant reduction in protein levels compared with control hiPSC-CMs (Figure 5G). Based on these results, we propose that Atrogin-1 induces cardiac atrophy in response to cancer cachexia via degradation of CnA. Additionally, reduced CnAα levels could underlie the observed decreased CM size and the contractile dysfunction possibly through the downstream nuclear factor of activated T cells (NFAT) signaling.

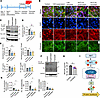
NFAT signaling in cachectic hiPSC-CMs. Given that cancer cachexia disrupted the Atrogin-1/CnA axis in the cardiac muscle, we speculated that this might affect the CnA/NFAT pathway in the cachectic cardiac muscle. CnA directly activates NFAT nuclear translocation and transcriptional activity (45). Nuclear translocation of NFAT occurs rapidly after dephosphorylation by CnA and is required for its transcriptional activity (41) (Figure 5H). Towards this end, we evaluated NFAT protein localization and expression by immunostaining at the end of the cachexia phase with an antibody against NFATc4. Nuclei were counterstained with DAPI (Figure 6B). Cachexia induction led to increased cytoplasmic localization of NFATc4 in the cachectic hiPSC-CMs across both models. In addition, NFATc4 staining was confined to the nucleus in control hiPSC-CMs (Figure 6B), suggesting the effect of Atrogin-1 on CnA activity and cardiac atrophy is cell autonomous. Taken together, these results suggest that the upregulated Atrogin-1 can affect NFAT signaling via CnA regulation in the context of cardiac atrophy.
NFAT localization and AKT/mTOR signaling in cachectic hiPSC-CMs.Figure 6

NFAT localization and AKT/mTOR signaling in cachectic hiPSC-CMs. (A) Timeline of the experiment indicating cachexia phase. (B) Immunofluorescence confocal imaging for control and cachectic hiPSC-CMs. Cells stained with DAPI, phalloidin, and for NFATc4. Scale bar: 20 μm. (C–E) Immunoblot analysis of pan AKT, p-AKT (S473) and (Thr308) along with their normalized quantification, and p-AKT (S473 or Thr308)/pan AKT ratio. The relative expression ratio was set as 1 in control group. All blots derived from the same experiment were processed in parallel on 2 blots. (F and G) Immunoblot analysis of total S6 and p-S6 (S240/244) with their quantification, and p-S6 (S240/244)/total S6 ratio. (H) Log2CPM of RPTOR gene expression derived from RNA-seq data, HCT116-CM cachectic model. Data from supernatant and Transwell conditions were pooled; red dots represent supernatant and blue dots represent Transwell samples. (I) Schematic illustration of the AKT/mTORC1/S6 signaling axis showing the sequential phosphorylation of AKT and S6 leading to enhanced protein synthesis. Data are presented as mean ± SEM, experiments done in triplicate. *P < 0.05, **P < 0.01 by ANOVA (D–G) or t test (H).

Given that CnA is a protein phosphatase, we tested the effect of a dysregulated Atrogin-1/CnA axis on cardiac muscle protein phosphorylation. We used the Pro-Q Diamond global phosphorylated protein probe with SYPRO Ruby total protein stain to evaluate differential phosphorylation in cachectic versus control hiPSC-CMs. The cachectic samples displayed increased phosphorylation of a protein band migrating between 110 and 170 kDa (Supplemental Figure 9, A–C), consistent with reduced phosphatase activity resulting from decreased CnA levels (46). Although the specific protein was not identified by mass spectrometry, this band corresponds to the expected molecular weight range of NFAT family members (47). However, we acknowledge that definitive identification of the affected phosphoprotein(s) will require detailed phosphoproteomic mass spectrometry analysis.

Additionally, our RNA-seq analysis revealed downregulation of established NFAT-regulated genes (Supplemental Figure 9, D–F, and Supplemental Table 1), including VCAM1 (log2FC –2.18), MYOCD (log2FC –1.63), and PRLR (log2FC –4.02), each previously validated as regulated by NFAT signaling (48-50), supporting reduced NFAT transcriptional activity downstream of CnA deficiency. Together, the convergence of reduced CnA expression, NFAT cytoplasmic retention, and suppression of NFAT-responsive genes supports a functional deficit in CnA/NFAT signaling and provide additional evidence that CnA plays a significant role in the pathogenesis of the cachectic cardiac muscle, which ultimately leads to cardiac atrophy. We have investigated other potential Atrogin-1 targets, α-actin (51) and CHMP2B (52, 53), but in contrast to CnA, the protein levels of α-actin or CHMP2B were not affected in cachectic hiPSC-CMs compared to controls (Supplemental Figure 10, A–C).

To further investigate pathways potentially linked to Atrogin-1 signaling, we assessed ER stress–related transcripts (53) using our RNA-seq dataset. This analysis revealed increased EIF2AK3 (PERK) alongside upregulation of ER-associated degradation and ER proteostasis components, without consistent induction of canonical markers such as HSPA5 (BiP) or DDIT3 (CHOP) (Supplemental Figure 11 and Supplemental Table 1).

Decreased AKT/mTOR anabolic signaling in hiPSC-CMs. To comprehensively evaluate the contribution of anabolic signaling to proteostatic dysregulation, we assessed the AKT/mTOR protein synthesis axis at the protein, phosphorylation, and transcriptional levels in cachectic hiPSC-CMs (Figure 6, C–I). Western blot analysis revealed a significant reduction in pan AKT protein expression in cachectic hiPSC-CMs. Phosphorylation of AKT at Ser473 was also significantly decreased in cachectic cells. Phosphorylation at Thr308 showed a significant reduction in the supernatant group, with a consistent trend in the Transwell group (P = 0.0508); however, the p-Ser473 or p-Thr308/pan AKT ratio did not reach statistical significance across groups (Figure 6, C–E). Collectively, the reduction in pan AKT protein, rather than phosphorylated-to-total ratio, indicates a diminished anabolic capacity of the system as opposed to a selective activation deficit. Downstream of AKT, we evaluated mTORC1 activity through the canonical mTOR/ribosomal protein S6 (S6) signaling axis. Total S6 protein levels were not significantly different between groups (Figure 6, F and G). However, p-S6 (Ser240/244), a direct substrate of S6K1 and a well-established readout of mTORC1-driven translational capacity (54), was significantly reduced in cachectic hiPSC-CMs (Figure 6, F and G). Consistently, the p-S6/total S6 ratio was significantly lower in cachectic groups compared with controls (Figure 6, F and G), confirming attenuated mTORC1 activity at this node of translational regulation.

To determine whether the observed signaling suppression was reinforced at the transcriptional level, we interrogated our RNA-seq dataset for the expression of core AKT/mTOR pathway components. The RPTOR gene, encoding Raptor, the defining scaffold and substrate-recruiting subunit of mTORC1 required for S6K1 and 4E-BP1 phosphorylation (55), was significantly downregulated in cachectic hiPSC-CMs (log2FC –1.25; FDR = 0.0071) (Figure 6H and Supplemental Table 1). This transcriptional reduction, coinciding with decreased p-S6/total S6 ratio and total AKT protein, indicates that AKT/mTORC1/S6 anabolic signaling is suppressed in a multi-tiered manner in response to cancer cachexia stimuli.

To determine whether these signaling alterations translated into defects in protein synthesis/elongation, we performed the SUnSET assay, which assesses global puromycin incorporation (56). Protein synthesis was modestly reduced in cachectic cells; however, this difference did not reach statistical significance under our experimental conditions (Supplemental Figure 12). These data indicate that bulk protein synthesis is not overtly collapsed under our experimental conditions.

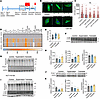
Post-cachexia studies. We next evaluated the hiPSC-CM recovery from muscle wasting. Thus, we removed the conditioned media and the insert with the tumor cells growing and changed media to regular cardiac maintenance media for 1 week. Morphological measurements done at the end of the 1-week period revealed that cells recovered from significant size reduction, and cell sizes were not significantly smaller relative to controls (Figure 7, A–C).
Post-cachexia studies in hiPSC-CMs: morphological, inflammatory, and proteiFigure 7

Post-cachexia studies in hiPSC-CMs: morphological, inflammatory, and protein degradation. (A) Timeline of the experiment indicating post-cachexia phase. (B) Cell size comparison in post-cachectic hiPSC-CMs as shown in the representative immunofluorescence images stained with phalloidin and DAPI. Scale bar: 10 μm. (C) Cell size of post-cachectic hiPSC-CMs (n = 70–140/group). (D) Heatmap of cytokine profile measured in the collected media at the post-cachexia phase (C26-CM model); data were normalized as a percentage of control (control = 100%) (as explained in Methods). (E) qPCR analysis of IL6 mRNA expression in post-cachectic hiPSC-CMs (C26-CM model). (F–G) Immunoblot analysis for the LC3BI and LC3BII levels (F), Atrogin-1 and global ubiquitinated proteins (G), in C26 post-cachectic model. (H) Quantification of data in F and G, normalized to GAPDH. (I and J) Immunoblot analysis for the LC3BI/LC3BII and global ubiquitinated proteins levels (I) and Atrogin-1 levels (J) in HCT116 post-cachectic model. (K) Quantification of results in I and J normalized to GAPDH, n = 3–4 samples/group. Data are presented as mean ± SEM, experiments done in duplicate. *P < 0.05, **P < 0.01, ***P < 0.001, ****P < 0.0001 by ANOVA.

Similar to the cachexia phase, media collected from cultured cardiac muscle in the post-cachexia phase after cachexia cessation in the C26-CM model were used to assess levels of the cytokine/myokine array. Cytokine levels mostly returned to baseline after the 1-week time point, although IL-6 levels retained modestly but non-significantly elevated compared to the controls at the 1-week remission time point (Figure 7, D and E). However, these IL-6 levels were markedly decreased compared with IL-6 levels during the cachexia phase (Supplemental Figure 4C).

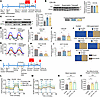
Importantly, to assess whether any sequelae of disrupted protein degradation remained at the molecular level, we evaluated the hiPSC-CMs in the post-cachexia phase. The LC3BII/LC3BI ratio among the cachectic groups was comparable to the control levels (Figure 7, F, I, and K). Atrogin-1 protein levels were normal as compared to controls (Figure 7, G, J, and K). Similar to the results observed during the cachexia stage, MuRF1 levels showed no significant differences (Supplemental Figure 13). Moreover, global ubiquitinated protein levels exhibited no significant differences across the tested groups in both models (Figure 7, G, I, and K). Altogether, these results indicate cachexia remission of the hiPSC-CMs at the protein degradation molecular level. Tracking the post-cachectic hiPSC-CMs after Atrogin-1 levels returned to normal revealed no significant difference between CnA levels among control and post-cachectic cardiac muscle (Figure 8, A–C).
Post-cachexia studies in hiPSC-CMs: molecular, functional, and metabolic.Figure 8

Post-cachexia studies in hiPSC-CMs: molecular, functional, and metabolic. (A) Timeline of the experiment indicating post-cachexia phase. Immunoblot analysis of CnAα protein levels for C26-CM (B) and HCT116-CM (C) post-cachectic models, with their quantified values normalized to GAPDH. (D) Representative muscle motion traces visualizing paced contraction curves of C26-CM model in post-cachexia stage compared to controls. (E and F) Quantitative analysis of hiPSC-CM contraction amplitude and relaxation time in the C26-CM model in post-cachexia stage. (G) Representative muscle motion traces visualizing paced contraction curves of HCT116-CM model in post-cachexia stage compared to controls. (H and I) Quantitative analysis of hiPSC-CM contraction amplitude and relaxation time in the HCT116-CM model in post-cachexia stage compared to controls. (J) Proportion of arrhythmic hiPSC-CMs in response to C-pace electrode stimulation across all groups. Recorded videos were analyzed using the MUSCLEMOTION plugin and ImageJ software. Traces not following pace were excluded from data analysis. (K) Experimental timeline of the metabolic studies indicating post-cachexia phase. (L and M) Mean kinetic profile of OCR and ECAR in C26- or HCT116-CM models at the 1-week time point. Quantification of (N) basal OCR and (O) non-mitochondrial oxygen consumption for the C26-CM or HCT116-CM model at the 1-week time point. Data are presented as mean ± SEM; experiments done in triplicate. *P < 0.05; **P < 0.01; ***P < 0.001; ****P < 0.001 by ANOVA.

The metabolic and functional deficits observed in the cachectic cardiac muscle further prompted us to evaluate hiPSC-CMs in the post-cachexia phase, considering the clinical characteristics of cancer survivors (30, 57). The functional deficit persisted (Figure 8, D–J, and Supplemental Videos 8–13), reflecting the residual impaired cardiac function observed in cachectic patients even after cancer removal, which contributes to decreased survival in this population (30, 57). Regarding the metabolic phenotype, the upregulated basal respiration persisted even after the removal of the conditioned media with its secreted proteins and cachectic factors and the regular media change using the cardiac maintenance media for 1 week (Figure 8, K–O). This suggests that cachexia induction induced a sustained metabolic dysregulation that might be contributing to the long-term cardiac dysfunction.

To address whether irreversible mitochondrial damage underlies the persistent metabolic phenotype following cachexia remission, we assessed both mitochondrial content and dynamics. Mitochondrial content was estimated via the mitochondrial-to-nuclear DNA (mtDNA/nDNA) ratio. While a trend toward increased mtDNA content was observed in the cachectic condition, this did not reach statistical significance (Supplemental Figure 14A), which may reflect accumulation of damaged organelles, or a compensatory response.

To further characterize mitochondrial dynamics, we quantified key regulatory proteins governing both fission (DRP1) and fusion (OPA1, Mitofusin-1), as well as the outer membrane import receptor TOM20 as an index of mitochondrial content (58, 59). The supernatant group exhibited significantly reduced expression of the TOM20 and Mitofusin-1 proteins compared with controls, whereas these reductions were not statistically significant in the Transwell group. OPA1 expression was reduced in all cachectic groups versus controls, while DRP1 protein abundance remained unchanged (Supplemental Figure 14B). Together, these findings indicate alterations in mitochondrial homeostasis during the cachexia remission phase, characterized predominantly by impaired mitochondrial fusion with limited evidence for changes in the fission machinery.
Discussion

We investigated the mechanism of tumor-initiated cardiac wasting–based cardiomyopathy using a high-fidelity hiPSC-CM cancer cachexia induction/remission system. Here, hiPSC-CMs recapitulated the cancer cachexia–induced cardiac wasting cardiomyopathy observed in humans (30). The main findings of this study include elucidating a direct effect of tumor cells to induce cardiac wasting, all in the absence of cardiotoxic treatments. This distinction is important, as antitumor treatments are themselves well known to cause cardiac disease, leaving the tumor-dependent component unclear (60, 61). Specifically, in this hiPSC-CM platform, our data show cardiac wasting involves increases in autophagic flux, via increases in the LC3BII/LC3BI ratio together with increases in E3 ligase Atrogin-1–mediated ubiquitination, along with suppression of the AKT/mTORC1/S6 anabolic signaling pathway and activation of FOXO1/3 transcription factors. Mechanistically, a distinct cardiac wasting signaling pathway emerges wherein we propose that the increased Atrogin-1 leads to degradation of CnA that, in turn, prevents the nuclear localization of the cardiac growth transcriptional regulator NFAT. We reasoned that the cytoplasmic retention of NFAT, caused by the cancer cachexia milieu, and in the absence of cardiotoxic interventions, can account for cardiac muscle wasting, as well as contributing to the consequent metabolic and contractile dysfunction, which are the hallmarks of cancer-mediated cardiomyopathy (3, 15, 25, 30, 62).

These cardiac wasting findings reveal a complex interplay wherein both the autophagy and UPS pathways are implicated, with Atrogin-1, but not MuRF1, emerging as a critical player in the UPS pathway within the cancer cachexia cardiac wasting context. Atrogin-1 has been widely studied in skeletal muscle, where it regulates muscle atrophy by targeting Myo-D, a key transcription factor that is absent in cardiac tissue (51). However, in the heart, and only under the conditions of cardiac hypertrophy, has Atrogin-1 been previously shown to target CnA (40). Our findings provide insights into the Atrogin-1/CnA axis and its role in modulating molecular mechanisms of cardiac atrophy in cachectic hiPSC-CMs.

Notably, this study advances previous research on CnA that primarily focuses on cardiac hypertrophy, whereas here we present data supporting CnA’s involvement in the pathological progression of cardiac atrophy. CnA is a calcium-dependent phosphatase and a known regulator of NFAT activity. CnA’s action entails the dephosphorylation of NFAT, promoting its nuclear translocation to induce gene expression leading to cardiac muscle growth (40, 63, 64). In cachectic cardiac muscle, we report that the altered CnA levels markedly impair nuclear translocation of NFAT, suggesting disrupted signaling limiting NFAT transcriptional activity. These data suggest that cardiac atrophy and altered gene expression observed in the cancer-induced cardiomyopathy conditions are caused at least in part by this altered NFAT localization and hence transcriptional dysregulation. It is noteworthy that the NFAT transcription factor acts synergistically with other transcription factors, including NF-κB, AP-1, GATA-4, and MEF-2, to assemble higher-order transcriptional complexes affecting cardiac remodeling (65). Given the established role of NF-κB in cancer cachexia–induced skeletal muscle wasting (66), this interconnected regulatory network presents avenues for studying transcription factors contributing to skeletal and/or cardiac muscle wasting. This highlights the broader contribution of Atrogin-1, CnA, and NFAT in cardiac remodeling. This finding fits well with the recently introduced concept of hypertrophy regression, which involves the reversal of cardiac hypertrophy (67). Hypertrophy regression shares several common signaling pathways with cardiac atrophy but lacks evidence on Atrogin-1/CnA/NFAT axis involvement, a gap we address here.

It is worth noting that Atrogin-1 exhibits context-dependent roles in cardiac and skeletal muscle, reflecting differences between physiological remodeling, aging, and catabolic stress. Specifically, in previous studies, Atrogin-1 was shown to be necessary and sufficient for adaptive remodeling in the heart. Here, global knockout mice developed severe age-related cardiomyopathy and premature death associated with impaired autophagy, CHMP2B accumulation, and ER stress, while CM-specific overexpression reduced fibrosis, collagen deposition, and enhanced FOXO1/3 activity in aged hearts (52, 53). Although these studies did not focus on cachexia, they illustrate the protective role of Atrogin-1 in maintaining proteostasis and adaptive remodeling under physiological or aging conditions. In contrast, in catabolic states such as cancer cachexia, Atrogin-1 is consistently upregulated and functionally linked to skeletal muscle and cardiac muscle wasting. Genetic deletion or inhibition of Atrogin-1 has been shown to attenuate skeletal muscle atrophy in cancer cachexia and other catabolic conditions (68, 69), while cancer-associated cachexia models report increased Atrogin-1 expression in cardiac tissue, correlating with enhanced proteolysis and atrophy (34). Collectively, these findings suggest that Atrogin-1 functions in a highly context-dependent manner: protective under adaptive remodeling and aging, but contributory to pathological atrophy under persistent catabolic stress.

Our data indicate that autophagic flux is elevated in the setting of cancer cachexia–induced cardiomyopathy. We observed a decreased level of LC3BI, although LC3BII exhibited comparable levels to controls, resulting in an elevated LC3BII/LC3BI ratio. This suggests either a block in autophagic degradation or increased autophagic flux. To test this, we treated CMs with Bafilomycin A1, a lysosomal inhibitor. The resulting build-up of LC3BII upon Bafilomycin A1 treatment supports the conclusion that autophagosomes are actively formed under cachectic conditions, indicating an increase in autophagic flux, consistent with previous cancer cachexia–induced cardiomyopathy studies (7, 34). Although autophagy is critical for maintaining cellular homeostasis, persistently elevated autophagy can culminate in cardiac cell loss (70). Thus, these findings support the hypothesis that excessive or dysregulated autophagy contributes to cardiac muscle wasting in cancer cachexia.

Importantly, the concurrent activation of both the autophagy-lysosome and Atrogin-1 ubiquitin E3 ligase indicates a coordinated action of proteolytic/degradative systems in cachectic hiPSC-CMs. While autophagy and UPS are essential for cellular quality control, their persistent or dysregulated activation in cancer cachexia likely contributes to pathological cardiac atrophy and functional decline. These findings suggest that targeting these proteolytic pathways may offer therapeutic potential in mitigating cardiac muscle loss in cancer cachexia.

Moreover, our findings advance the phenotypic investigation of cancer cachexia–induced CM atrophy by identifying key molecular contributors underlying this process. The upregulation of NPPB and GDF15 is consistent with a well-established cardiac stress response and supports the presence of a pathophysiological relevant phenotype in cachectic hiPSC-CMs (27).

Importantly, the concurrent activation of apoptotic (DIABLO and CASP9) and mitophagy-related (BNIP3 and BNIP3L) pathways suggests that cardiac myocyte loss in this model is mediated in part by coordinated mitophagy and cell death signaling (27–29). Collectively, this strengthens the translational relevance of the model by linking phenotypic changes to established molecular drivers of cardiac remodeling and cachexia.

Additionally, our data provide evidence for FOXO1/3 activation in cachectic hiPSC-CMs, as reflected by decreased inhibitory phosphorylation ratios at Ser256 (FOXO1) and Ser318/321 (FOXO3) and by nuclear accumulation of FOXO1. Notably, pan-AKT protein levels were significantly reduced in the cachectic groups, accompanied by decreased phosphorylation at both Ser473 and Thr308. Importantly, the p-AKT/total AKT ratios were not significantly different between groups, suggesting that the reduction reflects a globally diminished AKT pool rather than selective loss of kinase activation, indicative of reduced system capacity and not altered activation stoichiometry (71). Phosphorylation of FOXO1/3 by AKT promotes their cytoplasmic retention and transcriptional silencing; accordingly, a diminished AKT pool would be expected to attenuate inhibitory FOXO phosphorylation and permit nuclear translocation (69, 72).

Nuclear FOXO1 is a well-established driver of atrophy, transcriptionally inducing components of both the ubiquitin-proteasome and the autophagy-lysosome pathways (69, 73). Taken together, these findings support a model in which cachectic stimuli suppress AKT abundance and activity, relieving FOXO1/3 inhibition and driving a coordinated proteolytic gene program in CMs. Beyond FOXO derepression, the contracted AKT pool simultaneously attenuates mTORC1-driven anabolic signaling (74), as reflected by significantly reduced p-S6 (Ser240/244)/total S6 ratios and transcriptional downregulation of RPTOR, the mTORC1 scaffold, in cachectic hiPSC-CMs. These findings are consistent with previous studies demonstrating that cachexia-associated muscle wasting and cardiac atrophy can involve impaired AKT/mTOR signaling (34, 75). Altogether, these data indicate that AKT loss imposes a dual proteostatic insult: relieving inhibitory constraint on FOXO-driven proteolysis while concurrently suppressing the mTORC1/S6 axis.

It is worth noting that the divergence between Atrogin-1 protein elevation and the absence of MuRF1 induction is consistent with their differential regulation downstream of the AKT/mTOR/S6 axis, as demonstrated previously by Mori et al. (76). The reduced AKT activity and decreased p-S6 (Ser240/244)/total S6 ratio observed in cachectic hiPSC-CMs provide a mechanistic basis for this selective effector pattern.

The observed IL-6–rich cachectic environment may further amplify FOXO-driven atrogene expression through at least two converging mechanisms. IL-6 signaling can reduce AKT activity or activate JAK/STAT3 (77), which allows FOXO transcription factors to enter the nucleus and activate atrogene expression. The topological convergence of IL-6 and atrogin-1 on FOXO by KEGG pathway mapping reinforces the view that inflammation and proteolytic activation are mechanistically coupled in this cancer cachexia–induced cardiomyopathy.

This study provides other important contributions to the field. A notable advance is that we employed the Transwell system in the context of cancer cachexia–induced cardiac impairment, enabling discovery of paracrine interactions via cancer cells. Importantly, the Transwell system, where cancer cells are co-cultured in proximity without direct contact, induces more pronounced cardiac atrophy and greater degree of non-responsive hiPSC-CMs to pacing stimuli and irregular beats, suggesting that the presence of cancer cells in close proximity may exacerbate cachexia and functional deficits. These findings suggest that cell-cell communication within the tumor microenvironment may involve complex signaling mechanisms beyond soluble factors, potentially including exosome-mediated transfer or direct membrane interactions (78).

Additionally, we report an increase in cell loss within the supernatant groups where we used conditioned media to induce cachexia. This higher degree of cell death in the conditioned media–treated cardiac muscle may impact the experimental outcomes by potentially skewing functional assessments, particularly with respect to the remaining viable cell population. This observation is particularly important, as it suggests that the conditioned media system, while inducing cachexia, may inadvertently introduce confounding variables due to the elevated cachexokine levels and elevated cell death, which could mask phenotypic changes. On the other hand, although the Transwell system showed slightly more pronounced cell size reduction, it preserves a larger proportion of cells, making a more stable platform. Thus, while both systems successfully induce cachexia, the Transwell setup offers distinct advantages in terms of reducing excessive cell loss and providing clearer insights into atrophic remodeling in hiPSC-CMs.

The greater atrophy observed in the Transwell system is likely explained by its biological configuration, enabling continuous bidirectional signaling between cancer cells and CMs. Consistent with this, cytokine profiling reveals relative enrichment of several factors linked to muscle wasting and adverse cardiac remodeling in the Transwell condition, including increased myostatin, a well-established inducer of skeletal and cardiac muscle atrophy (79). Osteocrin (OSTN), reported to negatively regulate cardiac hypertrophy in overexpression models (80), and FGF21, implicated in attenuation of cardiac hypertrophy and associated with severity of cardiac dysfunction (81), are similarly enriched in the Transwell system. Together, these factors suggest that the Transwell system activates a broader procatabolic and proremodeling signaling milieu that may extend beyond canonical IL-6/Atrogin-1 pathways.

Additional contributions here reside in the fact that most cancer cachexia rodent studies show a decrease in metabolic rates in both skeletal and cardiac muscle (82, 83), which stands in contrast to the clinical presentation of patients with cachexia (62, 84), who generally have higher metabolic rates. Cachectic hiPSC-CMs more closely replicate the human clinical phenotype, wherein we observe significantly higher OCR in the cachectic cardiac muscle. This finding suggests that elevated metabolic activity may be a characteristic feature of cachectic CMs. This increased OCR points towards the possibility of a “futile metabolic cycle,” wherein energy is consumed without being effectively utilized, potentially contributing to the rapid muscle wasting seen in cachexia. This metabolic dysregulation may also help explain the heightened energy expenditure in cachectic patients, offering insights into the pathophysiological mechanisms underlying cardiac muscle metabolism during cachexia. Cachectic hiPSC-CMs therefore offer a valuable platform for studying cachexia metabolic consequences, as this system aligns more closely with the clinical presentation of patients with cachexia.

Another key advancement of using hiPSC-CMs is that they not only captured the morphological, functional, and metabolic phenotypes of human cancer cachexia–induced cardiomyopathy, they also extended to the post-cachexia phase. This provides the opportunity to investigate mechanisms of remission, recovery, or any residual sequelae or deficit following cachectic insult. This is important, as this area is largely underexplored in the context of cardiac muscle biology.

In summary, our findings point to tumor-initiated alterations in cardiac proteostasis with emphasis on the role of the Atrogin-1/CnA/NFAT signaling axis, providing a mechanistic pathway for cancer cachexia–induced cardiac wasting–based cardiomyopathy. This finding is evident in the absence of effects due to cardiotoxic treatments. Accordingly, these tumor milieu–mediated results provide avenues for future therapeutic interventions to significantly improve patient outcomes and reduce the cardiovascular burden on cancer patients and survivors.

Methods

Sex as a biological variable. Female rats were used because the isolation protocol has been optimized for female animals. Based on past work, findings are expected to be comparable in males and females (85, 86).

HiPSC culture and differentiation. We used the DF 19-9-11 cell line (Wicell) (87). HiPSCs were cultured and differentiated to CMs using established protocols (88–90).

Rat ventricular CM isolation and primary culture. Adult female rat ventricular CMs were isolated from Sprague-Dawley rats using previously described enzymatic digestion methods (85, 86).

Tumor cell lines. C26 mouse adenocarcinoma cells (Division of Cancer Treatment and Diagnosis Tumor Repository, National Cancer Institute) and HCT116 adult human male colorectal carcinoma cells (ATCC, CCL-247) were cultured in RPMI1640 with 5% FBS and 1% penicillin-streptomycin at 37°C with 5% CO2.

Cachexia induction. Cachexia was induced using conditioned medium or co-culture of tumor cells with hiPSC-CMs via Transwell inserts (Corning, 353494), where insert membranes with 0.4 μm pores of tissue culture–treated polyethylene terephthalate (PET) are placed on the top of the hiPSC-CM culture plates (Figure 1B and Supplemental Figure 1A) (26).

Tumor cells were seeded in their growth media in the Transwell inserts or plastic plates at 10%–15% confluence and left for overnight attachment. The medium was removed the next day, and the cells were washed twice with sterile PBS and incubated in hiPSC-CM maintenance media (RPMI1640 with B27+ [Thermo Fisher Scientific, 17504044]). For the supernatant group, after 24 hours, the media were collected and centrifuged at 4696g for 10 minutes, and the collected media were used as conditioned media for cachexia induction (30% of the total hiPSC-CM maintenance media). For the Transwell group, fresh media were changed the day of the experiment on the Transwell and then the insert was co-cultured with hiPSC-CMs. The control group was fed with fresh hiPSC maintenance media. These steps were repeated daily for the duration of the cachexia induction. Three- and 4-days protocols were followed for inducing cachexia with C26 and HCT116 cells, respectively (20, 26).

Studying the post-cachexia remission was done by changing media to fresh hiPSC-CM maintenance media for all groups, media changes were done every 2 days, and cells were tracked for 1 week in the remission stage.

A summary of the timeline and groups is shown in Figures 1, 2 and 7.

Metabolic flux analysis. OCRs and extracellular acidification rates (ECAR) were measured using a Seahorse XFe96 Analyzer following sequential treatment with oligomycin, FCCP, rotenone, and antimycin A.

Electrical stimulation and live-cell imaging. HiPSC-CMs were electrically paced using an IonOptix C-Pace system, and contractile activity was recorded by live-cell microscopy under controlled physiological conditions. Videos were analyzed using the MUSCLEMOTION plugin for FIJI ImageJ (91).

Western blotting, protein quantification, and immunoprecipitation. Proteins were extracted using RIPA buffer. Immunoprecipitation was performed using protein G agarose beads and indicated antibodies. Detailed steps and antibody list are provided in Supplemental Methods.

Autophagic flux assessment. Bafilomycin A1 (Cell Signaling Technology, 54645; 200 nM) was used for 5 hours, followed by LC3B immunostaining.

Pro-Q Diamond and SYPRO Ruby staining. Protein phosphorylation and total protein abundance were assessed by sequential Pro-Q Diamond and SYPRO Ruby staining of SDS-PAGE gels according to the manufacturers’ protocols (Invitrogen/Molecular Probes).

Immunofluorescence. Immunofluorescence was performed on hiPSC-CMs to assess cell size, viability, NFATC4, FOXO1, and cardiac troponin T. Images were acquired by confocal or fluorescence microscopy.

Cytokine analysis. Cytokine concentrations were measured using species-specific multiplex Luminex panels at the University of Minnesota (UMN) Cytokine Reference Laboratory. Cachexia-phase cytokine data were z-score normalized to account for wide inter-analyte dynamic ranges, while post-cachexia data are expressed as a percentage of control (100%) because cytokine levels largely returned to baseline, minimizing the impact of small fluctuations.

RNA isolation and gene expression analysis. RNA was extracted and analyzed by quantitative RT-PCR using gene-specific primers in technical triplicates. Primer sequences are provided in the Supplemental Methods.

RNA-seq and bioinformatics analysis. RNA-seq libraries were prepared from high-quality total RNA and subjected to paired-end sequencing on an Illumina NextSeq 2000 platform. Differential expression, KEGG pathway analysis, Venn diagram, and heatmap analyses were performed using established bioinformatic approaches (39, 92).

Image analysis. Nuclei count and cardiac myocyte size were quantified using cell profiler and FIJI/ImageJ with custom macros.

Statistics. Statistical analyses were calculated using GraphPad Prism 10.2. Two-tailed unpaired or paired Student’s t tests were used for comparisons between two groups, as appropriate. One-way ANOVA with Tukey’s multiple-comparison test was used for comparisons of more than two groups with one independent variable. A P value of less than 0.05 was considered statistically significant.

Study approval. All animal procedures were approved by the UMN IACUC (protocol 2305-41064A).

Data availability. The RNA-seq data generated are available in the NCBI Gene Expression Omnibus (GEO) under accession GSE342699. All graph data points are provided in the Supporting Data Values file.

Manuscript information

Authors contributions. NH conceived and designed the study, conducted experiments, analyzed data, and wrote the manuscript. HC helped design the study, conducted experiments, and analyzed data. MWE, JS, JB, and RG conducted experiments and analyzed data. BRT advised on experiments and was essential in conducting and editing of the study. JCL was essential in facilitating learning Seahorse technology, conducting experiments, providing feedback and editing of the study. JMM conceived and designed the study, supervised research, provided expertise and feedback, provided financial support to conduct the study, and wrote and edited the manuscript.

AI disclosure. The authors declare that no AI tools were used in the original research for or writing of this article.

Conflict of interest. The authors have declared that no conflict of interest exists.

Funding. This study was supported by the following:

  • NIH grants HL132874 and AR079477.
  • NIH Training Program in Cardiac Innovation grant T32HL144472 (to NH).
  • Greg Marzolf Jr. Foundation grant.
  • American Heart Association.
  • UMN Regenerative Medicine Minnesota grant 1184847.
  • Minnesota Colorectal Cancer Research Foundation grant (to HC).

This work is the result of NIH funding, in whole or in part, and is subject to the NIH Public Access Policy. Through acceptance of this federal funding, the NIH has been given a right to make the work publicly available in PubMed Central.

Supplemental material

View Supplemental data

View Unedited blot and gel images

View Supplemental tables 1-2

View Supplemental video 1

View Supplemental video 10

View Supplemental video 11

View Supplemental video 12

View Supplemental video 13

View Supplemental video 2

View Supplemental video 3

View Supplemental video 4

View Supplemental video 5

View Supplemental video 6

View Supplemental video 7

View Supplemental video 8

View Supplemental video 9

View Supporting data values

Acknowledgments

We thank Jop Van Berlo (UMN) for his helpful comments on the earlier version of this manuscript. We thank members of the Metzger lab for support. We acknowledge using resources at the UMN UIC, SCR_020997, UMN Genomic Center and MSI.

Address for correspondence. Joseph M. Metzger, Department of Integrative Biology and Physiology, University of Minnesota Medical School, 6-125 Jackson Hall, 321 Church Street SE, Minneapolis, Minnesota, 55455, USA. Phone: 612.625.8296; Email: metzgerj@umn.edu.

Footnotes

Copyright: © 2026, Hosny et al. This is an open access article published under the terms of the Creative Commons Attribution 4.0 International License.

Reference information: JCI Insight. 2026;11(21):e203276.https://doi.org/10.1172/jci.insight.203276.

References
  1. Okoshi MP, et al. Cardiac cachexia: perspectives for prevention and treatment. Arq Bras Cardiol. 2017;108(1):74–80.
    View this article via: PubMed Google Scholar
  2. Murphy SL, et al. Mortality in the United States, 2020. NCHS Data Brief. 2021;427:1–8.
  3. Rausch V, et al. Understanding the common mechanisms of heart and skeletal muscle wasting in cancer cachexia. Oncogenesis. 2021;10(1):1.
    View this article via: CrossRef PubMed Google Scholar
  4. Moslehi JJ. Cardio-oncology: a new clinical frontier and novel platform for cardiovascular investigation. Circulation. 2024;150(7):513–515.
    View this article via: CrossRef PubMed Google Scholar
  5. Baracos VE, et al. Cancer-associated cachexia. Nat Rev Dis Primers. 2018;41:17105.
    View this article via: CrossRef Google Scholar
  6. Bora V, Patel B. Cardiac complications: the understudied aspect of cancer cachexia. Cardiovasc Toxicol. 2022;22(3):254–267.
    View this article via: CrossRef PubMed Google Scholar
  7. Cosper PF, Leinwand LA. Cancer causes cardiac atrophy and autophagy in a sexually dimorphic manner. Cancer Res. 2011;71(5):1710–1720.
    View this article via: CrossRef PubMed Google Scholar
  8. Ogilvie LM, et al. Therapy-naïve malignancy causes cardiovascular disease: a state-of-the-art cardio-oncology perspective. Am J Physiol Heart Circ Physiol. 2024;326(6):H1515–H1537.
    View this article via: CrossRef PubMed Google Scholar
  9. Moslehi J, et al. Crosstalk between the heart and cancer: beyond drug toxicity. Circulation. 2020;142(7):684–687.
    View this article via: CrossRef PubMed Google Scholar
  10. Finke D, et al. Cancer-a major cardiac comorbidity with implications on cardiovascular metabolism. Front Physiol. 2021;12:729713.
    View this article via: CrossRef PubMed Google Scholar
  11. Kazemi-Bajestani SM, et al. Concurrent evolution of cancer cachexia and heart failure: bilateral effects exist. J Cachexia Sarcopenia Muscle. 2014;5(2):95–104.
    View this article via: CrossRef PubMed Google Scholar
  12. Meireles I, et al. In vitro models for cancer-associated cachexia: the complex modelling of a multiorgan syndrome. Appl Sci (Basel). 2024;14(13):5419.
    View this article via: CrossRef Google Scholar
  13. Schäfer M, et al. Ataxin-10 is part of a cachexokine cocktail triggering cardiac metabolic dysfunction in cancer cachexia. Mol Metab. 2016;5(2):67–78.
    View this article via: CrossRef PubMed Google Scholar
  14. Arends J, et al. Overcoming barriers to timely recognition and treatment of cancer cachexia: sharing progress in cancer care task force position paper and call to action. Crit Rev Oncol Hematol. 2023;185:103965.
    View this article via: CrossRef PubMed Google Scholar
  15. Valentova M, et al. Cardiac cachexia revisited: the role of wasting in heart failure. Cardiol Clin. 2022;40(2):199–207.
    View this article via: PubMed CrossRef Google Scholar
  16. Fearon K, et al. Definition and classification of cancer cachexia: an international consensus. Lancet Oncol. 2011;12(5):489–495.
    View this article via: CrossRef PubMed Google Scholar
  17. Kamdar F, et al. Stem cell-derived cardiomyocytes and beta-adrenergic receptor blockade in Duchenne muscular dystrophy cardiomyopathy. J Am Coll Cardiol. 2020;75(10):1159–1174.
    View this article via: CrossRef PubMed Google Scholar
  18. Tu C, et al. Tachycardia-induced metabolic rewiring as a driver of contractile dysfunction. Nat Biomed Eng. 2024;8(4):479–494.
    View this article via: CrossRef PubMed Google Scholar
  19. Hosny N, et al. Engineering human myocardium: integrating the maturation of hiPSC-derived cardiac myocytes across genetic, structural, physiological and multicellular systems. Cells. 2026;15(11):1019.
    View this article via: CrossRef PubMed Google Scholar
  20. Kim HG, et al. Metastatic or xenograft colorectal cancer models induce divergent anabolic deficits and expression of pro-inflammatory effectors of muscle wasting in a tumor-type-dependent manner. J Appl Physiol (1985). 2022;133(6):1273–1283.
    View this article via: CrossRef PubMed Google Scholar
  21. Huot JR, et al. HCT116 colorectal liver metastases exacerbate muscle wasting in a mouse model for the study of colorectal cancer cachexia. Dis Model Mech. 2020;13(1):dmm043166.
    View this article via: CrossRef PubMed Google Scholar
  22. White JP. IL-6, cancer and cachexia: metabolic dysfunction creates the perfect storm. Transl Cancer Res. 2017;6(suppl 2):S280–S285.
    View this article via: CrossRef PubMed Google Scholar
  23. Agca S, Kir S. The role of interleukin-6 family cytokines in cancer cachexia. FEBS J. 2024;291(18):4009–4023.
    View this article via: PubMed CrossRef Google Scholar
  24. Jengelley DH, Zimmers TA. The Role of Interleukin-6/GP130 Cytokines in Cancer Cachexia. In: Acharyya S, ed. The Systemic Effects of Advanced Cancer: A Textbook on Cancer-Associated Cachexia. Springer; 2022: 97–117.
  25. Berriel Diaz M, et al. Cancer cachexia: multilevel metabolic dysfunction. Nat Metab. 2024;6(12):2222–2245.
    View this article via: CrossRef PubMed Google Scholar
  26. Jackman RW, et al. Continuous release of tumor-derived factors improves the modeling of cachexia in muscle cell culture. Front Physiol. 2017;8:738.
    View this article via: CrossRef PubMed Google Scholar
  27. Lena A, et al. A comprehensive review of cancer-induced cardiac wasting. [published online April 22, 2026]. Br J Pharmacol. https://doi.org/10.1111/bph.70461.
    View this article via: PubMed CrossRef Google Scholar
  28. Chiong M, et al. Cardiomyocyte death: mechanisms and translational implications. Cell Death Dis. 2011;2(12):e244.
    View this article via: CrossRef PubMed Google Scholar
  29. Gustafsson AB. Bnip3 as a dual regulator of mitochondrial turnover and cell death in the myocardium. Pediatr Cardiol. 2011;32(3):267–274.
    View this article via: CrossRef PubMed Google Scholar
  30. Lena A, et al. Clinical and prognostic relevance of cardiac wasting in patients with advanced cancer. J Am Coll Cardiol. 2023;81(16):1569–1586.
    View this article via: CrossRef PubMed Google Scholar
  31. Law ML, Metzger JM. Cardiac myocyte intrinsic contractility and calcium handling deficits underlie heart organ dysfunction in murine cancer cachexia. Sci Rep. 2021;11(1):23627.
    View this article via: CrossRef PubMed Google Scholar
  32. Bertero E, Maack C. Metabolic remodelling in heart failure. Nat Rev Cardiol. 2018;15(8):457–470.
    View this article via: CrossRef PubMed Google Scholar
  33. Yuan L, et al. Muscle-specific E3 ubiquitin ligases are involved in muscle atrophy of cancer cachexia: an in vitro and in vivo study. Oncol Rep. 2015;33(5):2261–2268.
    View this article via: CrossRef PubMed Google Scholar
  34. Springer J, et al. Prevention of liver cancer cachexia-induced cardiac wasting and heart failure. Eur Heart J. 2014;35(14):932–941.
    View this article via: CrossRef PubMed Google Scholar
  35. Tian M, et al. Evidence for cardiac atrophic remodeling in cancer-induced cachexia in mice. Int J Oncol. 2011;39(5):1321–1326.
    View this article via: PubMed CrossRef Google Scholar
  36. Wang C, Wang X. The interplay between autophagy and the ubiquitin-proteasome system in cardiac proteotoxicity. Biochim Biophys Acta. 2015;1852(2):188–194.
    View this article via: CrossRef PubMed Google Scholar
  37. Jiang P, Mizushima N. LC3- and p62-based biochemical methods for the analysis of autophagy progression in mammalian cells. Methods. 2015;75:13–18.
    View this article via: CrossRef PubMed Google Scholar
  38. Baskin KK, et al. MAFbx/Atrogin-1 is required for atrophic remodeling of the unloaded heart. J Mol Cell Cardiol. 2014;72:168–176.
    View this article via: CrossRef PubMed Google Scholar
  39. Kanehisa M, Goto S. KEGG: kyoto encyclopedia of genes and genomes. Nucleic Acids Res. 2000;28(1):27–30.
    View this article via: CrossRef PubMed Google Scholar
  40. Li HH, et al. Atrogin-1/muscle atrophy F-box inhibits calcineurin-dependent cardiac hypertrophy by participating in an SCF ubiquitin ligase complex. J Clin Invest. 2004;114(8):1058–1071.
    View this article via: JCI CrossRef PubMed Google Scholar
  41. Molkentin JD, et al. A calcineurin-dependent transcriptional pathway for cardiac hypertrophy. Cell. 1998;93(2):215–228.
    View this article via: CrossRef PubMed Google Scholar
  42. Xiang B, et al. The catalytically active domain in the A subunit of calcineurin. Biol Chem. 2003;384(10-11):1429–1434.
    View this article via: CrossRef PubMed Google Scholar
  43. Burkard N, et al. Targeted proteolysis sustains calcineurin activation. Circulation. 2005;111(8):1045–1053.
    View this article via: CrossRef PubMed Google Scholar
  44. Zhang Y, et al. USP16-mediated deubiquitination of calcineurin A controls peripheral T cell maintenance. J Clin Invest. 2019;129(7):2856–2871.
    View this article via: JCI CrossRef PubMed Google Scholar
  45. Wilkins BJ, et al. Calcineurin/NFAT coupling participates in pathological, but not physiological, cardiac hypertrophy. Circ Res. 2004;94(1):110–118.
    View this article via: CrossRef PubMed Google Scholar
  46. Singh S, et al. Role of calcineurin and actin dynamics in regulated secretion of microneme proteins in Plasmodium falciparum merozoites during erythrocyte invasion. Cell Microbiol. 2014;16(1):50–63.
    View this article via: CrossRef PubMed Google Scholar
  47. Diedrichs H, et al. Increased regulatory activity of the calcineurin/NFAT pathway in human heart failure. Eur J Heart Fail. 2004;6(1):3–9.
    View this article via: CrossRef PubMed Google Scholar
  48. Wang K, et al. miR-9 and NFATc3 regulate myocardin in cardiac hypertrophy. J Biol Chem. 2010;285(16):11903–11912.
    View this article via: CrossRef PubMed Google Scholar
  49. Goldstein J, et al. Calcineurin/Nfatc1 signaling links skin stem cell quiescence to hormonal signaling during pregnancy and lactation. Genes Dev. 2014;28(9):983–994.
    View this article via: CrossRef PubMed Google Scholar
  50. Funk SD, et al. EphA2 stimulates VCAM-1 expression through calcium-dependent NFAT1 activity. Cell Signal. 2018;49:30–38.
    View this article via: CrossRef PubMed Google Scholar
  51. Lokireddy S, et al. Identification of atrogin-1-targeted proteins during the myostatin-induced skeletal muscle wasting. Am J Physiol Cell Physiol. 2012;303(5):C512–C529.
    View this article via: CrossRef PubMed Google Scholar
  52. Mota R, et al. Increasing cardiomyocyte atrogin-1 reduces aging-associated fibrosis and regulates remodeling in vivo. Am J Pathol. 2018;188(7):1676–1692.
    View this article via: CrossRef PubMed Google Scholar
  53. Zaglia T, et al. Atrogin-1 deficiency promotes cardiomyopathy and premature death via impaired autophagy. J Clin Invest. 2014;124(6):2410–2424.
    View this article via: JCI CrossRef PubMed Google Scholar
  54. Magnuson B, et al. Regulation and function of ribosomal protein S6 kinase (S6K) within mTOR signalling networks. Biochem J. 2012;441(1):1–21.
    View this article via: CrossRef PubMed Google Scholar
  55. Hara K, et al. Raptor, a binding partner of target of rapamycin (TOR), mediates TOR action. Cell. 2002;110(2):177–189.
    View this article via: CrossRef PubMed Google Scholar
  56. Schmidt EK, et al. SUnSET, a nonradioactive method to monitor protein synthesis. Nat Methods. 2009;6(4):275–277.
    View this article via: CrossRef PubMed Google Scholar
  57. Kearney MC, et al. Cardiac dysfunction in cancer survivors unmasked during exercise. Eur J Clin Invest. 2017;47(3):213–220.
    View this article via: CrossRef PubMed Google Scholar
  58. Wilde L, et al. Metabolic coupling and the reverse Warburg Effect in cancer: Implications for novel biomarker and anticancer agent development. Semin Oncol. 2017;44:198–203.
    View this article via: CrossRef PubMed Google Scholar
  59. Tabara LC, et al. Molecular mechanisms of mitochondrial dynamics. Nat Rev Mol Cell Biol. 2025;26(2):123–146.
    View this article via: CrossRef PubMed Google Scholar
  60. Aleman BM, et al. Cardiovascular disease after cancer therapy. EJC Suppl. 2014;12(1):18–28.
    View this article via: CrossRef PubMed Google Scholar
  61. Khakoo AY, Yeh ET. Therapy insight: management of cardiovascular disease in patients with cancer and cardiac complications of cancer therapy. Nat Clin Pract Oncol. 2008;5(11):655–667.
    View this article via: CrossRef PubMed Google Scholar
  62. Ravasco P, et al. Colorectal cancer: intrinsic characteristics modulate cancer energy expenditure and the risk of cachexia. Cancer Invest. 2007;25(5):308–314.
    View this article via: CrossRef PubMed Google Scholar
  63. Liu Q, et al. Direct interaction and reciprocal regulation between ASK1 and calcineurin-NFAT control cardiomyocyte death and growth. Mol Cell Biol. 2006;26(10):3785–3797.
    View this article via: CrossRef PubMed Google Scholar
  64. Vega RB, et al. Control of cardiac growth and function by calcineurin signaling. J Biol Chem. 2003;278(39):36981–36984.
    View this article via: CrossRef PubMed Google Scholar
  65. Liu Q, et al. Interaction between NFκB and NFAT coordinates cardiac hypertrophy and pathological remodeling. Circ Res. 2012;110(8):1077–1086.
    View this article via: CrossRef PubMed Google Scholar
  66. Pryce BR, et al. Muscle inflammation is regulated by NF-κB from multiple cells to control distinct states of wasting in cancer cachexia. Cell Rep. 2024;43(11):114925.
    View this article via: CrossRef PubMed Google Scholar
  67. Martin TG, et al. Regression of cardiac hypertrophy in health and disease: mechanisms and therapeutic potential. Nat Rev Cardiol. 2023;20(5):347–363.
    View this article via: CrossRef PubMed Google Scholar
  68. Gomes MD, et al. Atrogin-1, a muscle-specific F-box protein highly expressed during muscle atrophy. Proc Natl Acad Sci U S A. 2001;98(25):14440–14445.
    View this article via: CrossRef PubMed Google Scholar
  69. Sandri M, et al. Foxo transcription factors induce the atrophy-related ubiquitin ligase atrogin-1 and cause skeletal muscle atrophy. Cell. 2004;117(3):399–412.
    View this article via: CrossRef PubMed Google Scholar
  70. Marino G, et al. Self-consumption: the interplay of autophagy and apoptosis. Nat Rev Mol Cell Biol. 2014;15(2):81–94.
    View this article via: CrossRef PubMed Google Scholar
  71. Schmitt TL, et al. Activity of the Akt-dependent anabolic and catabolic pathways in muscle and liver samples in cancer-related cachexia. J Mol Med (Berl). 2007;85(6):647–654.
    View this article via: CrossRef PubMed Google Scholar
  72. Brunet A, et al. Akt promotes cell survival by phosphorylating and inhibiting a Forkhead transcription factor. Cell. 1999;96(6):857–868.
    View this article via: CrossRef PubMed Google Scholar
  73. Zhao J, et al. FoxO3 coordinately activates protein degradation by the autophagic/lysosomal and proteasomal pathways in atrophying muscle cells. Cell Metab. 2007;6(6):472–483.
    View this article via: CrossRef PubMed Google Scholar
  74. Manning BD, Cantley LC. AKT/PKB signaling: navigating downstream. Cell. 2007;129(7):1261–1274.
    View this article via: CrossRef PubMed Google Scholar
  75. Manne ND, et al. Altered cardiac muscle mTOR regulation during the progression of cancer cachexia in the ApcMin/+ mouse. Int J Oncol. 2013;42(6):2134–2140.
    View this article via: CrossRef PubMed Google Scholar
  76. Nishimura Y, et al. Ubiquitin E3 ligases Atrogin-1 and MuRF1 protein contents are differentially regulated in the rapamycin-sensitive mTOR-S6K1 signaling pathway in C2C12 myotubes. Am J Physiol Cell Physiol. 2022;323(1):C215–C225.
    View this article via: CrossRef PubMed Google Scholar
  77. Yang L, et al. Interleukin-6 differentially regulates androgen receptor transactivation via PI3K-Akt, STAT3, and MAPK, three distinct signal pathways in prostate cancer cells. Biochem Biophys Res Commun. 2003;305(3):462–469.
    View this article via: CrossRef PubMed Google Scholar
  78. Maia J, et al. Exosome-based cell-cell communication in the tumor microenvironment. Front Cell Dev Biol. 2018;6:18.
    View this article via: CrossRef PubMed Google Scholar
  79. Heineke J, et al. Genetic deletion of myostatin from the heart prevents skeletal muscle atrophy in heart failure. Circulation. 2010;121(3):419–425.
    View this article via: CrossRef PubMed Google Scholar
  80. Ji M, et al. Osteocrin alleviates cardiac hypertrophy via attenuating oxidative stress. Peptides. 2022;152:170773.
    View this article via: CrossRef PubMed Google Scholar
  81. Li S, et al. Fibroblast growth factor 21 protects the heart from angiotensin II-induced cardiac hypertrophy and dysfunction via SIRT1. Biochim Biophys Acta Mol Basis Dis. 2019;1865(6):1241–1252.
    View this article via: CrossRef PubMed Google Scholar
  82. Wilson HE, et al. Breast cancer-associated skeletal muscle mitochondrial dysfunction and lipid accumulation is reversed by PPARG. Am J Physiol Cell Physiol. 2021;320(4):C577–C590.
    View this article via: CrossRef PubMed Google Scholar
  83. Miyagawa Y, et al. Evaluation of cancer-derived myocardial impairments using a mouse model. Oncotarget. 2020;11(41):3712–3722.
    View this article via: CrossRef PubMed Google Scholar
  84. Hyltander A, et al. Elevated energy expenditure in cancer patients with solid tumours. Eur J Cancer. 1991;27(1):9–15.
    View this article via: CrossRef PubMed Google Scholar
  85. Thompson BR, et al. Gene transfer of calcium-binding proteins into adult cardiac myocytes. Methods Mol Biol. 2019;1929:187–205.
    View this article via: PubMed CrossRef Google Scholar
  86. Thompson BR, et al. Sarcomere neutralization in inherited cardiomyopathy: small-molecule proof-of-concept to correct hyper-Ca2+-sensitive myofilaments. Am J Physiol Heart Circ Physiol. 2016;311(1):H36–H43.
    View this article via: CrossRef PubMed Google Scholar
  87. Bedada FB, et al. Acquisition of a quantitative, stoichiometrically conserved ratiometric marker of maturation status in stem cell-derived cardiac myocytes. Stem Cell Reports. 2014;3(4):594–605.
    View this article via: CrossRef PubMed Google Scholar
  88. Wheelwright M, et al. Advancing physiological maturation in human induced pluripotent stem cell-derived cardiac muscle by gene editing an inducible adult troponin isoform switch. Stem Cells. 2020;38(10):1254–1266.
    View this article via: CrossRef PubMed Google Scholar
  89. Lian X, et al. Directed cardiomyocyte differentiation from human pluripotent stem cells by modulating Wnt/β-catenin signaling under fully defined conditions. Nat Protoc. 2013;8(1):162–175.
    View this article via: CrossRef PubMed Google Scholar
  90. Sharma A, et al. Derivation of highly purified cardiomyocytes from human induced pluripotent stem cells using small molecule-modulated differentiation and subsequent glucose starvation. J Vis Exp. 2015;97:52628.
    View this article via: PubMed CrossRef Google Scholar
  91. Sala L, et al. MUSCLEMOTION: a versatile open software tool to quantify cardiomyocyte and cardiac muscle contraction in vitro and in vivo. Circ Res. 2018;122(3):e5–e16.
    View this article via: CrossRef PubMed Google Scholar
  92. Tang D, et al. SRplot: a free online platform for data visualization and graphing. PLoS One. 2023;18(11):e0294236.
    View this article via: CrossRef PubMed Google Scholar
Version history
  • Version 1 (November 9, 2026): Electronic publication

Article tools

  • View PDF
  • Download citation information
  • Send a comment
  • Terms of use
  • Standard abbreviations
  • Need help? Email the journal

Metrics

  • Article usage
  • Citations to this article

Go to

  • Top
  • Abstract
  • Introduction
  • Results
  • Discussion
  • Methods
  • Manuscript information
  • Supplemental material
  • Acknowledgments
  • Footnotes
  • References
  • Version history
Advertisement
Advertisement

Copyright © 2026 American Society for Clinical Investigation
ISSN 2379-3708

Sign up for email alerts