
Research ArticleInflammationMuscle biology
Open Access |  10.1172/jci.insight.205137
Excess muscle plasma membrane leak disrupts ECM content and shifts macrophage-mediated muscle repair
GaHyun Lee,1 Alexander J. Fitt,1 Ashlee M. Long,1 Lauren A. Vaught,1 Dorothy DeBiasse,1 Alexander R. Keeble,1 Jason M. Kwon,1 Patrick G.T. Page,1 Marie-Therese Daher,1 Michele Hadhazy,1 Alexander B. Willis,1 David Ceja Galindo,2 Maxwell McCabe,2 Connor Lantz,3,4 Kirk C. Hansen,2 Rachelle H. Crosbie,5,6 Edward B. Thorp,3,4,7,8 Alexis R. Demonbreun,1,9 and Elizabeth M. McNally1
1Center for Genetic Medicine, Northwestern University Feinberg School of Medicine, Chicago, Illinois, USA.
2Department of Biochemistry and Molecular Genetics, University of Colorado Anschutz Medical Campus, Aurora, Colorado, USA.
3Department of Pathology, and
4Comprehensive Transplant Center, Northwestern University Feinberg School of Medicine, Chicago, Illinois, USA.
5Department of Integrative Biology and Physiology, and
6Department of Neurology, David Geffen School of Medicine, UCLA, Los Angeles, California, USA.
7Department of Pediatrics, Northwestern University Feinberg School of Medicine, Chicago, Illinois, USA.
8Heart Center, Stanley Manne Children’s Research Institute, Ann & Robert Lurie Children’s Hospital, Chicago, Illinois, USA.
9Department of Pharmacology, Northwestern University Feinberg School of Medicine, Chicago, Illinois, USA.
Address correspondence to: Alexis R. Demonbreun, Center for Genetic Medicine, Northwestern University, 303 E Superior SQ 5-512, Chicago, Illinois 60611, USA. Phone: 312.503.6249; Email: alexis.demonbreun@northwestern.edu. Or to: Elizabeth M. McNally, Center for Genetic Medicine, Northwestern University, 303 E Superior SQ 5-516, Chicago, Illinois 60611, USA. Phone: 312.503.5600; Email: elizabeth.mcnally@northwestern.edu.
Find articles by Lee, G. in: PubMed | Google Scholar
1Center for Genetic Medicine, Northwestern University Feinberg School of Medicine, Chicago, Illinois, USA.
2Department of Biochemistry and Molecular Genetics, University of Colorado Anschutz Medical Campus, Aurora, Colorado, USA.
3Department of Pathology, and
4Comprehensive Transplant Center, Northwestern University Feinberg School of Medicine, Chicago, Illinois, USA.
5Department of Integrative Biology and Physiology, and
6Department of Neurology, David Geffen School of Medicine, UCLA, Los Angeles, California, USA.
7Department of Pediatrics, Northwestern University Feinberg School of Medicine, Chicago, Illinois, USA.
8Heart Center, Stanley Manne Children’s Research Institute, Ann & Robert Lurie Children’s Hospital, Chicago, Illinois, USA.
9Department of Pharmacology, Northwestern University Feinberg School of Medicine, Chicago, Illinois, USA.
Address correspondence to: Alexis R. Demonbreun, Center for Genetic Medicine, Northwestern University, 303 E Superior SQ 5-512, Chicago, Illinois 60611, USA. Phone: 312.503.6249; Email: alexis.demonbreun@northwestern.edu. Or to: Elizabeth M. McNally, Center for Genetic Medicine, Northwestern University, 303 E Superior SQ 5-516, Chicago, Illinois 60611, USA. Phone: 312.503.5600; Email: elizabeth.mcnally@northwestern.edu.
Find articles by Fitt, A. in: PubMed | Google Scholar
1Center for Genetic Medicine, Northwestern University Feinberg School of Medicine, Chicago, Illinois, USA.
2Department of Biochemistry and Molecular Genetics, University of Colorado Anschutz Medical Campus, Aurora, Colorado, USA.
3Department of Pathology, and
4Comprehensive Transplant Center, Northwestern University Feinberg School of Medicine, Chicago, Illinois, USA.
5Department of Integrative Biology and Physiology, and
6Department of Neurology, David Geffen School of Medicine, UCLA, Los Angeles, California, USA.
7Department of Pediatrics, Northwestern University Feinberg School of Medicine, Chicago, Illinois, USA.
8Heart Center, Stanley Manne Children’s Research Institute, Ann & Robert Lurie Children’s Hospital, Chicago, Illinois, USA.
9Department of Pharmacology, Northwestern University Feinberg School of Medicine, Chicago, Illinois, USA.
Address correspondence to: Alexis R. Demonbreun, Center for Genetic Medicine, Northwestern University, 303 E Superior SQ 5-512, Chicago, Illinois 60611, USA. Phone: 312.503.6249; Email: alexis.demonbreun@northwestern.edu. Or to: Elizabeth M. McNally, Center for Genetic Medicine, Northwestern University, 303 E Superior SQ 5-516, Chicago, Illinois 60611, USA. Phone: 312.503.5600; Email: elizabeth.mcnally@northwestern.edu.
Find articles by Long, A. in: PubMed | Google Scholar
1Center for Genetic Medicine, Northwestern University Feinberg School of Medicine, Chicago, Illinois, USA.
2Department of Biochemistry and Molecular Genetics, University of Colorado Anschutz Medical Campus, Aurora, Colorado, USA.
3Department of Pathology, and
4Comprehensive Transplant Center, Northwestern University Feinberg School of Medicine, Chicago, Illinois, USA.
5Department of Integrative Biology and Physiology, and
6Department of Neurology, David Geffen School of Medicine, UCLA, Los Angeles, California, USA.
7Department of Pediatrics, Northwestern University Feinberg School of Medicine, Chicago, Illinois, USA.
8Heart Center, Stanley Manne Children’s Research Institute, Ann & Robert Lurie Children’s Hospital, Chicago, Illinois, USA.
9Department of Pharmacology, Northwestern University Feinberg School of Medicine, Chicago, Illinois, USA.
Address correspondence to: Alexis R. Demonbreun, Center for Genetic Medicine, Northwestern University, 303 E Superior SQ 5-512, Chicago, Illinois 60611, USA. Phone: 312.503.6249; Email: alexis.demonbreun@northwestern.edu. Or to: Elizabeth M. McNally, Center for Genetic Medicine, Northwestern University, 303 E Superior SQ 5-516, Chicago, Illinois 60611, USA. Phone: 312.503.5600; Email: elizabeth.mcnally@northwestern.edu.
Find articles by
Vaught, L.
in:
PubMed
|
Google Scholar
|

1Center for Genetic Medicine, Northwestern University Feinberg School of Medicine, Chicago, Illinois, USA.
2Department of Biochemistry and Molecular Genetics, University of Colorado Anschutz Medical Campus, Aurora, Colorado, USA.
3Department of Pathology, and
4Comprehensive Transplant Center, Northwestern University Feinberg School of Medicine, Chicago, Illinois, USA.
5Department of Integrative Biology and Physiology, and
6Department of Neurology, David Geffen School of Medicine, UCLA, Los Angeles, California, USA.
7Department of Pediatrics, Northwestern University Feinberg School of Medicine, Chicago, Illinois, USA.
8Heart Center, Stanley Manne Children’s Research Institute, Ann & Robert Lurie Children’s Hospital, Chicago, Illinois, USA.
9Department of Pharmacology, Northwestern University Feinberg School of Medicine, Chicago, Illinois, USA.
Address correspondence to: Alexis R. Demonbreun, Center for Genetic Medicine, Northwestern University, 303 E Superior SQ 5-512, Chicago, Illinois 60611, USA. Phone: 312.503.6249; Email: alexis.demonbreun@northwestern.edu. Or to: Elizabeth M. McNally, Center for Genetic Medicine, Northwestern University, 303 E Superior SQ 5-516, Chicago, Illinois 60611, USA. Phone: 312.503.5600; Email: elizabeth.mcnally@northwestern.edu.
Find articles by DeBiasse, D. in: PubMed | Google Scholar
1Center for Genetic Medicine, Northwestern University Feinberg School of Medicine, Chicago, Illinois, USA.
2Department of Biochemistry and Molecular Genetics, University of Colorado Anschutz Medical Campus, Aurora, Colorado, USA.
3Department of Pathology, and
4Comprehensive Transplant Center, Northwestern University Feinberg School of Medicine, Chicago, Illinois, USA.
5Department of Integrative Biology and Physiology, and
6Department of Neurology, David Geffen School of Medicine, UCLA, Los Angeles, California, USA.
7Department of Pediatrics, Northwestern University Feinberg School of Medicine, Chicago, Illinois, USA.
8Heart Center, Stanley Manne Children’s Research Institute, Ann & Robert Lurie Children’s Hospital, Chicago, Illinois, USA.
9Department of Pharmacology, Northwestern University Feinberg School of Medicine, Chicago, Illinois, USA.
Address correspondence to: Alexis R. Demonbreun, Center for Genetic Medicine, Northwestern University, 303 E Superior SQ 5-512, Chicago, Illinois 60611, USA. Phone: 312.503.6249; Email: alexis.demonbreun@northwestern.edu. Or to: Elizabeth M. McNally, Center for Genetic Medicine, Northwestern University, 303 E Superior SQ 5-516, Chicago, Illinois 60611, USA. Phone: 312.503.5600; Email: elizabeth.mcnally@northwestern.edu.
Find articles by Keeble, A. in: PubMed | Google Scholar
1Center for Genetic Medicine, Northwestern University Feinberg School of Medicine, Chicago, Illinois, USA.
2Department of Biochemistry and Molecular Genetics, University of Colorado Anschutz Medical Campus, Aurora, Colorado, USA.
3Department of Pathology, and
4Comprehensive Transplant Center, Northwestern University Feinberg School of Medicine, Chicago, Illinois, USA.
5Department of Integrative Biology and Physiology, and
6Department of Neurology, David Geffen School of Medicine, UCLA, Los Angeles, California, USA.
7Department of Pediatrics, Northwestern University Feinberg School of Medicine, Chicago, Illinois, USA.
8Heart Center, Stanley Manne Children’s Research Institute, Ann & Robert Lurie Children’s Hospital, Chicago, Illinois, USA.
9Department of Pharmacology, Northwestern University Feinberg School of Medicine, Chicago, Illinois, USA.
Address correspondence to: Alexis R. Demonbreun, Center for Genetic Medicine, Northwestern University, 303 E Superior SQ 5-512, Chicago, Illinois 60611, USA. Phone: 312.503.6249; Email: alexis.demonbreun@northwestern.edu. Or to: Elizabeth M. McNally, Center for Genetic Medicine, Northwestern University, 303 E Superior SQ 5-516, Chicago, Illinois 60611, USA. Phone: 312.503.5600; Email: elizabeth.mcnally@northwestern.edu.
Find articles by Kwon, J. in: PubMed | Google Scholar
1Center for Genetic Medicine, Northwestern University Feinberg School of Medicine, Chicago, Illinois, USA.
2Department of Biochemistry and Molecular Genetics, University of Colorado Anschutz Medical Campus, Aurora, Colorado, USA.
3Department of Pathology, and
4Comprehensive Transplant Center, Northwestern University Feinberg School of Medicine, Chicago, Illinois, USA.
5Department of Integrative Biology and Physiology, and
6Department of Neurology, David Geffen School of Medicine, UCLA, Los Angeles, California, USA.
7Department of Pediatrics, Northwestern University Feinberg School of Medicine, Chicago, Illinois, USA.
8Heart Center, Stanley Manne Children’s Research Institute, Ann & Robert Lurie Children’s Hospital, Chicago, Illinois, USA.
9Department of Pharmacology, Northwestern University Feinberg School of Medicine, Chicago, Illinois, USA.
Address correspondence to: Alexis R. Demonbreun, Center for Genetic Medicine, Northwestern University, 303 E Superior SQ 5-512, Chicago, Illinois 60611, USA. Phone: 312.503.6249; Email: alexis.demonbreun@northwestern.edu. Or to: Elizabeth M. McNally, Center for Genetic Medicine, Northwestern University, 303 E Superior SQ 5-516, Chicago, Illinois 60611, USA. Phone: 312.503.5600; Email: elizabeth.mcnally@northwestern.edu.
Find articles by
Page, P.
in:
PubMed
|
Google Scholar
|
1Center for Genetic Medicine, Northwestern University Feinberg School of Medicine, Chicago, Illinois, USA.
2Department of Biochemistry and Molecular Genetics, University of Colorado Anschutz Medical Campus, Aurora, Colorado, USA.
3Department of Pathology, and
4Comprehensive Transplant Center, Northwestern University Feinberg School of Medicine, Chicago, Illinois, USA.
5Department of Integrative Biology and Physiology, and
6Department of Neurology, David Geffen School of Medicine, UCLA, Los Angeles, California, USA.
7Department of Pediatrics, Northwestern University Feinberg School of Medicine, Chicago, Illinois, USA.
8Heart Center, Stanley Manne Children’s Research Institute, Ann & Robert Lurie Children’s Hospital, Chicago, Illinois, USA.
9Department of Pharmacology, Northwestern University Feinberg School of Medicine, Chicago, Illinois, USA.
Address correspondence to: Alexis R. Demonbreun, Center for Genetic Medicine, Northwestern University, 303 E Superior SQ 5-512, Chicago, Illinois 60611, USA. Phone: 312.503.6249; Email: alexis.demonbreun@northwestern.edu. Or to: Elizabeth M. McNally, Center for Genetic Medicine, Northwestern University, 303 E Superior SQ 5-516, Chicago, Illinois 60611, USA. Phone: 312.503.5600; Email: elizabeth.mcnally@northwestern.edu.
Find articles by Daher, M. in: PubMed | Google Scholar
1Center for Genetic Medicine, Northwestern University Feinberg School of Medicine, Chicago, Illinois, USA.
2Department of Biochemistry and Molecular Genetics, University of Colorado Anschutz Medical Campus, Aurora, Colorado, USA.
3Department of Pathology, and
4Comprehensive Transplant Center, Northwestern University Feinberg School of Medicine, Chicago, Illinois, USA.
5Department of Integrative Biology and Physiology, and
6Department of Neurology, David Geffen School of Medicine, UCLA, Los Angeles, California, USA.
7Department of Pediatrics, Northwestern University Feinberg School of Medicine, Chicago, Illinois, USA.
8Heart Center, Stanley Manne Children’s Research Institute, Ann & Robert Lurie Children’s Hospital, Chicago, Illinois, USA.
9Department of Pharmacology, Northwestern University Feinberg School of Medicine, Chicago, Illinois, USA.
Address correspondence to: Alexis R. Demonbreun, Center for Genetic Medicine, Northwestern University, 303 E Superior SQ 5-512, Chicago, Illinois 60611, USA. Phone: 312.503.6249; Email: alexis.demonbreun@northwestern.edu. Or to: Elizabeth M. McNally, Center for Genetic Medicine, Northwestern University, 303 E Superior SQ 5-516, Chicago, Illinois 60611, USA. Phone: 312.503.5600; Email: elizabeth.mcnally@northwestern.edu.
Find articles by
Hadhazy, M.
in:
PubMed
|
Google Scholar
|
1Center for Genetic Medicine, Northwestern University Feinberg School of Medicine, Chicago, Illinois, USA.
2Department of Biochemistry and Molecular Genetics, University of Colorado Anschutz Medical Campus, Aurora, Colorado, USA.
3Department of Pathology, and
4Comprehensive Transplant Center, Northwestern University Feinberg School of Medicine, Chicago, Illinois, USA.
5Department of Integrative Biology and Physiology, and
6Department of Neurology, David Geffen School of Medicine, UCLA, Los Angeles, California, USA.
7Department of Pediatrics, Northwestern University Feinberg School of Medicine, Chicago, Illinois, USA.
8Heart Center, Stanley Manne Children’s Research Institute, Ann & Robert Lurie Children’s Hospital, Chicago, Illinois, USA.
9Department of Pharmacology, Northwestern University Feinberg School of Medicine, Chicago, Illinois, USA.
Address correspondence to: Alexis R. Demonbreun, Center for Genetic Medicine, Northwestern University, 303 E Superior SQ 5-512, Chicago, Illinois 60611, USA. Phone: 312.503.6249; Email: alexis.demonbreun@northwestern.edu. Or to: Elizabeth M. McNally, Center for Genetic Medicine, Northwestern University, 303 E Superior SQ 5-516, Chicago, Illinois 60611, USA. Phone: 312.503.5600; Email: elizabeth.mcnally@northwestern.edu.
Find articles by Willis, A. in: PubMed | Google Scholar
1Center for Genetic Medicine, Northwestern University Feinberg School of Medicine, Chicago, Illinois, USA.
2Department of Biochemistry and Molecular Genetics, University of Colorado Anschutz Medical Campus, Aurora, Colorado, USA.
3Department of Pathology, and
4Comprehensive Transplant Center, Northwestern University Feinberg School of Medicine, Chicago, Illinois, USA.
5Department of Integrative Biology and Physiology, and
6Department of Neurology, David Geffen School of Medicine, UCLA, Los Angeles, California, USA.
7Department of Pediatrics, Northwestern University Feinberg School of Medicine, Chicago, Illinois, USA.
8Heart Center, Stanley Manne Children’s Research Institute, Ann & Robert Lurie Children’s Hospital, Chicago, Illinois, USA.
9Department of Pharmacology, Northwestern University Feinberg School of Medicine, Chicago, Illinois, USA.
Address correspondence to: Alexis R. Demonbreun, Center for Genetic Medicine, Northwestern University, 303 E Superior SQ 5-512, Chicago, Illinois 60611, USA. Phone: 312.503.6249; Email: alexis.demonbreun@northwestern.edu. Or to: Elizabeth M. McNally, Center for Genetic Medicine, Northwestern University, 303 E Superior SQ 5-516, Chicago, Illinois 60611, USA. Phone: 312.503.5600; Email: elizabeth.mcnally@northwestern.edu.
Find articles by Ceja Galindo, D. in: PubMed | Google Scholar
1Center for Genetic Medicine, Northwestern University Feinberg School of Medicine, Chicago, Illinois, USA.
2Department of Biochemistry and Molecular Genetics, University of Colorado Anschutz Medical Campus, Aurora, Colorado, USA.
3Department of Pathology, and
4Comprehensive Transplant Center, Northwestern University Feinberg School of Medicine, Chicago, Illinois, USA.
5Department of Integrative Biology and Physiology, and
6Department of Neurology, David Geffen School of Medicine, UCLA, Los Angeles, California, USA.
7Department of Pediatrics, Northwestern University Feinberg School of Medicine, Chicago, Illinois, USA.
8Heart Center, Stanley Manne Children’s Research Institute, Ann & Robert Lurie Children’s Hospital, Chicago, Illinois, USA.
9Department of Pharmacology, Northwestern University Feinberg School of Medicine, Chicago, Illinois, USA.
Address correspondence to: Alexis R. Demonbreun, Center for Genetic Medicine, Northwestern University, 303 E Superior SQ 5-512, Chicago, Illinois 60611, USA. Phone: 312.503.6249; Email: alexis.demonbreun@northwestern.edu. Or to: Elizabeth M. McNally, Center for Genetic Medicine, Northwestern University, 303 E Superior SQ 5-516, Chicago, Illinois 60611, USA. Phone: 312.503.5600; Email: elizabeth.mcnally@northwestern.edu.
Find articles by McCabe, M. in: PubMed | Google Scholar
1Center for Genetic Medicine, Northwestern University Feinberg School of Medicine, Chicago, Illinois, USA.
2Department of Biochemistry and Molecular Genetics, University of Colorado Anschutz Medical Campus, Aurora, Colorado, USA.
3Department of Pathology, and
4Comprehensive Transplant Center, Northwestern University Feinberg School of Medicine, Chicago, Illinois, USA.
5Department of Integrative Biology and Physiology, and
6Department of Neurology, David Geffen School of Medicine, UCLA, Los Angeles, California, USA.
7Department of Pediatrics, Northwestern University Feinberg School of Medicine, Chicago, Illinois, USA.
8Heart Center, Stanley Manne Children’s Research Institute, Ann & Robert Lurie Children’s Hospital, Chicago, Illinois, USA.
9Department of Pharmacology, Northwestern University Feinberg School of Medicine, Chicago, Illinois, USA.
Address correspondence to: Alexis R. Demonbreun, Center for Genetic Medicine, Northwestern University, 303 E Superior SQ 5-512, Chicago, Illinois 60611, USA. Phone: 312.503.6249; Email: alexis.demonbreun@northwestern.edu. Or to: Elizabeth M. McNally, Center for Genetic Medicine, Northwestern University, 303 E Superior SQ 5-516, Chicago, Illinois 60611, USA. Phone: 312.503.5600; Email: elizabeth.mcnally@northwestern.edu.
Find articles by
Lantz, C.
in:
PubMed
|
Google Scholar
|
1Center for Genetic Medicine, Northwestern University Feinberg School of Medicine, Chicago, Illinois, USA.
2Department of Biochemistry and Molecular Genetics, University of Colorado Anschutz Medical Campus, Aurora, Colorado, USA.
3Department of Pathology, and
4Comprehensive Transplant Center, Northwestern University Feinberg School of Medicine, Chicago, Illinois, USA.
5Department of Integrative Biology and Physiology, and
6Department of Neurology, David Geffen School of Medicine, UCLA, Los Angeles, California, USA.
7Department of Pediatrics, Northwestern University Feinberg School of Medicine, Chicago, Illinois, USA.
8Heart Center, Stanley Manne Children’s Research Institute, Ann & Robert Lurie Children’s Hospital, Chicago, Illinois, USA.
9Department of Pharmacology, Northwestern University Feinberg School of Medicine, Chicago, Illinois, USA.
Address correspondence to: Alexis R. Demonbreun, Center for Genetic Medicine, Northwestern University, 303 E Superior SQ 5-512, Chicago, Illinois 60611, USA. Phone: 312.503.6249; Email: alexis.demonbreun@northwestern.edu. Or to: Elizabeth M. McNally, Center for Genetic Medicine, Northwestern University, 303 E Superior SQ 5-516, Chicago, Illinois 60611, USA. Phone: 312.503.5600; Email: elizabeth.mcnally@northwestern.edu.
Find articles by
Hansen, K.
in:
PubMed
|
Google Scholar
|
1Center for Genetic Medicine, Northwestern University Feinberg School of Medicine, Chicago, Illinois, USA.
2Department of Biochemistry and Molecular Genetics, University of Colorado Anschutz Medical Campus, Aurora, Colorado, USA.
3Department of Pathology, and
4Comprehensive Transplant Center, Northwestern University Feinberg School of Medicine, Chicago, Illinois, USA.
5Department of Integrative Biology and Physiology, and
6Department of Neurology, David Geffen School of Medicine, UCLA, Los Angeles, California, USA.
7Department of Pediatrics, Northwestern University Feinberg School of Medicine, Chicago, Illinois, USA.
8Heart Center, Stanley Manne Children’s Research Institute, Ann & Robert Lurie Children’s Hospital, Chicago, Illinois, USA.
9Department of Pharmacology, Northwestern University Feinberg School of Medicine, Chicago, Illinois, USA.
Address correspondence to: Alexis R. Demonbreun, Center for Genetic Medicine, Northwestern University, 303 E Superior SQ 5-512, Chicago, Illinois 60611, USA. Phone: 312.503.6249; Email: alexis.demonbreun@northwestern.edu. Or to: Elizabeth M. McNally, Center for Genetic Medicine, Northwestern University, 303 E Superior SQ 5-516, Chicago, Illinois 60611, USA. Phone: 312.503.5600; Email: elizabeth.mcnally@northwestern.edu.
Find articles by
Crosbie, R.
in:
PubMed
|
Google Scholar
|
1Center for Genetic Medicine, Northwestern University Feinberg School of Medicine, Chicago, Illinois, USA.
2Department of Biochemistry and Molecular Genetics, University of Colorado Anschutz Medical Campus, Aurora, Colorado, USA.
3Department of Pathology, and
4Comprehensive Transplant Center, Northwestern University Feinberg School of Medicine, Chicago, Illinois, USA.
5Department of Integrative Biology and Physiology, and
6Department of Neurology, David Geffen School of Medicine, UCLA, Los Angeles, California, USA.
7Department of Pediatrics, Northwestern University Feinberg School of Medicine, Chicago, Illinois, USA.
8Heart Center, Stanley Manne Children’s Research Institute, Ann & Robert Lurie Children’s Hospital, Chicago, Illinois, USA.
9Department of Pharmacology, Northwestern University Feinberg School of Medicine, Chicago, Illinois, USA.
Address correspondence to: Alexis R. Demonbreun, Center for Genetic Medicine, Northwestern University, 303 E Superior SQ 5-512, Chicago, Illinois 60611, USA. Phone: 312.503.6249; Email: alexis.demonbreun@northwestern.edu. Or to: Elizabeth M. McNally, Center for Genetic Medicine, Northwestern University, 303 E Superior SQ 5-516, Chicago, Illinois 60611, USA. Phone: 312.503.5600; Email: elizabeth.mcnally@northwestern.edu.
Find articles by
Thorp, E.
in:
PubMed
|
Google Scholar
|
1Center for Genetic Medicine, Northwestern University Feinberg School of Medicine, Chicago, Illinois, USA.
2Department of Biochemistry and Molecular Genetics, University of Colorado Anschutz Medical Campus, Aurora, Colorado, USA.
3Department of Pathology, and
4Comprehensive Transplant Center, Northwestern University Feinberg School of Medicine, Chicago, Illinois, USA.
5Department of Integrative Biology and Physiology, and
6Department of Neurology, David Geffen School of Medicine, UCLA, Los Angeles, California, USA.
7Department of Pediatrics, Northwestern University Feinberg School of Medicine, Chicago, Illinois, USA.
8Heart Center, Stanley Manne Children’s Research Institute, Ann & Robert Lurie Children’s Hospital, Chicago, Illinois, USA.
9Department of Pharmacology, Northwestern University Feinberg School of Medicine, Chicago, Illinois, USA.
Address correspondence to: Alexis R. Demonbreun, Center for Genetic Medicine, Northwestern University, 303 E Superior SQ 5-512, Chicago, Illinois 60611, USA. Phone: 312.503.6249; Email: alexis.demonbreun@northwestern.edu. Or to: Elizabeth M. McNally, Center for Genetic Medicine, Northwestern University, 303 E Superior SQ 5-516, Chicago, Illinois 60611, USA. Phone: 312.503.5600; Email: elizabeth.mcnally@northwestern.edu.
Find articles by
Demonbreun, A.
in:
PubMed
|
Google Scholar
|
1Center for Genetic Medicine, Northwestern University Feinberg School of Medicine, Chicago, Illinois, USA.
2Department of Biochemistry and Molecular Genetics, University of Colorado Anschutz Medical Campus, Aurora, Colorado, USA.
3Department of Pathology, and
4Comprehensive Transplant Center, Northwestern University Feinberg School of Medicine, Chicago, Illinois, USA.
5Department of Integrative Biology and Physiology, and
6Department of Neurology, David Geffen School of Medicine, UCLA, Los Angeles, California, USA.
7Department of Pediatrics, Northwestern University Feinberg School of Medicine, Chicago, Illinois, USA.
8Heart Center, Stanley Manne Children’s Research Institute, Ann & Robert Lurie Children’s Hospital, Chicago, Illinois, USA.
9Department of Pharmacology, Northwestern University Feinberg School of Medicine, Chicago, Illinois, USA.
Address correspondence to: Alexis R. Demonbreun, Center for Genetic Medicine, Northwestern University, 303 E Superior SQ 5-512, Chicago, Illinois 60611, USA. Phone: 312.503.6249; Email: alexis.demonbreun@northwestern.edu. Or to: Elizabeth M. McNally, Center for Genetic Medicine, Northwestern University, 303 E Superior SQ 5-516, Chicago, Illinois 60611, USA. Phone: 312.503.5600; Email: elizabeth.mcnally@northwestern.edu.
Find articles by McNally, E. in: PubMed | Google Scholar
Published July 6, 2026 - More info
JCI Insight. 2026;11(15):e205137. https://doi.org/10.1172/jci.insight.205137.
© 2026 Lee et al. This work is licensed under the Creative Commons Attribution 4.0 International License. To view a copy of this license, visit http://creativecommons.org/licenses/by/4.0/.
Received: January 28, 2026; Accepted: June 16, 2026


-
Results
Loss of ANXA6 worsens muscle histopathology and function of Dysf mice. Dysferlin and ANXA6 participate in plasma membrane repair and resealing after injury, while dystrophin and sarcoglycans maintain membrane stability (Figure 1A). To understand the role of ANXA6 in muscle, we characterized muscle histopathology in Anxa6–/– mice (39), in which exon 3 of Anxa6 was disrupted. These mice, referred to as A6–/– mice, demonstrated few pathological findings (Supplemental Figure 1; supplemental material available online with this article; https://doi.org/10.1172/jci.insight.205137DS1). ANXA1 was mildly increased in A6–/– muscle (Supplemental Figure 1B). To determine whether ANXA6 contributes to membrane resealing in coordination with dysferlin, we crossed A6–/– mice with Dysf mice that lack dysferlin implicated in membrane repair, producing DysfA6 mice. Compared with Dysf muscle, DysfA6 muscle exhibited a pronounced increase in mononuclear infiltration, including PDGFRα+ fibroblasts, interstitial fibrosis, and fiber size variability (Figure 1B). DysfA6 muscle had an increase in smaller myofibers and variability in myofiber size, and a 3-fold increase in myofibers with centralized nuclei compared with Dysf muscle (Figure 1, C–E, and Supplemental Figure 2). DysfA6 mice also had reduced body weight–normalized peak torque and voluntary movement, measured by stereotypical and vertical movements (Figure 1, F and G). Serum creatine kinase (CK) levels, a clinical marker indicative of muscle injury and sarcolemmal leak, was elevated in DysfA6 mice compared with wild-type (WT) and Dysf mice (Figure 1H).
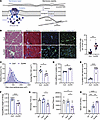 Figure 1
Ablation of the 2 membrane repair proteins, ANXA6 and dysferlin (DysfA6), intensifies dystrophic histopathology and reduces activity compared with Dysf alone. (A) Ablation of ANXA6 in addition to dysferlin (DysfA6) delays repair and prolongs the membrane leak compared with Dysf. (B) Representative images of quadriceps muscle from Dysf and DysfA6 mice are shown, with DysfA6 muscle exhibiting greater variation in myofiber size, increased mononuclear cell infiltrate, and fibrosis, confirmed by PDGFRα and LAMA2 staining and quantification of PDGFRα+ cells per 10,000 μm2. Small circles depict counts from each field of view (n = 5 mice per genotype, 5 images across 2 sections per mouse), and large circles depict average per mouse. Statistical testing compared the averages per animal. (C) Myofiber cross-sectional area (CSA) distribution and average confirmed DysfA6 muscles had reduced myofiber size with greater numbers of smaller myofibers than Dysf muscle. (D) DysfA6 muscle had increased variability of myofibers and (E) increased percentage of myofibers with internal myonuclei than Dysf muscle. (F) DysfA6 had reduced muscle function, demonstrated by reduced normalized peak torque, compared with Dysf muscle. (G) DysfA6 mice had reduced voluntary activity compared with Dysf mice, seen as reduced time spent in stereotypy behaviors and vertical movements. (H) Serum creatine kinase (CK), an indicator of muscle leak, was greater in DysfA6 mice compared with Dysf mice (n = 4–7 mice per genotype). *P < 0.05; **P < 0.01; ***P < 0.005; ****P < 0.001 by 2-tailed Student’s t test for comparison between 2 groups (B–F) and 1-way ANOVA for comparisons across 3 groups (G and H) followed by Tukey’s multiple comparisons test. Scale bars: 100 μm.
To investigate the effect of delayed sarcolemmal resealing in DysfA6 muscle, we used Evans blue dye (EBD) and visualized the spatial distribution of EBD+ fibers (40). DysfA6 muscle had 19-fold more EBD+ myofibers than Dysf muscle (Figure 2, A and B). We used a laser to disrupt the sarcolemma of isolated Dysf and DysfA6 myofibers in the presence of FM 4-64 dye, which marks membrane lesions. Over 260 seconds after injury, DysfA6 myofibers consistently displayed increased FM 4-64 in all pairwise comparisons compared with Dysf myofibers, consistent with slower membrane resealing in DysfA6 myofibers (Figure 2, C and D). Additionally, neutral lipids were increased in DysfA6 compared with Dysf muscle, as seen by Oil Red O staining, suggesting that the loss of ANXA6 further exacerbates altered lipid handling in Dysf muscle (41, 42) (Figure 2E). DysfA6 muscle had increased immune infiltration marked by CD11b, a marker of leukocytes, and F4/80, a marker of macrophages, relative to Dysf muscle (Figure 2F). Together, these data demonstrate a synthetic effect of eliminating 2 distinct membrane repair proteins, ANXA6 and dysferlin, slowing membrane resealing, promoting membrane leak, and eliciting heightened inflammatory cell infiltration.
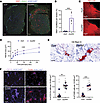 Figure 2
Muscle lacking both dysferlin and ANXA6 (DysfA6 muscle) has more sarcolemmal leak, delayed sarcolemmal repair, and more macrophage infiltration compared with Dysf muscle. (A) Mice were injected with Evans blue dye (EBD), and red EBD+ myofibers were visualized, demonstrating more EBD+ fibers in DysfA6 quadriceps muscles compared with Dysf muscle. LAMA2 (green) outlines the myofibers. (B) Quantification of EBD+ myofibers in Dysf and DysfA6 muscle (n = 5 mice per genotype, 2 sections per mouse). (C) Myofibers were isolated from flexor digitorum brevis muscle and injured using a laser in the presence of FM 4-64 dye (red) to mark the injury area. Representative image of laser-injured Dysf and DysfA6 myofibers with injury area marked in red, showing increased FM 4-64 area in DysfA6 myofibers compared with Dysf myofibers. (D) Kinetics analysis showing all pairwise comparison at each assessed time point demonstrating greater FM 4-64 area in DysfA6 than Dysf myofibers (n = 20 total myofibers from n = 3 mice, 2 muscles each, total 6 muscles), consistent with delayed and inefficient myofiber repair. (E) DysfA6 muscle had more neutral lipid deposits (Oil Red O) than Dysf muscle. (F) DysfA6 muscle had more leukocyte and macrophage infiltration (CD11b and F4/80, respectively) compared with Dysf (counts per 10,000 μm2). Small dots depict counts from each field of view (n = 5 mice per genotype, 5 images across 2 sections per mouse); large dots depict average per mouse. **P < 0.01, ***P < 0.005 by 2-tailed Student’s t test for comparisons between averages per mouse. Scale bars: 500 μm (A), 6 μm (C), and 100 μm (E and F).
Fibroblasts/fibro-adipogenic precursors and macrophages/myeloid cells are the predominant mononuclear cell type in Dysf and DysfA6 muscle. This heightened inflammatory infiltration both reflects, and likely, contributes to the more intense pathology in DysfA6 muscle. To characterize this response, the mononuclear cell fraction of muscle was isolated and analyzed by single-cell RNA-seq (scRNA-seq). Multiple muscles were combined, including the quadriceps, diaphragm, and paraspinal muscles from 4-month-old Dysf and DysfA6 mice, and muscles were digested and filtered to remove large muscle fibers, leaving mononuclear cells with greater than 80% viability (n = 2 per genotype, 4 mice total). Samples from each mouse were separately processed on the droplet-based platform, sequenced, and then data were combined; this strategy mitigates biological variability across muscle groups and animals (Figure 3A). Uniform Manifold Approximation and Projection (UMAP) and unbiased clustering analysis of 82,370 mononuclear cells (Dysf = 41,655, DysfA6 = 40,715) identified 8 major cell types based on known marker gene expression. In this analysis, platelets were removed, and tenocytes were combined with fibroblasts. We confirmed a consistent distribution of different cell types across the 2 mice for each genotype. In both Dysf and DysfA6 muscle, the macrophage/myeloid populations constituted the largest subtype, followed by fibroblast/fibro-adipogenic precursor (FAP), and together these groups contributed to the more than 60% of the mononuclear cells isolated from muscle (Figure 3, B and C).
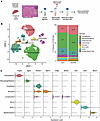 Figure 3
Fibroblasts/FAPs and macrophages/myeloid cells dominate the mononuclear cell populations in Dysf and DysfA6 muscle. (A) Dysf and DysfA6 muscles were homogenized, combined, and large myofibers were removed using size exclusion filtration. The unselected, mononuclear cell fraction was then analyzed by scRNA-seq (~20,000 cells per mouse, 2 mice of each genotype, total of ~82,000 cells). (B) UMAP analysis identified 8 major cell types comprising the mononuclear cell fraction with macrophages/myeloid cells and fibroblasts/FAPs contributing to greater than 60% of the mononuclear cells. (C) Violin plots depict canonical gene expression markers for the cell populations in B. MuSC, muscle satellite cells.
Mertk and Trem2 expression is enriched in Dysf and DysfA6 muscle myeloid cells compared with mdx muscle. We analyzed the macrophage/myeloid cell population from DysfA6 and Dysf muscle. Based on known marker gene expression, we identified 11 different myeloid cell populations, ranging from subtypes of macrophages to dendritic cells and neutrophils. In both models, the Mertk+Trem2+ macrophage population was the largest myeloid cell group, followed by Spp1+ macrophages (Figure 4A and Supplemental Figure 3, A and B). TREM2 is a lipid-binding receptor, and MERTK works together with TREM2 to facilitate phagocytosis (43, 44). MERTK, a member of the TAM receptor family, mediates the recognition and engulfment of injured cells through interaction with the externalized PS, an “eat-me” signal on the cell membrane (21, 27). Notably, the macrophage subpopulations did not group by the canonical M1 and M2 classification and instead displayed a broader diversity of subtypes (Supplemental Figure 3C).
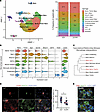 Figure 4
Mertk+Trem2+ macrophages are the largest subtype of macrophages. (A) Adgre1+ (F4/80) myeloid cells from the Dysf and DysfA6 mononuclear cell fraction were analyzed by UMAP to identify macrophages, neutrophils, and dendritic cells. Mertk+Trem2+ macrophages constitute the largest subtype. (B) Expression of select genes across macrophage subtypes, highlighting the relatively low Spp1 expression in Mertk+Trem2+ macrophages. (C) The dendrogram based on gene expression profiles identifies relationships among macrophage subtypes showing that Mertk+Trem2+ macrophages are distinct from Spp1+ macrophages. (D) MERTK protein signal (green) was more abundant in DysfA6 compared with Dysf muscle, and approximately 50%–60% of macrophages expressed MERTK in Dysf and DysfA6 muscle (n = 5 mice per genotype, 4–5 images across 2 sections per mouse). (E) MERTK (green) signal clustered around EBD+ (red) myofibers in DysfA6 muscle. *P < 0.05 by 2-tailed Student’s t test for comparisons between averages per mouse. Scale bars: 100 μm.
Duchenne muscular dystrophy (DMD), a distinct genetic disorder, is caused disruption of the dystrophin gene (4), producing a fragile sarcolemma distinct from defective repair in dysferlinopathy (6). In mdx mice, a DMD model, Spp1+Lgals3+ macrophages were identified as the dominant pathological macrophage population (33, 38). While this subgroup was present, Mertk+Trem2+ macrophages constituted the largest macrophage population in Dysf and DysfA6 muscle. Mmp12+Gdf15+, muscle-resident, monocyte-derived, proliferating macrophages were in common to Dysf, DysfA6, and mdx (33, 36). Timd4+ macrophages, which were identified in acutely injured muscle (45), were also present in Dysf and DysfA6 muscle (Figure 4B). Hierarchical dendrogram clustering delineates the transcriptional relationships between macrophage subpopulations and confirmed that Mertk+Trem2+ is divergent from Spp1+ macrophages, consistent with being distinct subtypes (Figure 4C). Immunofluorescence microscopy (IFM) imaging of MERTK protein in muscle revealed that MERTK was expressed in approximately 50%–60% of Dysf and DysfA6 F4/80+ macrophages (Figure 4D). Although Dysf exhibited a higher proportion of MERTK+ macrophages than DysfA6, this is likely attributable to the significantly lower overall macrophage abundance in Dysf muscle (Figure 2F). MERTK+ cells clustered around EBD+ myofibers in DysfA6 muscle (Figure 4E), consistent with leaking fibers as macrophage attractants. Together, these data document that excess membrane leak driven by impaired membrane repair elicits distinct major macrophage populations compared with mdx muscle, suggesting the mode of muscle injury produces a differential macrophage response.
mdx muscles have minimal MERTK expression around damaged fibers. We also generated mdxA6 mice that lacked both dystrophin and ANXA6. Unlike Dysf, loss of ANXA6 in mdx mice did not exacerbate disease pathology, as inflammation and fibrosis were similar to those in mdx muscle (Supplemental Figure 4). EBD uptake into myofibers occurs in dystrophin-deficient muscle, related to the fragile sarcolemma (46). We compared myofiber leak, reflected by EBD intensity, across the 4 models since EBD has been shown to distinguish among types of cellular injury (47). Mice from all 4 genotypes were injected with EBD, and muscles were harvested and imaged identically. mdx and mdxA6 muscle had strongly EBD-positive fibers, often clustered into groups of very bright EBD signal. This pattern differed from EBD uptake in Dysf and DysfA6 muscle, where many more individual EBD+ fibers with much lower EBD intensity were broadly distributed across the muscle (Figure 5, A–C). We interpreted the brightly stained EBD+ myofibers in mdx and mdxA6 as reflecting a larger-scale membrane disruption from the mdx’s inherent sarcolemmal instability. In contrast, Dysf and DysfA6 have a more distributed, lighter EBD pattern, reflecting smaller-scale injury with resealing defects and prolonged leak. While delayed repair may allow additional EBD uptake, the increased frequency of low-intensity EBD+ fibers in DysfA6 relative to Dysf suggests that the sustained membrane leak is the predominant factor underlying this observation.
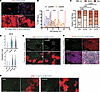 Figure 5
EBD uptake patterns differ between mdx and Dysf myofibers. (A) Dysf, DysfA6, mdx, and mdxA6 mouse muscles analyzed after EBD injections. mdx and mdxA6 muscle had brighter, more intense clusters of EBD+ fibers compared with the diffuse, light EBD uptake pattern seen in Dysf and DysfA6 muscle. (B) The distribution of EBD intensity across muscle sections differed, with DysfA6 muscle displaying more fibers with low EBD intensity compared with the high EBD intensity seen in mdxA6. (C) The relative proportion of low, medium, and high EBD intensity myofibers is shown for the 4 genotypes, Dysf, DysfA6, mdx, and mdxA6 (n = 3 mice per genotype, 4–5 images from 2 sections per mouse). P values derived from the χ2 test. (D) mdx muscle also had little Mertk expression compared with Dysf and DysfA6. The plots show comparably analyzed mdx scRNA-seq (33, 38), compared to Dysf and DysfA6. (E) MERTK (green) was not detected around EBD+ (red) fibers in mdx and mdxA6 muscle (6-month-old animals). (F) Area of high macrophage infiltration (red) in 4-week-old mdx muscles also did not show MERTK expression (green). (G) CASP3 staining was not detected in EBD+ (red) myofibers from mdx and mdxA6 muscle. Scale bars: 100 μm.
We queried scRNA-seq datasets of mdx skeletal muscle at different disease stages (33, 38). We found minimal Mertk expression in mdx macrophages at both 3 months, an age of established disease, and 4 weeks, an age of peak inflammation, compared with Dysf and DysfA6 macrophages, which was confirmed by IFM imaging (Figure 5, D–F). IFM showed that EBD+ fibers in mdx and mdxA6 muscle did not express cleaved CASP3, supporting previous findings that a caspase-independent, necroptotic process is responsible for myofiber death in mdx muscle (48) (Figure 5G). The slow-leak nature of myofiber injury in Dysf and DysfA6 muscle instead is associated with MERTK+ macrophages, similar to what has been described in other acute-tissue-injury settings (28–30).
Impaired sarcolemmal repair leads to increased cleaved CASP3 and elevated macrophage-mediated phagocytosis. To further explore the intrinsic differences in the myofibers, we performed bulk RNA-seq on the myofibers isolated from Dysf and DysfA6; WT myofiber RNA-seq data were previously generated using identical methods (49) and enrichment of the myofibers was confirmed by high expression of sarcomeric genes (Supplemental Figure 5, A and B). Pathway analysis revealed significant enrichment of efferocytosis pathway genes, including Casp3 and Pros1, in Dysf compared with WT, and in DysfA6 compared with Dysf myofibers (Supplemental Figure 5C). Activated CASP3 contributes to the externalization of PS (50), while Pros1 encodes Protein S (PROS1), a secreted protein that serves as a ligand for TAM receptors critical for recognition of target cells with externalized PS, in addition to growth arrest–specific protein 6 (GAS6) (51, 52). In Dysf and DysfA6 muscle, CASP3 signal was seen in and near EBD+ myofibers, especially those myofibers with lighter EBD positivity (Figure 6A), with a similar pattern for PROS1 (Supplemental Figure 5, D and E), consistent with defective repair yielding myofiber signals that draw macrophages primed for phagocytosis. This contrasts with minimal expression of MERTK, CASP3, and PROS1 in or near clusters of EBD+ myofibers in mdx and mdxA6 muscle (Figure 5, D–G, and Supplemental Figure 6A), even in young, hyper-inflamed 4-week-old mdx muscle (Supplemental Figure 6, B–D). In mdx muscle, we noted more PROS1+EBD+ myofibers in the smaller and lighter EBD+ clusters in both mdx and mdxA6 muscle, rather than the large patches of brightly positive EBD where PROS1 was not detected. This pattern is consistent with the concept that lower EBD positivity reflects fibers with delayed repair and not necessarily necrosis. We observed a similar pattern with CASP3 expression (Supplemental Figure 7).
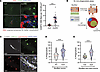 Figure 6
Enhanced CASP3 expression and macrophage phagocytosis of myofibers with impaired membrane resealing. (A) Representative IFM images of EBD-injected Dysf and DysfA6 muscle stained for cleaved caspase-3 (CASP3) demonstrating a subset of EBD+ fibers are CASP3+. Statistical test depicts comparison between averages per mouse. (B) Myofibers were isolated from WT and Dysf mice and loaded with pHRodo dye. WT macrophages were isolated, differentiated, and then stained with LysoTracker (red). Myofibers were incubated with macrophages, and macrophages positive for pHRodo (green) had phagocytosed myofibers. Percentage macrophage phagocytosis was determined by the number of pHRodo+ macrophages divided by the total number of macrophages on or near CASP3+ myofibers. (C) Representative image of a CASP3+ myofiber and macrophages that were both LysoTracker+ and pHRodo+, indicative of phagocytosis (arrow). (D) Dysf myofibers triggered a greater fraction of phagocytic macrophages compared with WT myofibers. (E) Dysf myofibers triggered more phagocytosis compared with mdx myofibers. Ex vivo phagocytosis assay was conducted 3 different times. ***P < 0.005; ****P < 0.001 by 2-tailed Student’s t test. Scale bars: 100 μm (A) and 20 μm (C).
To directly test whether macrophages could phagocytose Dysf myofibers, we adapted an ex vivo phagocytosis assay using bone marrow–derived macrophages from WT mice that were cultured and loaded with LysoTracker. LysoTracker-labeled macrophages were incubated with myofibers isolated from the flexor digitorum brevis (FDB) muscle of either WT or Dysf mice. The trituration process typically results in minor injury sufficient to artificially activate CASP3. After isolation, fibers were loaded with pHRodo dye that emits signal when exposed to lysosomal low pH. To measure phagocytosis, we monitored macrophages positive for both LysoTracker and pHRodo and near or touching CASP3+ myofibers (Figure 6B). Dysf fibers had more macrophages with LysoTracker+/pHRodo+ signals compared with WT, demonstrating impaired membrane repair generates enhanced “eat-me” signals, which then attract macrophages to digest Dysf muscle (Figure 6, C and D). We performed this ex vivo phagocytosis assay on myofibers from mdx and Dysf muscles, using macrophages derived from the same genotype source. We observed reduced phagocytosis of mdx fibers and macrophages compared with Dysf fibers and macrophages (Figure 6E). Although CASP3 activation was not seen as a feature of mdx muscle on IFM (Figure 5G), the fiber isolation protocol in the phagocytosis assay did elicit activation of CASP3. Despite the CASP3 activation ex vivo, phagocytosis of mdx myofibers by macrophages remained low (Figure 6E). While contribution from the disease-specific macrophages cannot be fully excluded, phagocytosis of Dysf myofibers was comparable between WT and Dysf macrophages, implying dysferlin-deficient myofibers promote phagocytosis (Figure 6, D and E). Taken together, these results show that impaired sarcolemmal repair and excessive membrane leak caused by dysferlin deficiency in myofibers contribute to the increased presence of phagocytic macrophages and promote their phagocytic function compared with the more necrotic mdx myofibers.
Increased ANXA1 and ANXA2 deposited into DysfA6 ECM attracts macrophages and affects macrophage-FAP crosstalk. ANXA1 and ANXA2 support the ANXA6-rich repair cap (11, 12), and Dysf muscle ECM is enriched with ANXA2 and ANXA6 (53). To further understand how prolonged membrane leak alters the muscle ECM composition, we evaluated the ECM proteome (matrisome) of WT, Dysf, and DysfA6 muscles using a 3-step ECM-optimized extraction method to characterize both cellular and ECM tissue fractions (54) (Figure 7A). Differentially expressed matrisome proteins between WT and DysfA6 in the CHAPS/NaCl-soluble (cellular) and guanidine-HCl–soluble ECM fractions included ANXA1 and ANXA2 (Figure 7, B–D). Immunoblot analysis of whole muscle lysates confirmed that both ANXA1 and ANXA2 were increased in DysfA6 muscle compared with WT and Dysf (Figure 7E). We decellularized muscle sections to generate myoscaffolds and confirmed the increased deposition of ANXA1 and ANXA2 in DysfA6 ECM via IFM (Figure 7, F and G). Thus, the prolonged sarcolemmal leakage caused by defective membrane repair in DysfA6 promotes excessive deposition of ANXA1 and ANXA2 in the muscle ECM.
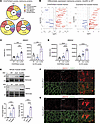 Figure 7
Increased ANXA1 and ANXA2 in DysfA6 muscle and in decellularized myoscaffolds from Dysf muscle. (A) A comparison of proteomic profiles from the CHAPS/NaCl-soluble cellular fraction of WT, Dysf, and DysfA6 muscle shows expansion of ECM-associated proteins (n = 6–7 mice per genotype). (B) Differentially expressed proteins between DysfA6 and WT in the CHAPS/NaCl-soluble cellular and guanidine-HCl–soluble (Gnd-HCl-soluble) ECM fractions of the muscle. (C and D) ANXA1 and ANXA2 were increased in both the CHAPS/NaCl- and Gnd-HCl–soluble fractions of DysfA6 compared with Dysf and WT (n = 6–7 mice per genotype). (E) Immunoblot of whole muscle lysates for ANXA1 and ANXA2 confirmed greater expression in the presence of defective repair. (F and G) Muscle sections were decellularized to generate myoscaffolds and visualize ECM-associated proteins. Increased ANXA1 and ANXA2 deposition was seen in decellularized myoscaffolds of DysfA6 compared with WT and Dysf by IFM. **P < 0.01; ***P < 0.005; ****P < 0.001 by 1-way ANOVA followed by Tukey’s multiple comparisons test. Scale bars: 100 μm.
To investigate how altered ECM composition of DysfA6 muscle influences macrophage behavior, WT macrophages were placed onto decellularized 25-μm-thick myoscaffolds for 24 hours, followed by Z-stack imaging. More macrophages were attracted to Dysf and DysfA6 myoscaffolds compared with WT, with DysfA6 myoscaffolds drawing more macrophages than Dysf (Figure 8A). Macrophages undergo a morphological change when becoming proinflammatory, adopting a “fried-egg” shape (55–57). When placed on Dysf and DysfA6 myoscaffolds, macrophages became more circular compared with the elongated shape on WT myoscaffolds (Figure 8B). These data demonstrate that defective sarcolemmal repair alters the ECM composition, which is sufficient to attract macrophages and promote an altered profile.
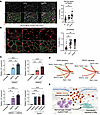 Figure 8
Elevated ANXA1 and ANXA2 expression in DysfA6 ECM promotes expression of Csf1 in macrophages. (A) Muscle cryosections (25 μm) were decellularized, incubated with WT macrophages, and imaged after 24 hours. Z-stack images were acquired and the percentage of macrophages localized on the ECM relative to the total macrophages on the ECM and glass was calculated. More macrophages (F4/80, red) accumulated on Dysf and DysfA6 myoscaffolds compared with WT (n = 3 mice per genotype denoted by color, 2 myoscaffolds per mouse). Macrophages were derived from 3 WT mice, denoted by symbol shapes. (B) WT macrophages exposed to Dysf and DysfA6 myoscaffolds adopted a distinct morphology compared with WT myoscaffolds, with greater increased circularity (arrowhead) induced by Dysf and DysfA6 (n = 3 mice per genotype, 2 myoscaffolds per animal, and 3 images per myoscaffold). Full arrows indicate macrophages with more elongated morphology. (C) Recombinant ANX1 (rANXA1), rANXA2, or combined treatment of macrophages elicited Csf1 expression (macrophages isolated from 3 mice, denoted by symbols, with technical replicates). (D) DysfA6 receptor-ligand gene expression analysis with CellChat revealed that Mertk+Trem2+ macrophages signal to FAPs via GAS6, while FAPs signal to macrophages via PROS1 and GAS6. (E) Prolonged sarcolemmal leak due to impaired membrane repair increased ANXA1 and ANXA2 ECM deposition, recruiting macrophages to the area of leak and promoting macrophage-FAP crosstalk. All the experiments were conducted 3 independent times. **P < 0.01; ***P < 0.005; ****P < 0.001 by 1-way ANOVA followed by Tukey’s multiple comparisons test. Scale bars: 100 μm (A) and 50 μm (B).
We directly exposed macrophages to recombinant ANXA1 and ANXA2, finding dose-dependent effects on Csf1 expression, and a trending additive effect of ANXA1 and ANXA2 (Figure 8C). Csf1 encodes macrophage colony–stimulating factor (M-CSF), which is a chemoattractant factor that promotes survival and proliferation (58, 59). To further understand the signaling crosstalk between macrophages and FAPs, another prominent cell type involved in Dysf muscle pathology (60, 61), we analyzed gene expression for receptor-ligand pairs using CellChat cell-cell communication analysis, focusing on FAPs and Mertk+Trem2+ macrophages that comprise 70% of the macrophages in DysfA6 muscle. This interaction is projected to occur via genes implicated in GAS6 signaling, a pathway associated with TAM receptor–expressing macrophages and implicated in adipogenesis (62–66). FAPs signaled to macrophages via PROS1 and GAS6 pathways (Figure 8D). ANXA2 accumulation around myofibers is known to promote FAP differentiation to adipocyte-like lineages, and loss of ANXA2 is protective in dysferlinopathy (15, 60). Taken together, these data identify that defective membrane repair results in excess ANXA1 and ANXA2 in the ECM, which serves to recruit macrophages. Once recruited, macrophages differentiate and signal to FAPs via the GAS6 pathway, which in conjunction with excess ANXA2, could promote intramuscular fat deposition (Figure 8E).


