Go to The Journal of Clinical Investigation
  • About
  • Editors
  • Consulting Editors
  • For authors
  • Publication ethics
  • Publication alerts by email
  • Transfers
  • Advertising
  • Job board
  • Contact
  • Physician-Scientist Development
  • Current issue
  • Past issues
  • By specialty
    • COVID-19
    • Cardiology
    • Immunology
    • Metabolism
    • Nephrology
    • Oncology
    • Pulmonology
    • All ...
  • Videos
  • Collections
    • In-Press Preview
    • Resource and Technical Advances
    • Clinical Research and Public Health
    • Research Letters
    • Editorials
    • Perspectives
    • Physician-Scientist Development
    • Reviews
    • Top read articles

  • Current issue
  • Past issues
  • Specialties
  • In-Press Preview
  • Resource and Technical Advances
  • Clinical Research and Public Health
  • Research Letters
  • Editorials
  • Perspectives
  • Physician-Scientist Development
  • Reviews
  • Top read articles
  • About
  • Editors
  • Consulting Editors
  • For authors
  • Publication ethics
  • Publication alerts by email
  • Transfers
  • Advertising
  • Job board
  • Contact
Top
  • View PDF
  • Download citation information
  • Send a comment
  • Terms of use
  • Standard abbreviations
  • Need help? Email the journal
  • Top
  • Abstract
  • Introduction
  • Results
  • Discussion
  • Methods
  • Author contributions
  • Funding support
  • Supplemental material
  • Acknowledgments
  • Footnotes
  • References
  • Version history
  • Article usage
  • Citations to this article
Advertisement

Research ArticleEndocrinologyMetabolism Open Access | 10.1172/jci.insight.195341

Gc inhibition preserves insulin sensitivity and reduces body weight without loss of muscle mass

Richard Gill and Taiyi Kuo

Department of Neurobiology, Physiology, and Behavior, University of California Davis, Davis, USA.

Address correspondence to: Taiyi Kuo, Department of Neurobiology, Physiology, and Behavior, University of California Davis, 605 Hutchinson Drive, 1009 Green Hall, Davis, California, 95616, USA. Email: tdkuo@ucdavis.edu.

Find articles by Gill, R. in: PubMed | Google Scholar

Department of Neurobiology, Physiology, and Behavior, University of California Davis, Davis, USA.

Address correspondence to: Taiyi Kuo, Department of Neurobiology, Physiology, and Behavior, University of California Davis, 605 Hutchinson Drive, 1009 Green Hall, Davis, California, 95616, USA. Email: tdkuo@ucdavis.edu.

Find articles by Kuo, T. in: PubMed | Google Scholar |

Published December 8, 2025 - More info

Published in Volume 10, Issue 23 on December 8, 2025
JCI Insight. 2025;10(23):e195341. https://doi.org/10.1172/jci.insight.195341.
© 2025 Gill et al. This work is licensed under the Creative Commons Attribution 4.0 International License. To view a copy of this license, visit http://creativecommons.org/licenses/by/4.0/.
Published December 8, 2025 - Version history
Received: May 7, 2025; Accepted: October 22, 2025
View PDF
Abstract

Obesity and type 2 diabetes (T2D) are metabolic diseases with increasing prevalence worldwide. Obesity often leads to T2D. Insulin resistance and impaired β cell function contribute to the onset of hyperglycemia. Previously, we reported that ablation of Gc, encoding a secreted protein with a primary role in vitamin D transport, improved pancreatic β cell function in models of diet-induced insulin resistance. Here, we show that Gc ablation had systemic insulin-sensitizing effects to prevent weight gain, hyperglycemia, and glucose intolerance; lower nonesterified fatty acids and triglycerides; and augment glucose uptake in skeletal muscle and adipose in male mice fed a high-fat diet. Interestingly, weight loss in Gc-ablated mice resulted from selective fat mass loss with preserved lean mass. Moreover, acute Gc inhibition prevented glucose intolerance caused by high-fat feeding. The data suggest that Gc inhibition can increase insulin production in β cells and insulin action in peripheral tissues, while reducing fat mass.

Graphical Abstract
graphical abstract
Introduction

Obesity, characterized by accumulation of body fat, is a major risk factor for type 2 diabetes (T2D). Fueled by sedentary lifestyle and unhealthy dietary patterns, the prevalence of both obesity and T2D have increased rapidly worldwide, resulting in a double pandemic. Insulin resistance and insulin deficiency due to β cell failure underlie most forms of T2D, and efforts to treat diabetes have therefore been directed toward increasing insulin sensitivity and insulin production (1). During the natural history of T2D, insulin resistance possibly predates β cell abnormalities but remains relatively constant (2, 3), whereas β cell function deteriorates rapidly following the onset of hyperglycemia, as a result of β cells’ failure to increase in mass and produce more insulin in response to insulin resistance (4, 5). Advances in the understanding of the pathophysiology of the disease have shaped diabetes treatment: combinations of agents that improve β cell function with those that decrease insulin resistance are now considered standard therapy (6). In recent years, GLP1R agonist–based approaches coupled with diet and exercise have helped patients to lose up to ~20% of their body weight by increasing insulin secretion in the pancreatic β cells, increasing insulin sensitivity, and reducing appetite. However, there are significant adverse gastrointestinal manifestations with GLP-1 agonists. Also, treatment-associated weight loss is a result of muscle, bone, and adipose tissue reduction. An ideal therapy would reduce fat but not in muscle and bone mass, while minimizing the above treatment-associated side effects that are likely associated with appetite suppression.

Here, we demonstrate that Gc inhibition improves metabolic health without affecting appetite or muscle mass in mice. Gc ablation was previously shown to have no effect on bone mass (7). Moreover, we show that Gc can be effectively targeted and knocked down using an adenoviral system in mice, as it is expressed primarily in the liver and is secreted into the bloodstream. Since its discovery in 1959 (8), Gc has been shown to serve 2 major functions: (a) to transport all vitamin D metabolites and (b) to bind to globular actin to form a Gc-actin complex that prevents actin repolymerization in serum after tissue damage (9). Interestingly, its expression in the pancreas is limited to glucagon-producing α cells (10). However, we discovered that, during the progression of multiparity-, age-, or diet-induced diabetes in mice, Gc expression is ectopically activated in β cells (11). Moreover, in the absence of β cell transcription factors Pax6 or Isl1, Gc expression increases in β cells or whole islets, respectively (12, 13). While its function in the endocrine islet remains unclear, genetic KO of Gc preserved insulin secretory response and β cell function in vivo, as determined by hyperglycemic clamps, and ex vivo in isolated islets (11). Based on human cross-sectional studies, GC variants have been associated with increased fasting glucose and insulin levels, as well as impaired oral glucose tolerance tests (14–20). GC polymorphisms have also been associated with increased susceptibility to T2D (18), obesity (20–25), and dyslipidemia (20, 26, 27). However, these associations provide limited information regarding disease-relevant cell type(s) and mechanism of action. Therefore, the pathophysiological relationships between GC, diabetes, and obesity remain largely unknown. Two individuals nullizygous for GC were identified in case reports from 2019 and 2021 (28, 29), providing evidence that absence of GC is not lethal in humans. However, the metabolic statuses of these individuals have not been investigated.

In the course of experiments using high-fat diet (HFD) to induce insulin resistance and hyperglycemia and to investigate Gc function in the endocrine pancreatic islet, we observed that Gc-deficient mice gained less weight than their control WT littermates. This observation prompted us to conduct an in-depth investigation into the metabolic effects of genetic Gc ablation on systemic insulin sensitivity and insulin action. Here, we show that, in addition to improving β cell function, Gc deletion preserves insulin sensitivity in diet-induced obesity. In hyperinsulinemic-euglycemic clamps, whole-body Gc knockout (GcKO) increases the suppression of hepatic glucose production by insulin, glucose turnover, and glucose uptake in skeletal muscle and adipose tissue. Moreover, indirect calorimetry studies show increased energy expenditure in GcKO mice. Furthermore, HFD-fed GcKO mice show lower fasting glycemia and improved glycemia during glucose and pyruvate tolerance tests, even when their body weight, fat mass, and lean mass are matched to WT. Therefore, Gc inhibition in mice induces weight loss without suppressing appetite and preserves muscle mass while reducing fat mass, suggesting Gc inhibition as a promising potential therapeutic avenue for the treatment of obesity and T2D.

Results

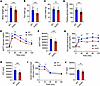
Metabolic profiles of GcKO mice. We placed WT and GcKO mice on a HFD as a metabolic challenge. Following 12 weeks of HFD, GcKO mice showed ~15% lower body weight compared with WT (46.9 ± 1.3 versus 40.0 ± 1.2 g; P < 0.001) (Figure 1A). We utilized dual-energy X-ray absorptiometry to determine body composition. We found that the lower weight of GcKO mice is attributable to a 27% decrease in fat mass (21.0 ± 1.3 versus 15.3 ± 1.0 g; P < 0.005) (Figure 1B), as lean mass did not differ from that of WT mice (28.6 ± 0.8 versus 26.4 ± 0.8 g) (Figure 1C).
Metabolic features of HFD-fed GcKO male mice.Figure 1

Metabolic features of HFD-fed GcKO male mice. (A–C) Body weight (WT n = 23, GcKO n = 30), fat mass (WT n = 23, GcKO n = 30), and lean mass (WT n = 23, GcKO n = 30) of HFD-fed WT and GcKO mice. (D) Fasting glycemia (WT n = 29, GcKO n = 53) of HFD-fed WT and GcKO mice. (E and F) I.p. glucose tolerance tests (ipGTT) performed and AUC calculated in HFD-fed WT (n = 14) and GcKO (n 25) mice. (G) Pyruvate tolerance test (PTT) performed and (H) AUC calculated in HFD-fed WT (n = 10) and GcKO (n = 23) mice. (I) Insulin tolerance test (ITT) performed and (J) AUC calculated in HFD-fed WT (WT = 8) and GcKO (n = 16) mice. “NS” indicates no significant statistical difference. Data are shown as mean ± SEM, *P < 0.05, **P < 0.01, ***P < 0.005 by Student’s t test.

To evaluate the consequences of Gc ablation on glucose metabolism, we performed glucose tolerance tests in WT and GcKO mice. GcKO mice showed a ~22% decrease in fasting glycemia compared with WT (138.1 ± 5.4 versus 108.1 ± 2.7 mg/dL; P < 0.001) (Figure 1D). We observed a significant improvement in glucose tolerance in HFD-fed male GcKO mice compared with WT throughout the 2-hour test (Figure 1, E and F). GcKO mice on chow diet displayed lowered fasting glucose (92 ± 4.1 versus 74 ± 2.7 mg/dL; P < 0.001) but not glucose tolerance compared with WT (Supplemental Figure 1, A–D; supplemental material available online with this article; https://doi.org/10.1172/jci.insight.195341DS1). These data suggest that a nutrient-driven component maintains glucose metabolism in Gc-ablated mice.

Interestingly, HFD resulted in a significant deterioration of glucose tolerance in male, but not female, WT mice (Supplemental Figure 1, E–P). Therefore, we focused further experiments on HFD-fed male mice. Pyruvate tolerance tests showed a consistently lower glycemia throughout the 2-hour time course in male GcKO mice compared with WT, suggesting a significant reduction in ability to convert pyruvate to glucose in the liver (Figure 1, G and H). Furthermore, insulin tolerance tests showed an improvement in glucose levels within the first 30-minute following insulin administration to GcKO mice compared with WT (Figure 1, I and J). These observations prompted us to conduct an in-depth investigation into the metabolic effects of genetic Gc ablation on systemic insulin sensitivity and insulin action.

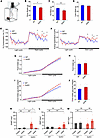
GcKO mice showed increased energy expenditure. To determine whether Gc ablation affected energy homeostasis, we performed indirect calorimetry measurements on HFD-fed WT and GcKO mice (Figure 2A). We first assessed body composition in these mice (Figure 2, B–D). Analyses of indirect calorimetry data found increased oxygen consumption (Figure 2E), carbon dioxide expiration (Supplemental Figure 2A), and energy expenditure (Figure 2F) in GcKO mice, providing a plausible explanation for the reduced body weight compared with WT (Figure 1, A and B, and Figure 2, B and C). Moreover, the increased heat production in GcKO mice did not result from a change in activity (Supplemental Figure 2B). To estimate fat versus carbohydrate utilization, we measured respiratory exchange rate (RER). As both WT and GcKO mice were fed a HFD, their RER was consistently below 0.85, suggesting both groups use fat as the predominant fuel (Supplemental Figure 2C).
Indirect calorimetry shows increased energy expenditure in the absence of GFigure 2

Indirect calorimetry shows increased energy expenditure in the absence of Gc. (A) Schematic of mouse metabolic cage used to study energy homeostasis. (B–D) A group of WT (n = 7) and GcKO (n = 7) male mice were subjected to indirect calorimetry analysis, where their body weights are shown in B, fat mass shown in C, and lean mass shown in D. (E–J) Indirect calorimetry revealed oxygen consumption per light and dark cycle (E), energy expenditure per light and dark cycle (F), food intake per light and dark cycle (G) and per day (H), and food intake normalized to body weight per light and dark cycle (I) and per day (J) for WT and GcKO mice in B. (K–M) Ucp1 gene expression in visceral/epidydimal white adipose tissues (EWAT) (K), s.c./inguinal white adipose tissues (IWAT) (L), and brown adipose tissues (BAT) (M). “NS” indicates no significant statistical difference. Data are shown as mean ± SEM, *P < 0.05, **P < 0.01 by Student’s t test for B, C, D, H, and J, by Student’s t test for E–G and I at different time points between genotypes, or by 2-way ANOVA for K–M.

To assess the contribution of food intake to reduced body weight in GcKO mice, we measured food consumption stratified by light and dark cycles (Figure 2G) and per day (Figure 2H), and we found no significant difference in food consumption between WT and GcKO. To eliminate the confounding by reduced body weight in GcKO, we further normalized food intake to body weight, but we found no statistically significant difference compared with WT (Figure 2, I and J).

Uncoupling protein 1 (Ucp1) is found primarily in brown adipose tissue and functions to generate heat through nonshivering thermogenesis (30). Another member in the uncoupling protein family, Ucp2, is expressed ubiquitously in various tissues including intestine, lung, spleen, gonadal white adipose tissue (WAT), and brown adipose tissue (BAT), and plays a protective role against atherosclerosis and hypertension (31). To examine if browning in WAT contributes to the observed increase in energy expenditure, we measured Ucp1 mRNA levels in visceral/epidydimal WAT (EWAT) and s.c./inguinal WAT (IWAT), as well as BAT. Compared with WT, fasted GcKO showed increased Ucp1 expression in EWAT (Figure 2K), while no significant difference was observed in IWAT or BAT (Figure 2, L and M). As a control, we also measured Ucp2 mRNA levels. No significant difference was found between WT and GcKO EWAT and IWAT (Supplemental Figure 2, D and E). Moreover, fasted GcKO Ucp2 levels in BAT were reduced compared with refed GcKO, fasted WT, and refed WT (Supplemental Figure 2F). Based on the small but significantly elevated Ucp1 levels in fasted GcKO EWAT, browning may contribute to augmented energy expenditure in GcKO mice.

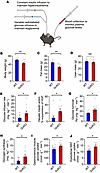
GcKO mice showed improved insulin sensitivity. While the results of ipGTT and ITT (Figure 1) suggest that GcKO mice have improved insulin sensitivity compared with WT, these methods do not eliminate possible confounding by improved insulin secretion or compensatory responses to ITT-induced hypoglycemia, respectively, in GcKO mice (11). We therefore conducted the gold-standard in vivo assessment of insulin sensitivity in HFD-fed WT and GcKO mice: the hyperinsulinemic-euglycemic clamp (Figure 3A) (32). We first performed body composition analysis of WT and GcKO mice (Figure 3, B–D), and we then clamped their glucose levels at ~125 mg/dL using a constant insulin infusion at a rate of 2.5 mU/kg/min and measured the rate of glucose infusion necessary to maintain euglycemia. Compared with WT, GcKO mice need a > 2-fold higher glucose infusion rate to maintain euglycemia (11.3 ± 2.8 versus 4.7 ± 1.0 mg/kg/min; P < 0.04) (Figure 3E). Hepatic glucose production (HGP) in GcKO was suppressed by ~25% following insulin clamp, while the minimal response to insulin in WT mice (~9%; P < 0.03) indicated a failure to meaningfully respond to insulin (Figure 3F).
Hyperinsulinemic-euglycemic clamps in WT and GcKO mice.Figure 3

Hyperinsulinemic-euglycemic clamps in WT and GcKO mice. (A) Schematic of hyperinsulinemic-euglycemic clamp to measure insulin sensitivity in vivo. (B–D) Body weight, fat mass, and lean mass of WT and GcKO mice subjected to hyperinsulinemic-euglycemic clamps. (E) Glucose infusion rate (GIR) in HFD-fed WT and GcKO mice during clamps. (F) Hepatic insulin action, calculated as the ratio of clamp hepatic glucose production (HGP) to basal HGP, and presented as percent suppression. (G) Glucose turnover rate, also known as rate of glucose disposal (Rd). (H) Whole body glycogen synthesis. (I) Glucose uptake in gastrocnemius muscle. (J) Glucose uptake in epidydimal fat pad. Mice are males. WT n ≥ 12, GcKO n ≥ 9. Data are shown as mean ± SEM, *P < 0.05, **P < 0.01 by Student’s t test.

Glucose turnover is significantly higher in GcKO mice compared with WT (23.3 ± 2.5 versus 16.1 ± 0.8 mg/kg/min; P < 0.02) (Figure 3G). GcKO mice also show increased glycogen synthesis compared with WT (6.1 ± 1.5 versus 2.6 ± 0.6 mg/kg/min; P < 0.04) (Figure 3H), while glycolysis was similar in both genotypes. Overall, these data indicate that Gc ablation is associated with preserved insulin sensitivity following HFD, most notably with regard to insulin’s ability to suppress HGP.

Skeletal muscle is the major site of insulin-stimulated glucose uptake (75%–80%) in humans (33). We accordingly examined glucose uptake in skeletal muscle during hyperinsulinemic-euglycemic clamps and found significantly increased glucose uptake in the gastrocnemius muscles of GcKO compared with WT mice (318 ± 27 versus 208 ± 27 nmol/g/min; P < 0.03) (Figure 3I). WAT contributes 10%–20% of whole-body glucose uptake in response to insulin (34, 35). Therefore, we also measured glucose uptake in EWAT and found a significant increase in GcKO compared with WT (19 ± 3.3 versus 10.6 ± 1.5 nmol/g/min; P < 0.05) (Figure 3J). These data demonstrate that, in addition to hepatic insulin sensitivity, Gc ablation preserves insulin action on skeletal muscle and s.c. adipose tissue glucose uptake.

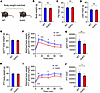
Weight-matched GcKO mice show improved glucose tolerance. To examine the role of body weight in improving the metabolic phenotype of GcKO mice, we selected a group of WT and GcKO mice with matched body weight (WT 41.8 versus GcKO 41.2 g) (Figure 4, A and B). Body composition analysis confirmed that weight-matched WT and GcKO mice have comparable fat (Figure 4C) and lean mass (Figure 4D). Next, we performed glucose tolerance tests to evaluate if weight- and fat mass–matched Gc KOs would still demonstrate improvement in glucose tolerance. Compared with WT, despite having similar body weights measured again on the day of GTT (Figure 4E), GcKO mice showed increased tolerance to glucose (Figure 4, F and G). We also found improved pyruvate tolerance in GcKO mice with body weight matched to WT (Figure 4, H–J). These data indicate that the improved phenotype in GcKO mice, at least in part, is body weight independent.
Dissociation of body weight, fat mass, and glucose and pyruvate tolerance iFigure 4

Dissociation of body weight, fat mass, and glucose and pyruvate tolerance in GcKO mice. (A) Experimental design with body weight–matched WT and GcKO mice. (B–D) Body composition from a selected group of WT and GcKO mice with matched body weight, where their body weights are shown in B, fat mass shown in C, and lean mass shown in D. (E) Body weights of WT and GcKO mice with matched body weight on the day of glucose tolerance tests. (F) Glucose tolerance tests in D. (G) AUC in E. (H) Body weights from a selected group of WT and GcKO mice with matching body weights on the day of pyruvate tolerance tests. (I) Pyruvate tolerance tests of mice in G. (J) AUC in H. Mice are males. WT n ≥ 8, GcKO n ≥ 8. Data are shown as mean ± SEM, *P < 0.05, **P < 0.01, ***P < 0.005 by Student’s t test.

Weight-matched GcKO mice, food intake, and insulin sensitivity. To eliminate possible confounding by reduced body weight on energy expenditure, we again used weight- and fat mass–matched WT and GcKO mice, and we subjected them to indirect calorimetry. Body composition analysis again found that body weight–matched (Figure 5, A and B) WT and GcKO mice have comparable fat mass (Figure 5C) and lean mass (Figure 5D).

Indirect calorimetry in weight-matched WT and GcKO mice shows increased eneFigure 5

Indirect calorimetry in weight-matched WT and GcKO mice shows increased energy expenditure in the absence of Gc. (A) Body weight–matched WT and GcKO mice were subjected to metabolic cages. (B–D) A group of WT (n = 6) and GcKO (n = 9) male mice were subjected to indirect calorimetry analysis, where their body weights are shown in B, fat mass shown in C, and lean mass shown in D. (E–J) Indirect calorimetry revealed oxygen consumption per light and dark cycle (E), energy expenditure per light and dark cycle (F), food intake per light and dark cycle (G) and per day (H), and food intake normalized to body weight per light and dark cycle (I) and per day (J) for WT and GcKO mice in B. Data are shown as mean ± SEM, *P < 0.05, **P < 0.01, ***P < 0.005 by Student’s t test. For E–G, and I, Student’s t test was performed at each time point between genotypes.

Weight-matched GcKO mice show increased oxygen consumption (Figure 5E), carbon dioxide expiration (Supplemental Figure 3A), and energy expenditure (Figure 5F). Consistent with our earlier findings, the increased heat production in GcKO mice did not result from an increase in activity (Supplemental Figure 3B). Both WT and GcKO showed a RER below 0.85 and used fat as the predominant fuel (Supplemental Figure 3C).

To assess the contribution of food intake to the reduced body weight of GcKO mice, we measured food consumption per light and dark cycle (Figure 5G) and per day (Figure 5H). We found no difference in food consumption per day between WT and GcKO (Figure 5, G and H). Moreover, when we normalized food intake to body weight, no difference was found between groups (Figure 5, I and J). These data indicate that Gc ablation leads to increased energy expenditure and that this effect is independent of body weight.

In order to directly determine insulin sensitivity in vivo, and to account for possible confounding by improved insulin secretion and reduced body weight, we performed hyperinsulinemic-euglycemic clamps in body weight–, fat mass–, and lean mass–matched WT and GcKO mice (Supplemental Figure 4, A–C). Compared with WT, GcKO mice showed significantly improved hepatic insulin action measured by percent suppression of HGP (Supplemental Figure 4D) and glucose turnover rate (Supplemental Figure 4E). Therefore, weight-matched GcKO mice consistently show improved insulin sensitivity compared with WT.

Improved insulin signaling in GcKO liver. We next examined whether the preserved insulin sensitivity in GcKO mice was accompanied by changes in gene expression by measuring mRNA levels of several key metabolic genes in the liver, the main site of Gc expression (Supplemental Figure 5A). The liver is a complex tissue that performs a plethora of functions with various cell types, including hepatocytes, hepatic stellate cells, Kupffer cells, and endothelial cells. To further explore the expression of Gc, we searched Mouse Liver Atlas (https://www.livercellatlas.org/), which utilized single-cell CITE-Seq to survey mouse liver transcriptomics (36). We found that Gc is highly expressed in the hepatocytes while sparsely in other liver cell types (Supplemental Figure 5, B and C).

qPCR confirmed that Gc mRNA was effectively ablated in GcKO mice (Supplemental Figure 5D). Levels of mRNA encoding the gluconeogenic rate-limiting enzyme Pck1 were decreased in fasted GcKO mice (Supplemental Figure 5E), while expression levels of gluconeogenic genes G6pase and Fbp1 were decreased in both fasted and refed GcKO mice compared with WT mice (Supplemental Figure 5, F and G), consistent with preserved hepatic insulin action found during the euglycemic clamps. In contrast, there was no difference in the glycolytic gene Gck (Supplemental Figure 5H) or in the glycogen synthase inhibitor Gsk3β (Supplemental Figure 5I).

To investigate the underlying mechanism of improved insulin sensitivity in HFD-fed GcKO mice, we examined insulin-signaling substrates in the liver. We found increased levels of the insulin signaling mediator Akt phosphorylated at serine 473 (normalized to total Akt) in GcKO mice after refeeding (Supplemental Figure 5, J–M), consistent with augmented hepatic insulin action during hyperinsulinemic-euglycemic clamps (Figure 3E).

Increased levels of plasma nonesterified fatty acid (NEFA) impair insulin’s ability to suppress HGP (37) and can cause insulin resistance (38) as well as hepatic lipid accumulation. We found that NEFA levels were decreased by ~17% in GcKO compared with WT (Supplemental Figure 6A). In addition, plasma triglyceride (TG) levels are generally elevated in those with poorly controlled diabetes as well as in those with prediabetes and are thought to predispose to atherosclerosis (39), and we found that TG levels were ~35% lower in GcKO mice compared with WT (Supplemental Figure 6B). In contrast, we did not find differences in total cholesterol plasma levels (Supplemental Figure 6C).

To assess whether the decreased levels of NEFA and TG are a consequence of decreased circulating glucagon during the fasted state, we measured plasma glucagon levels in WT and GcKO mice. While refeeding lowered glucagon secretion in both WT and GcKO, we did not find differences in fasted or refed state between genotypes (Supplemental Figure 6D). These data indicate that Gc ablation did not alter glucagon secretion and that the changes in lipid profiles in GcKO mice are not related to glucagon levels. While there was no difference in hepatic TG levels (Supplemental Figure 6E), we found a ~50% reduction in hepatic glycogen content in GcKO compared with WT (Supplemental Figure 6F), consistent with increased insulin action in skeletal muscle and adipose tissue. These data highlight the contribution of the liver to improved insulin signaling in GcKO mice, and they focus our genome-wide RNA profiling effort to the liver.

RNA-Seq data reveal altered signaling and pathways in the absence of Gc. We performed RNA-Seq on liver extracts from HFD-fed, fasted, and refed WT and GcKO mice. We applied stringent thresholds of P < 0.05 and Padj < 0.1, and we obtained 878 differentially regulated genes (DRGs) comparing GcKO to WT under the refed (2-hour) condition (Figure 6A, Supplemental Figure 7A, and Supplemental Datasets 1 and 2) and 968 DRGs under the fasted (16-hour) condition (Figure 6B, Supplemental Figure 7B, and Supplemental Datasets 3 and 4), followed by gene ontology analysis using Ingenuity Pathway Analysis (Qiagen) (Tables 1 and 2). Table 1 shows gene ontologies enriched in genes differentially regulated in WT versus GcKO under the refed condition, while Table 2 shows these ontologies in WT versus GcKO under the fasted condition.

Heatmaps and immunoblotting of WT and GcKO liver.Figure 6

Heatmaps and immunoblotting of WT and GcKO liver. (A and B) HFD-fed WT and GcKO male mice were fasting for 16 hours (fasted condition), or fasted for 16 hours followed by 2 hours refeeding (refed condition), and subjected for RNA-Seq. Heatmaps represent top differentially expressed genes between refed WT (n = 3) versus refed GcKO (n = 4) (A) and fasted WT (n = 3) versus fasted GcKO (n = 5) mice (A), with TPM ≥ 1. The gray bar on the left highlighted genes of interest in red. (C) Immunoblotting in refed WT and GcKO liver with antibodies against Klf15, Cyp2e1, and GAPDH (internal control). (D) Quantification for Klf15 normalized to GAPDH in C. (E) Quantification of Cyp2e1 normalized to GAPDH in C. Data are shown as mean ± SEM, *P < 0.05, ***P < 0.005 by Student’s t test.
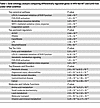
Table 1

Gene ontology analysis comparing differentially regulated genes in HFD-fed WT and GcKO liver under refed condition
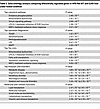
Table 2

Gene ontology analysis comparing diferentially regulated genes in HFD-fed WT and GcKO liver under fasted condition

Comparing liver DRGs in WT and GcKO (Tables 1 and 2), LPS/IL-1–mediated inhibition of Rxr function and Nrf2-mediated oxidative stress response pathways are common pathways to both fasted and refed conditions. Next, Acox1 and Ppara are top upstream regulators unique to the refed condition (Table 1), while Tead1 is unique to the fasted condition (Table 2). In contrast, dexamethasone and LPS are top upstream regulators common to both fasted and refed conditions. Furthermore, fatty acid metabolism is common among the top toxic lists in both conditions, and altered lipid metabolism is common among the top molecular and cellular function lists (Tables 1 and 2). In contrast, altered amino acid metabolism is unique to the refed condition (Table 1), while altered carbohydrate metabolism is unique to the fasted condition (Table 2).

Refed GcKO mice showed reduced Cyp8b1 expression in the liver compared with WT. Interestingly, Cyp8b1-KO mice were resistant to Western diet–induced body weight gain, hepatic steatosis, and insulin resistance (40) (Figure 6A and Supplemental Figure 7A). Moreover, we found lower levels of Hsd11b1, which encodes the enzyme that catalyzes the interconversion of inactive cortisone to active cortisol. Increased HSD11B1 is associated with metabolic disorders in patients with obesity (41) (Figure 6A and Supplemental Figure 7A). Similarly, GcKO mice showed reduced levels of Cyp2e1, which encodes an enzyme increased in nonalcoholic fatty liver disease (NAFLD) and nonalcoholic steatohepatitis (NASH) (42) in the liver (Supplemental Figure 7A). KLF15 plays a role in negatively regulating HGP after refeeding (43), and ablation of Gc reduced hepatic Klf15 levels (Figure 6A and Supplemental Figure 7A). Furthermore, CERK positively regulates the protein expression of NRF2, which is crucial to maintaining redox homeostasis (44). Our data suggest that deletion of Gc increases Cerk to help maintain redox homeostasis in the liver under metabolic challenges (Figure 6A and Supplemental Figure 7A). Liver-specific overexpression of lipoprotein lipase improves glucose metabolism in HFD-fed mice (45). Here, we found that GcKO mice showed increased Lpl in the liver, consistent with the improved glucose tolerance in GcKO mice (Figure 6A and Supplemental Figure 7A). These expression changes in the liver can help explain the improved metabolic profile in GcKO mice.

Based on the above gene ontology analysis focused on liver-related genes, we hypothesize that changes in oxidative stress and gluconeogenic pathways are mechanisms underlying the observed improved metabolic phenotypes in GcKO mice. To test this hypothesis, we performed Western blotting to measure protein levels of Klf15 and Cyp2e1 (Figure 6C). It has been shown that acute depletion of hepatic Klf15 in mouse results in reduced mRNA levels of gluconeogenic genes Pck and G6pc and improves glucose tolerance in db/db mice compared with WT (43). These improved metabolic phenotypes in Klf15-knockdown mice are consistent with those of GcKO mice (Figure 1, E–H, and Supplemental Figure 5, C and D). Interestingly, we found that GcKO mice showed a ~60% reduction of hepatic Klf15 protein levels (Figure 6D). These results suggest that Klf15 could mediate the effect of Gc in the liver.

Hepatic CYP2E1 is increased in murine models of steatohepatitis and in patients with NASH (46). While hepatic cytochrome P450s, such as Cyp2e1, play central roles in metabolizing toxic xenobiotics, superoxide anions and hydrogen peroxide produced during this process contribute to hepatic oxidative stress (47). Chronic hepatic oxidative stress can lead to mitochondrial dysfunction, liver injury, and metabolic disorders. To this end, we assessed Cyp2e1 protein levels in WT and GcKO liver, and we found that, in GcKO liver, Cyp2e1 protein levels are reduced compared with WT (Figure 6E). These results suggest that deletion of Gc could have a protective effect against hepatic oxidative stress.

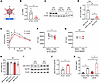
Acute lowering of Gc levels improves glucose tolerance in HFD-fed mice. The changes observed in GcKO mice may reflect adaptive changes to chronic Gc deficiency. To investigate whether acute inhibition of Gc levels can improve insulin sensitivity, we injected adeno-associated virus (AAV8) carrying shRNA against Gc (sh-Gc) (Figure 7A) to inhibit Gc production in the liver of HFD-fed mice, compared with control (sh-scr). Expression analyses confirmed that sh-Gc decreased Gc mRNA (Figure 7B) and protein levels (Figure 7, C and D) by ~70% in whole liver. Three weeks after injection, we performed glucose tolerance tests and found a significant improvement in glucose tolerance in sh-Gc mice compared with sh-scr (Figure 7E). Analyses of individual mice before and after AAV injection indicate that the decrease occurred across the board in virtually all mice examined (Figure 7F). In contrast, no significant difference was observed in sh-scr–injected mice (Figure 7G). Moreover, this improvement of glucose tolerance was not accompanied by weight loss (Figure 7H). This result suggests that the beneficial effects in Gc-null mice have body weight–dependent and body weight–independent components. Additionally, we observed elevated hepatic phosphorylated Akt levels in mice receiving sh-Gc injection (Figure 7, I and J). Interestingly, acute ablation of Gc also improved plasma insulin levels after refeeding (Figure 7K).
Inhibition of hepatic Gc with adeno-associated virus (AAV).Figure 7

Inhibition of hepatic Gc with adeno-associated virus (AAV). (A) Schematic of adeno-associated virus (AAV) targeting Gc in vivo. (B) Gc expression in WT mice injected with AAV encoding shRNA against control (sh-scr) or Gc (sh-Gc). (C) Immunoblotting of liver Gc and internal control β-actin in WT mice injected with AAV carrying sh-scr or sh-Gc. GcKO mice were used as a negative control. (D) Quantification of B. (E) Glucose tolerance tests in WT mice injected with control (sh-scr, n = 4) or Gc (sh-Gc, n = 8) shRNA. (F) AUC from glucose tolerance tests in individual WT mice before and after AAV sh-Gc injection (n = 8). (G) AUC from glucose tolerance tests in individual WT mice before and after AAV sh-scr injection (n = 4). (H) Body weight of mice before and after sh-scr (n = 4) or sh-Gc (n = 8) AAV injection. (I) Immunoblotting of insulin signaling substrates in the liver of mice receiving sh-scr or sh-Gc AAV injection. (J) Quantification of H. (K) Plasma insulin levels in sh-scr and sh-Gc mice in fasted and refed conditions. Data are shown as mean ± SEM, *P < 0.05, **P < 0.01, ***P < 0.005 by Student’s t test in B, E–G, and J, 1-way ANOVA in D, or 2-way ANOVA in H and K.
Discussion

Previously, we reported that Gc is ectopically activated in β cells in diet-induced obesity and contributes to β cell dedifferentiation and dysfunction. Ablation of Gc resulted in increased insulin secretion in hyperglycemic clamps in HFD-fed animals and in isolated islets, which indicate a role of Gc in diabetic pancreatic β cell failure (11). The main findings of the current work are: (a) Gc ablation in mice reduced fat mass and body weight following HFD, and it lowered fasting glycemia, plasma NEFA, and TG levels; (b) Gc-deficient mice also showed improved insulin sensitivity in liver, adipose tissue, and skeletal muscle and improved glucose and pyruvate tolerance; (c) there were no alterations in food intake in Gc-deficient mice; (d) acute inhibition of Gc, achieved using adeno-associated virus to target hepatic Gc mRNA, improved glucose tolerance in HFD-fed mice; and (e) improvements in hepatic oxidative stress and gluconeogenic pathways provide an explanation for the augmented insulin sensitivity in the Gc-ablated liver. The present data add a potentially new and unforeseen dimension to the gamut of Gc functions by demonstrating that its ablation preserves insulin sensitivity when mice are fed a metabolically unhealthy diet. Thus, Gc inhibition has a dual effect to maintain β cell insulin secretion and insulin sensitivity. The weight reduction in Gc-ablated mice did not result from appetite suppression, suggesting that the effects occur primarily through a brain-independent mechanism. Moreover, the weight loss in the absence of Gc resulted from fat mass reduction and spared muscle mass. Finally, adding to the potential translational interest of these observations is the fact that Gc can be targeted either as a circulating factor or through the liver, where it is primarily expressed.

Gc is primarily a vitamin D binding protein (48). About ~85% of circulating 25-hydroxyvitamin D [25(OH)D] is bound to Gc, with the remainder weakly bound to albumin, from which it becomes dissociated in order to enter tissues. Only ~0.03% of 25(OH)D circulates freely in blood and has direct access to target cells. Both the free and albumin-bound 25(OH)D fractions are viewed as bioavailable and engage in their metabolic functions (49). In contrast, Gc-bound vitamin D and its metabolites are biologically unavailable, with the exception of tissues such as the kidney that express the megalin/cubilin transport system, which allows for Gc-bound 25(OH)D to enter cells (50, 51). The half-life of circulating Gc is 2.5–3 days. Gc possesses a single binding site for all vitamin D metabolites, including the active form of vitamin D — 1,25 (OH)2D — and the parental form of vitamin D, with highest affinity for the latter and major form of plasma vitamin D — 25(OH)D (48). Although Gc-bound 25(OH)D is mostly biologically unavailable, Gc acts as a reservoir for circulating 25(OH)D by increasing its half-life, as 25(OH)D is rapidly metabolized and excreted in the urine in the absence of Gc (7). While total concentrations of 25(OH)D and 1,25(OH)2D in Gc-deficient mice (7) and in nullizygous GC humans (28, 29) are extremely low, calcium and bone homeostasis remain relatively normal. Therefore, Gc-null mice only showed a mild bone mineralization defect when placed on a vitamin D–deficient diet for 4 weeks (7). Furthermore, Gc plays a role in transporting fatty acids (52). These findings are consistent with the possibility that there are other functions of Gc, in addition to transporting vitamin D.

The relationship between diabetes and vitamin D levels has long been debated. Several observational and physiological studies have linked vitamin D insufficiency with β cell dysfunction, insulin resistance, and obesity, both in adults and children (53). However, the pivotal D2d clinical trial, a randomized control trial in individuals at risk of developing diabetes, showed no statistically significant benefit from vitamin D supplementation (54), nor did similar trials (55, 56). Thus, the balance of probabilities is that the effect of Gc deficiency is independent of vitamin D levels, especially since the latter tend to be low in the plasma when Gc is ablated. This point was further demonstrated by the identification of a patient homozygous for GC loss-of-function mutations (29). Although this patient has undetectable GC protein with very low 25(OH)D and 1,25(OH)D levels, they had no apparent bone abnormalities.

If what we currently know about Gc’s primary function as a vitamin D binding protein is not the whole story, what additional function can Gc possess? A report on plasma proteome association with human diseases and traits provides a few insights (57). A total of 660 human diseases were analyzed for its association with GC protein (https://proteome-phenome-atlas.com/) (57). Among them, GC protein is the most significantly and positively associated with disorders of lipoprotein metabolism in endocrine disorders and digestive system diseases (P < 0.01) (Supplemental Table 1). These associations provide further clues to deciphering the function of GC protein in metabolism.

Case reports of 2 individuals who are homozygous null for mutations in GC confirmed its role as a vitamin D carrier (28, 29). The first patient was a 58-year-old woman who carried two 139 kb deletions spanning the gene body of GC as well as 133 kb deletions eliminating part of another gene, neuropeptide FF receptor 2 (NPFFR2). She had a history of musculoskeletal pain, fragility fractures, and ankylosing spondylitis as well as extremely low plasma levels of vitamin D and its metabolites. Although she had diabetes, it was well controlled on metformin (J. Marcadier, personal communication; University of Calgary, Calgary, Alberta, Canada) and was associated with additional comorbidities, including hypertension, dyslipidemia, NAFLD, and autoimmunity, that may have metabolic effects of their own (28). The second patient was a 60-year-old man homozygous for pathogenic variants affecting a canonical splice site in GC and had undetectable to low levels of 25(OH)D and 1,25(OH)2D (29). He otherwise did not phenocopy the first patient, suggesting the first patient’s fragility fractures were attributable to her rheumatic disease rather than vitamin D deficiency. Additional clinical differences may be due to other background genetic differences, possibly including those within or near the NPFFR2 deletion. It should be emphasized that our experiments show beneficial effects of ~70% Gc inhibition in mice and, together with the case reports of viable GC null individuals, suggest that the therapeutic window of inhibition necessary for metabolic benefits can be safe in humans.

We are left with the question of how Gc deficiency promotes insulin sensitivity. There are precedents for circulating proteins that modulate insulin action — for example, adiponectin (58), Resistin (59), and Rbp4 (60). The beneficial effects of Gc ablation in HFD-fed GcKO mice run the gamut from decreased weight and fat mass to decreased HGP, NEFA, and TG and increased insulin action on glucose transport. This combination of actions is most consistent with a systemic insulin-like property associated with Gc ablation. One possibility is that Gc carries 1 or more biochemical entities that confer insulin resistance; thus, its ablation confers protection against this agent(s). Alternatively, Gc can act to prop up insulin receptor signaling, either by acting at the cell membrane or through some heretofore unrecognized intracellular mechanism. However, the latter would require that Gc be taken up by cells, and this property appears to be limited to the kidney. More work will be required to address these questions.

Single-cell CITE-Seq in mouse liver revealed that hepatocytes express the highest level of Gc among liver cell types (36), which suggests an involvement of hepatocytes in conferring the improved metabolic phenotypes in the absence of Gc. Moreover, adeno-associated virus serotype 8 (AAV8) was chosen for the acute Gc-KO experiment for its strong affinity and high efficiency in targeting hepatocytes (61). However, determination of whether the observed phenotypes resulted from hepatocyte cell autonomous actions and/or paracrine effects between liver cell types will require further investigation.

From a therapeutic standpoint, there remains an unmet need for a single drug acting as insulin secretagogue, insulin sensitizer (62), and fat mass–reducing agent, without appetite suppression or muscle loss. Thiazolidinediones, whose use has fallen out of fashion due to a combination of adverse side effects and regulatory setbacks (63), remain the only class of drugs consistently associated with an effect on diabetes prevention (64–66). They also show consistently lower secondary failure rates than metformin, sulfonylureas (67), and GLP1-RA (68). In addition to insulin sensitization, Gc inhibition appears to also protect against β cell dysfunction and increase insulin secretion. Adipose tissue browning can dissipate energy through Ucp1 and has garnered attention as a way to rid of excess energy (69), suggesting that the human body has built-in capacities to eliminate excess calories. We observed a small but significant elevation of Ucp1 mRNA in fasted GcKO EWAT; however, this magnitude of UCP1 mRNA elevation and associated potential browning/beigeing in EWAT, if any, is unlikely to be sufficient to explain the increased whole-body energy expenditure in GcKO mice. Future directions will include investigating Ucp-1–independent thermogenesis processes, such as calcium cycling, creatine-substrate cycling, and lipid cycling (70, 71), to provide mechanistic insights into elevated energy expenditure in the absence of Gc. There is a need for therapeutics that can address β cell function, peripheral insulin action, and fat mass but not muscle mass reduction, without brain effects; we propose Gc as a candidate target.

Methods

Sex as a biological variable. We utilized both male and female mice in our study, and found a robust metabolic phenotype in male but not female mice. This observation is consistent with the understanding in the metabolic field that female mice are more resistant to HFD challenges compared with male mice (72–74).

Animal care and use. We generated GcKO using frozen sperm from the UC Davis Knockout Mouse Project Repository [Gctm1.1(KOMP)Vlcg] (11). Mice were weaned at 3 weeks of age, housed at 22°C–24°C, fed normal chow diet (NCD) or HFD, and maintained on a 12-hour light-dark cycle (lights on at 7 AM). Based on caloric content, NCD consists of 13% fat, 62% carbohydrates, and 25% protein (PicoLab rodent diet 20, 5053; Purina Mills), while HFD contains 60% fat, 24% carbohydrates, and 16% protein (Research Diets, D12492). Littermate control mice for GcKO retained 2 WT Gc alleles. These mice were maintained on a mixed C57BL/6N-129J genetic background, with the majority being C57BL/6N.

Metabolic analyses and indirect calorimetry. We performed i.p. glucose tolerance tests (ipGTT) by injecting glucose (2 g/kg for NCD-fed mice, or 1g/kg for HFD fed mice) after an overnight fast. Insulin tolerance tests were performed by injecting insulin (0.75 units/kg) after a 4-hour fast, and i.p. pyruvate tolerance tests by injecting sodium pyruvate (2g/kg) after an overnight fast (75). We measured insulin levels with an ELISA kit (Mercodia) and glucagon levels with a radioimmunoassay kit (MilliporeSigma). We estimated body composition by nuclear magnetic resonance (Bruker Optics). We measured food intake, energy expenditure, and RER with a Comprehensive Laboratory Animal Monitoring System (CLAMS, Oxymax) (Columbus Instruments). We adapted the CalR calculation model for indirect calorimetry experiments (76). Plasma TG, total cholesterol, and NEFA were measured with commercially available kits following manufacturers’ instructions: Infinity TG kit (Thermo Fisher Scientific), total cholesterol E kit (Wako Diagnostics), and NEFA kit (Wako Diagnostics).

RNA preparation, qPCR, and RNA-Seq. We isolated total RNA from whole liver with Nucleospin RNA kit (Macherey-Nagel) with DNase I treatment and followed a previously described protocol for reverse transcription (77). We used the resulting cDNA to perform quantitative PCR with GoTaq master mix (Promega) and analyzed data with the standard ΔΔCt method. Rpl19 was used for internal normalization. Primer sequences are listed in Supplemental Table 2.

Directional Poly-A RNA-Seq libraries were prepared and sequenced as PE100 (100bp paired-end reads) on Illumina NextSeq 500 to a read depth of 40 million read-pairs per sample. The reads were mapped to the mouse genome mm10 using the STAR (v2.5.2b) (78) algorithm with default settings. FeatureCounts from the Subread (v1.5.2) (79) package was used to assign concordantly aligned reads pairs to RefSeq genes. A 25 bp minimum as overlapping bases in a fragment was specified for read assignment. Raw read counts were used as input for DESeq2 (v1.14.1) (80), which was further used to filter out genes with low counts, normalize the counts using library sizes, and perform statistical tests to find differentially expressed genes. For statistical analysis, a standard cutoff of P < 0.05 and FDR < 0.1 was applied. Differential expression analysis was conducted for fasted WT versus fasted GcKO, and refed WT versus refed GcKO. Gene ontology and pathway analyses were performed using Ingenuity Pathway Analysis software (Qiagen). Raw and processed data were deposited into the MINSEQE-compliant National Center for Biotechnology Information Gene Expression Omnibus database (GSE288309).

Western blotting and imaging. We used a previously described protocol for immunoblotting (81). A 30mg liver sample was placed in 600 µL RIPA lysis buffer (Millipore, 20-188), and supplemented with Halt protease and phosphatase inhibitor cocktail (Thermo Scientific, 78440). The sample was homogenized for 30 seconds, on setting 6 of an IKA T10 Basic Ultra-Turrax homogenizer system. Then, samples were spun down using a benchtop centrifuge at 4°C with 20,817g for 10 minutes, and supernatant was transferred to a new tube avoiding the lipid layer and precipitant. The supernatant was sonicated for a total of 5 minutes (10 seconds on and 10 seconds off for 10 minutes) on setting 9 of a model 550 Sonic Dismembrator (Fisher Scientific). The supernatant was spun again and transferred to a new tube avoiding precipitant, followed by protein concentration measurement (Pierce BCA protein assay kit).

The following primary antibodies were used: anti-Gc (HPA019855, Atlas Antibodies, 1:1000 dilution); anti-total Akt (Cell Signaling, no. 9272, 1:1000 dilution); anti-phosphorylated Akt at serine 473 (Cell Signaling, no. 4060, 1:500 dilution); and anti-β actin (Abcam, ab8227, 1:1000 dilution). IRDye 800CW (LI-COR, no. 925-32211) or IRDye 680LT (LI-COR, no. 925-68021) goat anti-rabbit secondary antibody was used. Proteins were detected using an Odyssey imaging system (LI-COR). Furthermore, to validate RNA-Seq results, the following primary antibodies were used: anti-Klf15 (Proteintech no. 13749-1-AP, 1:1000 dilution); anti-Cyp2e1 (Proteintech no. 19937-1-AP, 1:1000 dilution); and anti-GAPDH (Abcam ab9485, 1:1000 dilution). Secondary antibody against rabbit IgG conjugated with peroxidase produced in goat (Sigma A0545, 1:10,000 dilution) was applied for 1 hour, followed by ECL prime western blotting detection reagents (Cytiva Amersham). Bio-Rad ChemiDoc imaging system was used to capture the results. Quantifications were measured using ImageJ.

Hyperinsulinemic-euglycemic clamps. We performed hyperinsulinemic-euglycemic clamps as previously described (32). Briefly, during the 120-minute clamp period, insulin was infused at a constant rate of 2.5 mU/kg/min to raise circulating insulin levels about 3-fold over basal levels. Concurrently, glucose was infused i.v. at variable rates to maintain euglycemia, and this rate of glucose infusion directly correlates with insulin sensitivity. Plasma glucose concentrations were measured every 10–20 minutes from the cut tail vein to adjust the rates of glucose infusion needed to maintain a constant glycemia. Furthermore, radioactively labeled [3-3H] glucose (18 µCi per mouse) and 2-deoxy-D-[1-14C] glucose (a bolus of 10 µCi per mouse) were used to measure HGP and glucose metabolism in skeletal muscle and adipose tissues, respectively.

Prior to the 120-minute clamp period, [3-3H] glucose (0.05 µCi/min) was infused for 120 minutes to examine the basal rate of whole-body glucose turnover. Plasma samples were taken at the end of this infusion period to measure basal levels of insulin, plasma glucose, [3H] glucose, specific activity, and rates of glucose turnover. During this basal state, HGP is the only source of glucose introduction into the circulatory system, and therefore represents a steady state for peripheral glucose disposal. As a result, the basal rate of whole-body glucose turnover equilibrates with the basal rate of HGP.

During the 120-minute clamp period, [3-3H] glucose (0.1 µCi/min) was continuously infused to measure insulin-stimulated whole-body glucose turnover rate. Plasma [3H] glucose concentrations recorded during the final 30 minutes of the clamp were used to calculate the specific activity and glucose turnover rates. Furthermore, a one-time, nonmetabolizable 2-deoxy-D-[1-14C] glucose infusion at 75 minutes into the clamp period was used to measure glucose uptake in the gastrocnemius muscle and EWAT.

Whole-body glycolysis was obtained from the rate of elevated plasma 3H2O as a byproduct of glycolysis, which was calculated using linear regression based on measurements from 5-minute intervals between 80 and 120 minutes. Whole body glycogen synthesis was estimated by subtracting whole-body glycolysis from whole-body glucose turnover. At the end of the clamp period, mice were anesthetized using sodium pentobarbital, and tissues were harvested for biochemical analysis.

Adeno-associated virus injection. Because of liver tropism associated with AAV8, AAV8-H1-shRNA was chosen as a vector to mediate the knockdown of hepatic Gc (82). We generated AAV8-H1 shRNA against Gc (sh-Gc) to silence liver Gc, as well as a scrambled shRNA control (sh-scr). Three-month-old WT mice were fed a HFD for 12 weeks prior to viral injection. Viral injection was performed through the tail vein at a dose of 1.5 × 10¹¹ genome copies per mouse. Glucose tolerance tests were performed prior to and 3 weeks after viral injection.

Statistics. Data were analyzed with Prism 8 (GraphPad) and R 4.5.0 using the ggplot2 4.0.0 (83) and gplots 3.2.0 (84) packages. Results are shown as mean ± SEM. P values 0.05 were considered statistically significant. Statistical analyses were carried out using 2-tailed Student’s t test when 2 groups were compared, and using ANOVA specified in each figure legend, followed by Turkey’s multiple-comparison test when more than 2 groups are compared.

Data availability. Raw and processed RNA-Seq data were deposited into the MINSEQE-compliant National Center for Biotechnology Information Gene Expression Omnibus database (GSE288309). Underlying data are available in the Supporting Data Values file. Datasets generated and/or analyzed during the current study are also available from the corresponding author upon reasonable request.

Study approval. UC Davis and Columbia University IACUC approved all animal procedures.

Author contributions

RG designed the studies, performed experiments, analyzed the data, and wrote the manuscript. TK designed the studies, performed experiments, analyzed the data, and wrote the manuscript.

Funding support

This work is the result of NIH funding, in whole or in part, and is subject to the NIH Public Access Policy. Through acceptance of this federal funding, the NIH has been given a right to make the work publicly available in PubMed Central.

  • UC Davis start-up fund (to TK)
  • NIDDK pilot and feasibility grants P30DK98722, P30DK63608, and P30DK116074 (to TK)
  • NIH grants K01DK114372 (to TK)
Supplemental material

View Supplemental data

View Supplemental data sets 1-4

View Unedited blot and gel images

View Supporting data values

Acknowledgments

We thank members of the Kuo laboratory (UC Davis) and Accili laboratory (Columbia University) for discussions, as well as Dennis To, Peiting Chen (UC Davis), Thomas Kolar, and Ana Flete-Castro (Columbia University) for technical support. We thank Jason K. Kim, Randall Friedline, and Lauren Tauer (National MMPC at UMass) for clamp studies. TK is the guarantor of this work and, as such, had full access to all the data in the study and takes responsibility for the integrity of the data and the accuracy of the data analysis.

Address correspondence to: Taiyi Kuo, Department of Neurobiology, Physiology, and Behavior, University of California Davis, 605 Hutchinson Drive, 1009 Green Hall, Davis, California, 95616, USA. Email: tdkuo@ucdavis.edu.

Footnotes

Conflict of interest: The authors have declared that no conflict of interest exists.

Copyright: © 2025, Gill et al. This is an open access article published under the terms of the Creative Commons Attribution 4.0 International License.

Reference information: JCI Insight. 2025;10(23):e195341.https://doi.org/10.1172/jci.insight.195341.

References
  1. Accili D. Insulin action research and the future of diabetes treatment: the 2017 Banting Medal for scientific achievement lecture. Diabetes. 2018;67(9):1701–1709.
    View this article via: CrossRef PubMed Google Scholar
  2. Weyer C, et al. The natural history of insulin secretory dysfunction and insulin resistance in the pathogenesis of type 2 diabetes mellitus. J Clin Invest. 1999;104(6):787–794.
    View this article via: JCI CrossRef PubMed Google Scholar
  3. Lillioja S, et al. Insulin resistance and insulin secretory dysfunction as precursors of non-insulin-dependent diabetes mellitus. Prospective studies of Pima Indians. N Engl J Med. 1993;329(27):1988–1992.
    View this article via: CrossRef PubMed Google Scholar
  4. Brunzell JD, et al. Relationships between fasting plasma glucose levels and insulin secretion during intravenous glucose tolerance tests. J Clin Endocrinol Metab. 1976;42(2):222–229.
    View this article via: CrossRef PubMed Google Scholar
  5. Ferrannini E. The stunned beta cell: a brief history. Cell Metab. 2010;11(5):349–352.
    View this article via: CrossRef PubMed Google Scholar
  6. American Diabetes Association. 6. Glycemic targets: standards of medical care in diabetes-2020. Diabetes Care. 2020;43(suppl 1):S66–S76.
    View this article via: CrossRef PubMed Google Scholar
  7. Safadi FF, et al. Osteopathy and resistance to vitamin D toxicity in mice null for vitamin D binding protein. J Clin Invest. 1999;103(2):239–251.
    View this article via: JCI CrossRef PubMed Google Scholar
  8. Thomas WC Jr. Studies of antiricketic activity in sera from patients with disorders of calcium metabolism and preliminary observations on the mode of transport of vitamin D in human serum. J Clin Invest. 1959;38(7):1078–1085.
    View this article via: JCI CrossRef PubMed Google Scholar
  9. Bouillon R, et al. Vitamin D binding protein: a historic overview. Front Endocrinol (Lausanne). 2020;10:910.
    View this article via: CrossRef PubMed Google Scholar
  10. Wang YJ, et al. Single-cell transcriptomics of the human endocrine pancreas. Diabetes. 2016;65(10):3028–3038.
    View this article via: CrossRef PubMed Google Scholar
  11. Kuo T, et al. Induction of α cell-restricted Gc in dedifferentiating β cells contributes to stress-induced β-cell dysfunction. JCI Insight. 2019;5(13):e128351.
    View this article via: JCI Insight CrossRef PubMed Google Scholar
  12. Swisa A, et al. PAX6 maintains β cell identity by repressing genes of alternative islet cell types. J Clin Invest. 2017;127(1):230–243.
    View this article via: JCI CrossRef PubMed Google Scholar
  13. Ediger BN, et al. Islet-1 Is essential for pancreatic β-cell function. Diabetes. 2014;63(12):4206–4217.
    View this article via: CrossRef PubMed Google Scholar
  14. Baier LJ, et al. Variations in the vitamin D-binding protein (Gc locus) are associated with oral glucose tolerance in nondiabetic Pima Indians. J Clin Endocrinol Metab. 1998;83(8):2993–2996.
    View this article via: CrossRef PubMed Google Scholar
  15. Fawzy MS, et al. Group-specific component exon 11 haplotypes (D432E and T436K) and risk of albuminuria in type 2 diabetes mellitus patients. Arch Physiol Biochem. 2022;128(1):111–120.
    View this article via: CrossRef PubMed Google Scholar
  16. Hirai M, et al. Variations in vitamin D-binding protein (group-specific component protein) are associated with fasting plasma insulin levels in Japanese with normal glucose tolerance. J Clin Endocrinol Metab. 2000;85(5):1951–1953.
    View this article via: CrossRef PubMed Google Scholar
  17. Szathmary EJ. The effect of Gc genotype on fasting insulin level in Dogrib Indians. Hum Genet. 1987;75(4):368–372.
    View this article via: CrossRef PubMed Google Scholar
  18. Wang G, et al. Association of the vitamin D binding protein polymorphisms with the risk of type 2 diabetes mellitus: a meta-analysis. BMJ Open. 2014;4(11):e005617.
    View this article via: CrossRef PubMed Google Scholar
  19. Zhao Y, et al. Evaluation of the associations of GC and CYP2R1 genes and gene-obesity interactions with type 2 diabetes risk in a Chinese rural population. Ann Nutr Metab. 2020;76(3):175–182.
    View this article via: CrossRef PubMed Google Scholar
  20. Filus A, et al. Relationship between vitamin D receptor BsmI and FokI polymorphisms and anthropometric and biochemical parameters describing metabolic syndrome. Aging Male. 2008;11(3):134–139.
    View this article via: CrossRef PubMed Google Scholar
  21. Almesri N, et al. Independent associations of polymorphisms in vitamin D binding protein (GC) and vitamin D receptor (VDR) genes with obesity and plasma 25OHD3 levels demonstrate sex dimorphism. Appl Physiol Nutr Metab. 2016;41(4):345–353.
    View this article via: CrossRef PubMed Google Scholar
  22. Jiang H, et al. Association analysis of vitamin D-binding protein gene polymorphisms with variations of obesity-related traits in Caucasian nuclear families. Int J Obes (Lond). 2007;31(8):1319–1324.
    View this article via: CrossRef PubMed Google Scholar
  23. Al-Daghri NM, et al. Vitamin D receptor gene polymorphisms are associated with obesity and inflammosome activity. PLoS One. 2014;9(7):e102141.
    View this article via: CrossRef PubMed Google Scholar
  24. Al-Hazmi AS, et al. Vitamin D receptor gene polymorphisms as a risk factor for obesity in Saudi men. Electron Physician. 2017;9(10):5427–5433.
    View this article via: CrossRef PubMed Google Scholar
  25. Bienertova-Vasku J, et al. Allelic variants in vitamin D receptor gene are associated with adiposity measures in the central-European population. BMC Med Genet. 2017;18(1):90.
    View this article via: CrossRef PubMed Google Scholar
  26. Foucan L, et al. Polymorphisms in GC and NADSYN1 Genes are associated with vitamin D status and metabolic profile in Non-diabetic adults. BMC Endocr Disord. 2013;13:36.
    View this article via: CrossRef PubMed Google Scholar
  27. Zhao T, et al. The association between GC gene polymorphisms and metabolic syndrome in Chinese rural population: a case-control study. Diabetes Metab Syndr Obes. 2022;15:165–174.
    View this article via: CrossRef PubMed Google Scholar
  28. Henderson CM, et al. Vitamin D-binding protein deficiency and homozygous deletion of the GC gene. N Engl J Med. 2019;380(12):1150–1157.
    View this article via: CrossRef PubMed Google Scholar
  29. Banerjee RR, et al. Very low vitamin D in a patient with a novel pathogenic variant in the GC gene that encodes vitamin D-binding protein. J Endocr Soc. 2021;5(9):bvab104.
    View this article via: CrossRef PubMed Google Scholar
  30. Ricquier D, Bouillaud F. The uncoupling protein homologues: UCP1, UCP2, UCP3, StUCP and AtUCP. Biochem J. 2000;345 Pt 2(pt 2):161–179.
    View this article via: CrossRef PubMed Google Scholar
  31. Nesci S, Rubattu S. UCP2, a member of the mitochondrial uncoupling proteins: an overview from physiological to pathological roles. Biomedicines. 2024;12(6):1307.
    View this article via: CrossRef PubMed Google Scholar
  32. Kim JK. Hyperinsulinemic-euglycemic clamp to assess insulin sensitivity in vivo. Methods Mol Biol. 2009;560:221–238.
    View this article via: CrossRef PubMed Google Scholar
  33. DeFronzo RA, Tripathy D. Skeletal muscle insulin resistance is the primary defect in type 2 diabetes. Diabetes Care. 2009;32 Suppl 2(suppl 2):S157–S163.
    View this article via: CrossRef PubMed Google Scholar
  34. Kim JK, et al. Redistribution of substrates to adipose tissue promotes obesity in mice with selective insulin resistance in muscle. J Clin Invest. 2000;105(12):1791–1797.
    View this article via: JCI CrossRef PubMed Google Scholar
  35. Santoro A, et al. Insulin action in adipocytes, adipose remodeling, and systemic effects. Cell Metab. 2021;33(4):748–757.
    View this article via: CrossRef PubMed Google Scholar
  36. Guilliams M, et al. Spatial proteogenomics reveals distinct and evolutionarily conserved hepatic macrophage niches. Cell. 2022;185(2):379–396.
    View this article via: CrossRef PubMed Google Scholar
  37. Roden M, et al. Effects of free fatty acid elevation on postabsorptive endogenous glucose production and gluconeogenesis in humans. Diabetes. 2000;49(5):701–707.
    View this article via: CrossRef PubMed Google Scholar
  38. Shi H, et al. TLR4 links innate immunity and fatty acid-induced insulin resistance. J Clin Invest. 2006;116(11):3015–3025.
    View this article via: JCI CrossRef PubMed Google Scholar
  39. Chait A, Goldberg I. Treatment of dyslipidemia in diabetes: recent advances and remaining questions. Curr Diab Rep. 2017;17(11):112.
    View this article via: CrossRef PubMed Google Scholar
  40. Kaur A, et al. Loss of Cyp8b1 improves glucose homeostasis by increasing GLP-1. Diabetes. 2015;64(4):1168–1179.
    View this article via: CrossRef PubMed Google Scholar
  41. Baudrand R, et al. Overexpression of 11beta-hydroxysteroid dehydrogenase type 1 in hepatic and visceral adipose tissue is associated with metabolic disorders in morbidly obese patients. Obes Surg. 2010;20(1):77–83.
    View this article via: CrossRef PubMed Google Scholar
  42. Jamwal R, Barlock BJ. Nonalcoholic fatty liver disease (NAFLD) and hepatic cytochrome P450 (CYP) enzymes. Pharmaceuticals (Basel). 2020;13(9):222.
    View this article via: CrossRef PubMed Google Scholar
  43. Takashima M, et al. Role of KLF15 in regulation of hepatic gluconeogenesis and metformin action. Diabetes. 2010;59(7):1608–1615.
    View this article via: CrossRef PubMed Google Scholar
  44. Dong W, et al. Ceramide kinase-mediated C1P metabolism attenuates acute liver injury by inhibiting the interaction between KEAP1 and NRF2. Exp Mol Med. 2024;56(4):946–958.
    View this article via: CrossRef PubMed Google Scholar
  45. Shimizu K, et al. Liver-specific overexpression of lipoprotein lipase improves glucose metabolism in high-fat diet-fed mice. PLoS One. 2022;17(9):e0274297.
    View this article via: CrossRef PubMed Google Scholar
  46. Weltman MD, et al. Hepatic cytochrome P450 2E1 is increased in patients with nonalcoholic steatohepatitis. Hepatology. 1998;27(1):128–133.
    View this article via: CrossRef PubMed Google Scholar
  47. Videla LA, et al. Insulin resistance and oxidative stress interdependency in non-alcoholic fatty liver disease. Trends Mol Med. 2006;12(12):555–558.
    View this article via: CrossRef PubMed Google Scholar
  48. Bouillon R, et al. The purification and characterisation of the human-serum binding protein for the 25-hydroxycholecalciferol (transcalciferin). Identity with group-specific component. Eur J Biochem. 1976;66(2):285–291.
    View this article via: CrossRef PubMed Google Scholar
  49. Chun RF, et al. Vitamin D and DBP: the free hormone hypothesis revisited. J Steroid Biochem Mol Biol. 2014;144 Pt A:132–137.
    View this article via: CrossRef PubMed Google Scholar
  50. Nykjaer A, et al. An endocytic pathway essential for renal uptake and activation of the steroid 25-(OH) vitamin D3. Cell. 1999;96(4):507–515.
    View this article via: CrossRef PubMed Google Scholar
  51. Christensen EI, Birn H. Megalin and cubilin: multifunctional endocytic receptors. Nat Rev Mol Cell Biol. 2002;3(4):256–266.
    View this article via: CrossRef PubMed Google Scholar
  52. Williams MH, et al. Evidence of a novel association of unsaturated fatty acids with Gc (vitamin D-binding protein). Biochem Biophys Res Commun. 1988;153(3):1019–1024.
    View this article via: CrossRef PubMed Google Scholar
  53. Wexler DJ. D2d - No defense against diabetes. N Engl J Med. 2019;381(6):581–582.
    View this article via: CrossRef PubMed Google Scholar
  54. Pittas AG, et al. Vitamin D supplementation and prevention of type 2 diabetes. N Engl J Med. 2019;381(6):520–530.
    View this article via: CrossRef PubMed Google Scholar
  55. Jorde R, et al. Vitamin D 20,000 IU per week for five years does not prevent progression from prediabetes to diabetes. J Clin Endocrinol Metab. 2016;101(4):1647–1655.
    View this article via: CrossRef PubMed Google Scholar
  56. Kawahara T, et al. Effect of active vitamin D treatment on development of type 2 diabetes: DPVD randomised controlled trial in Japanese population. BMJ. 2022;377:e066222.
    View this article via: CrossRef PubMed Google Scholar
  57. Deng YT, et al. Atlas of the plasma proteome in health and disease in 53,026 adults. Cell. 2025;188(1):253–271.
    View this article via: CrossRef PubMed Google Scholar
  58. Okada-Iwabu M, et al. A small-molecule AdipoR agonist for type 2 diabetes and short life in obesity. Nature. 2013;503(7477):493–499.
    View this article via: CrossRef PubMed Google Scholar
  59. Schwartz DR, Lazar MA. Human resistin: found in translation from mouse to man. Trends Endocrinol Metab. 2011;22(7):259–265.
    View this article via: PubMed CrossRef Google Scholar
  60. Zemany L, et al. Transthyretin Antisense oligonucleotides lower circulating RBP4 levels and improve insulin sensitivity in obese mice. Diabetes. 2015;64(5):1603–1614.
    View this article via: CrossRef PubMed Google Scholar
  61. Zhao L, et al. Recombinant adeno-associated virus 8 vector in gene therapy: Opportunities and challenges. Genes Dis. 2024;11(1):283–293.
    View this article via: CrossRef PubMed Google Scholar
  62. Kim-Muller JY, Accili D. Cell biology. Selective insulin sensitizers. Science. 2011;331(6024):1529–1531.
    View this article via: CrossRef PubMed Google Scholar
  63. Rosen CJ. Revisiting the rosiglitazone story--lessons learned. N Engl J Med. 2010;363(9):803–806.
    View this article via: CrossRef PubMed Google Scholar
  64. Buchanan TA, et al. Response of pancreatic beta-cells to improved insulin sensitivity in women at high risk for type 2 diabetes. Diabetes. 2000;49(5):782–788.
    View this article via: CrossRef PubMed Google Scholar
  65. Defronzo RA, et al. Prevention of diabetes with pioglitazone in ACT NOW: physiologic correlates. Diabetes. 2013;62(11):3920–3926.
    View this article via: CrossRef PubMed Google Scholar
  66. Kernan WN, et al. Pioglitazone after ischemic stroke or transient ischemic attack. N Engl J Med. 2016;374(14):1321–1331.
    View this article via: CrossRef PubMed Google Scholar
  67. Kahn SE, et al. Glycemic durability of rosiglitazone, metformin, or glyburide monotherapy. N Engl J Med. 2006;355(23):2427–2443.
    View this article via: CrossRef PubMed Google Scholar
  68. Home PD, et al. Three-year data from 5 HARMONY phase 3 clinical trials of albiglutide in type 2 diabetes mellitus: Long-term efficacy with or without rescue therapy. Diabetes Res Clin Pract. 2017;131:49–60.
    View this article via: CrossRef PubMed Google Scholar
  69. Kajimura S, et al. Brown and beige fat: physiological roles beyond heat generation. Cell Metab. 2015;22(4):546–559.
    View this article via: CrossRef PubMed Google Scholar
  70. Ikeda K, Yamada T. UCP1 dependent and independent thermogenesis in brown and beige adipocytes. Front Endocrinol (Lausanne). 2020;11:498.
    View this article via: CrossRef PubMed Google Scholar
  71. Roesler A, Kazak L. UCP1-independent thermogenesis. Biochem J. 2020;477(3):709–725.
    View this article via: CrossRef PubMed Google Scholar
  72. de Souza GO, et al. Characterization of the metabolic differences between male and female C57BL/6 mice. Life Sci. 2022;301:120636.
    View this article via: CrossRef PubMed Google Scholar
  73. Pettersson US, et al. Female mice are protected against high-fat diet induced metabolic syndrome and increase the regulatory T cell population in adipose tissue. PLoS One. 2012;7(9):e46057.
    View this article via: CrossRef PubMed Google Scholar
  74. Stapleton S, et al. Sex differences in a mouse model of diet-induced obesity: the role of the gut microbiome. Biol Sex Differ. 2024;15(1):5.
    View this article via: CrossRef PubMed Google Scholar
  75. Kuo T, et al. Altered plasma profile of antioxidant proteins as an early correlate of pancreatic β cell dysfunction. J Biol Chem. 2016;291(18):9648–9656.
    View this article via: CrossRef PubMed Google Scholar
  76. Mina AI, et al. CalR: A web-based analysis tool for indirect calorimetry experiments. Cell Metab. 2018;28(4):656–666.
    View this article via: CrossRef PubMed Google Scholar
  77. Kuo T, et al. Repression of glucocorticoid-stimulated angiopoietin-like 4 gene transcription by insulin. J Lipid Res. 2014;55(5):919–928.
    View this article via: CrossRef PubMed Google Scholar
  78. Dobin A, et al. STAR: ultrafast universal RNA-Seq aligner. Bioinformatics. 2013;29(1):15–21.
    View this article via: CrossRef PubMed Google Scholar
  79. Liao Y, et al. featureCounts: an efficient general purpose program for assigning sequence reads to genomic features. Bioinformatics. 2014;30(7):923–930.
    View this article via: CrossRef PubMed Google Scholar
  80. Love MI, et al. Moderated estimation of fold change and dispersion for RNA-Seq data with DESeq2. Genome Biol. 2014;15(12):550.
    View this article via: CrossRef PubMed Google Scholar
  81. Kuo T, et al. Identification of C2CD4A as a human diabetes susceptibility gene with a role in β cell insulin secretion. Proc Natl Acad Sci U S A. 2019;116(40):20033–20042.
    View this article via: CrossRef PubMed Google Scholar
  82. Zhu C, et al. Hepatocyte Notch activation induces liver fibrosis in nonalcoholic steatohepatitis. Sci Transl Med. 2018;10(468):eaat0344.
    View this article via: CrossRef PubMed Google Scholar
  83. Wickham H. ggplot2: Elegant Graphics for Data Analysis. Springer; 2016.
  84. Western D, et al. Proteogenomic analysis of human cerebrospinal fluid identifies neurologically relevant regulation and implicates causal proteins for Alzheimer’s disease. Nat Genet. 2024;56(12):2672–2684.
    View this article via: CrossRef PubMed Google Scholar
Version history
  • Version 1 (December 8, 2025): Electronic publication

Article tools

  • View PDF
  • Download citation information
  • Send a comment
  • Terms of use
  • Standard abbreviations
  • Need help? Email the journal

Metrics

  • Article usage
  • Citations to this article

Go to

  • Top
  • Abstract
  • Introduction
  • Results
  • Discussion
  • Methods
  • Author contributions
  • Funding support
  • Supplemental material
  • Acknowledgments
  • Footnotes
  • References
  • Version history
Advertisement
Advertisement

Copyright © 2026 American Society for Clinical Investigation
ISSN 2379-3708

Sign up for email alerts