
Research ArticleInflammationMetabolism
Open Access |  10.1172/jci.insight.200076
Glutamine-dependent biosynthetic pathways fuel autoreactive T and B cells in Foxp3 deficiency–mediated disease
Mohammad Adeel Zafar,1,2 Charlotte N. Hill Machado,1,2 Jyotirmaya Behera,1,2 Yuelin Zhong,1 Xiao Li,1 Shakchhi Joshi,3 Yassine El Fazaa,1 Virginia Camacho,2,4 Peter Georgiev,3,5 Kiran Kurmi,3,6 Marcia Haigis,3,7 and Louis-Marie Charbonnier1,2
1Division of Immunology, Boston Children’s Hospital, Boston, Massachusetts, USA.
2Department of Pediatrics and
3Department of Cell Biology, Blavatnik Institute, Harvard Medical School, Boston, Massachusetts, USA.
4Division of Surgery, Boston Children’s Hospital, Boston, Massachusetts, USA.
5Department of Immunology, Blavatnik Institute, Harvard Medical School, Boston, Massachusetts, USA.
6Department of Molecular & Cellular Pharmacology, University of Miami Miller School of Medicine, Sylvester Comprehensive Cancer Center, Miami, Florida, USA.
7Gene Lay Institute of Immunology and Inflammation of Brigham and Women’s Hospital, Massachusetts General Hospital and Harvard Medical School, Boston, Massachusetts, USA.
Address correspondence to: Louis-Marie Charbonnier, Division of Immunology, Boston Children’s Hospital, KARP Building (10th floor), 1 Blackfan Circle, Boston, Massachusetts, 02115, USA. Phone: 617.919.1058; Email: Louis-Marie.Charbonnier@childrens.harvard.edu.
Authorship note: MAZ and CNHM contributed equally to this work.
Find articles by Zafar, M. in: PubMed | Google Scholar
1Division of Immunology, Boston Children’s Hospital, Boston, Massachusetts, USA.
2Department of Pediatrics and
3Department of Cell Biology, Blavatnik Institute, Harvard Medical School, Boston, Massachusetts, USA.
4Division of Surgery, Boston Children’s Hospital, Boston, Massachusetts, USA.
5Department of Immunology, Blavatnik Institute, Harvard Medical School, Boston, Massachusetts, USA.
6Department of Molecular & Cellular Pharmacology, University of Miami Miller School of Medicine, Sylvester Comprehensive Cancer Center, Miami, Florida, USA.
7Gene Lay Institute of Immunology and Inflammation of Brigham and Women’s Hospital, Massachusetts General Hospital and Harvard Medical School, Boston, Massachusetts, USA.
Address correspondence to: Louis-Marie Charbonnier, Division of Immunology, Boston Children’s Hospital, KARP Building (10th floor), 1 Blackfan Circle, Boston, Massachusetts, 02115, USA. Phone: 617.919.1058; Email: Louis-Marie.Charbonnier@childrens.harvard.edu.
Authorship note: MAZ and CNHM contributed equally to this work.
Find articles by Hill Machado, C. in: PubMed | Google Scholar
1Division of Immunology, Boston Children’s Hospital, Boston, Massachusetts, USA.
2Department of Pediatrics and
3Department of Cell Biology, Blavatnik Institute, Harvard Medical School, Boston, Massachusetts, USA.
4Division of Surgery, Boston Children’s Hospital, Boston, Massachusetts, USA.
5Department of Immunology, Blavatnik Institute, Harvard Medical School, Boston, Massachusetts, USA.
6Department of Molecular & Cellular Pharmacology, University of Miami Miller School of Medicine, Sylvester Comprehensive Cancer Center, Miami, Florida, USA.
7Gene Lay Institute of Immunology and Inflammation of Brigham and Women’s Hospital, Massachusetts General Hospital and Harvard Medical School, Boston, Massachusetts, USA.
Address correspondence to: Louis-Marie Charbonnier, Division of Immunology, Boston Children’s Hospital, KARP Building (10th floor), 1 Blackfan Circle, Boston, Massachusetts, 02115, USA. Phone: 617.919.1058; Email: Louis-Marie.Charbonnier@childrens.harvard.edu.
Authorship note: MAZ and CNHM contributed equally to this work.
Find articles by Behera, J. in: PubMed | Google Scholar
1Division of Immunology, Boston Children’s Hospital, Boston, Massachusetts, USA.
2Department of Pediatrics and
3Department of Cell Biology, Blavatnik Institute, Harvard Medical School, Boston, Massachusetts, USA.
4Division of Surgery, Boston Children’s Hospital, Boston, Massachusetts, USA.
5Department of Immunology, Blavatnik Institute, Harvard Medical School, Boston, Massachusetts, USA.
6Department of Molecular & Cellular Pharmacology, University of Miami Miller School of Medicine, Sylvester Comprehensive Cancer Center, Miami, Florida, USA.
7Gene Lay Institute of Immunology and Inflammation of Brigham and Women’s Hospital, Massachusetts General Hospital and Harvard Medical School, Boston, Massachusetts, USA.
Address correspondence to: Louis-Marie Charbonnier, Division of Immunology, Boston Children’s Hospital, KARP Building (10th floor), 1 Blackfan Circle, Boston, Massachusetts, 02115, USA. Phone: 617.919.1058; Email: Louis-Marie.Charbonnier@childrens.harvard.edu.
Authorship note: MAZ and CNHM contributed equally to this work.
Find articles by Zhong, Y. in: PubMed | Google Scholar
1Division of Immunology, Boston Children’s Hospital, Boston, Massachusetts, USA.
2Department of Pediatrics and
3Department of Cell Biology, Blavatnik Institute, Harvard Medical School, Boston, Massachusetts, USA.
4Division of Surgery, Boston Children’s Hospital, Boston, Massachusetts, USA.
5Department of Immunology, Blavatnik Institute, Harvard Medical School, Boston, Massachusetts, USA.
6Department of Molecular & Cellular Pharmacology, University of Miami Miller School of Medicine, Sylvester Comprehensive Cancer Center, Miami, Florida, USA.
7Gene Lay Institute of Immunology and Inflammation of Brigham and Women’s Hospital, Massachusetts General Hospital and Harvard Medical School, Boston, Massachusetts, USA.
Address correspondence to: Louis-Marie Charbonnier, Division of Immunology, Boston Children’s Hospital, KARP Building (10th floor), 1 Blackfan Circle, Boston, Massachusetts, 02115, USA. Phone: 617.919.1058; Email: Louis-Marie.Charbonnier@childrens.harvard.edu.
Authorship note: MAZ and CNHM contributed equally to this work.
Find articles by Li, X. in: PubMed | Google Scholar
1Division of Immunology, Boston Children’s Hospital, Boston, Massachusetts, USA.
2Department of Pediatrics and
3Department of Cell Biology, Blavatnik Institute, Harvard Medical School, Boston, Massachusetts, USA.
4Division of Surgery, Boston Children’s Hospital, Boston, Massachusetts, USA.
5Department of Immunology, Blavatnik Institute, Harvard Medical School, Boston, Massachusetts, USA.
6Department of Molecular & Cellular Pharmacology, University of Miami Miller School of Medicine, Sylvester Comprehensive Cancer Center, Miami, Florida, USA.
7Gene Lay Institute of Immunology and Inflammation of Brigham and Women’s Hospital, Massachusetts General Hospital and Harvard Medical School, Boston, Massachusetts, USA.
Address correspondence to: Louis-Marie Charbonnier, Division of Immunology, Boston Children’s Hospital, KARP Building (10th floor), 1 Blackfan Circle, Boston, Massachusetts, 02115, USA. Phone: 617.919.1058; Email: Louis-Marie.Charbonnier@childrens.harvard.edu.
Authorship note: MAZ and CNHM contributed equally to this work.
Find articles by Joshi, S. in: PubMed | Google Scholar
1Division of Immunology, Boston Children’s Hospital, Boston, Massachusetts, USA.
2Department of Pediatrics and
3Department of Cell Biology, Blavatnik Institute, Harvard Medical School, Boston, Massachusetts, USA.
4Division of Surgery, Boston Children’s Hospital, Boston, Massachusetts, USA.
5Department of Immunology, Blavatnik Institute, Harvard Medical School, Boston, Massachusetts, USA.
6Department of Molecular & Cellular Pharmacology, University of Miami Miller School of Medicine, Sylvester Comprehensive Cancer Center, Miami, Florida, USA.
7Gene Lay Institute of Immunology and Inflammation of Brigham and Women’s Hospital, Massachusetts General Hospital and Harvard Medical School, Boston, Massachusetts, USA.
Address correspondence to: Louis-Marie Charbonnier, Division of Immunology, Boston Children’s Hospital, KARP Building (10th floor), 1 Blackfan Circle, Boston, Massachusetts, 02115, USA. Phone: 617.919.1058; Email: Louis-Marie.Charbonnier@childrens.harvard.edu.
Authorship note: MAZ and CNHM contributed equally to this work.
Find articles by El Fazaa, Y. in: PubMed | Google Scholar
1Division of Immunology, Boston Children’s Hospital, Boston, Massachusetts, USA.
2Department of Pediatrics and
3Department of Cell Biology, Blavatnik Institute, Harvard Medical School, Boston, Massachusetts, USA.
4Division of Surgery, Boston Children’s Hospital, Boston, Massachusetts, USA.
5Department of Immunology, Blavatnik Institute, Harvard Medical School, Boston, Massachusetts, USA.
6Department of Molecular & Cellular Pharmacology, University of Miami Miller School of Medicine, Sylvester Comprehensive Cancer Center, Miami, Florida, USA.
7Gene Lay Institute of Immunology and Inflammation of Brigham and Women’s Hospital, Massachusetts General Hospital and Harvard Medical School, Boston, Massachusetts, USA.
Address correspondence to: Louis-Marie Charbonnier, Division of Immunology, Boston Children’s Hospital, KARP Building (10th floor), 1 Blackfan Circle, Boston, Massachusetts, 02115, USA. Phone: 617.919.1058; Email: Louis-Marie.Charbonnier@childrens.harvard.edu.
Authorship note: MAZ and CNHM contributed equally to this work.
Find articles by Camacho, V. in: PubMed | Google Scholar
1Division of Immunology, Boston Children’s Hospital, Boston, Massachusetts, USA.
2Department of Pediatrics and
3Department of Cell Biology, Blavatnik Institute, Harvard Medical School, Boston, Massachusetts, USA.
4Division of Surgery, Boston Children’s Hospital, Boston, Massachusetts, USA.
5Department of Immunology, Blavatnik Institute, Harvard Medical School, Boston, Massachusetts, USA.
6Department of Molecular & Cellular Pharmacology, University of Miami Miller School of Medicine, Sylvester Comprehensive Cancer Center, Miami, Florida, USA.
7Gene Lay Institute of Immunology and Inflammation of Brigham and Women’s Hospital, Massachusetts General Hospital and Harvard Medical School, Boston, Massachusetts, USA.
Address correspondence to: Louis-Marie Charbonnier, Division of Immunology, Boston Children’s Hospital, KARP Building (10th floor), 1 Blackfan Circle, Boston, Massachusetts, 02115, USA. Phone: 617.919.1058; Email: Louis-Marie.Charbonnier@childrens.harvard.edu.
Authorship note: MAZ and CNHM contributed equally to this work.
Find articles by Georgiev, P. in: PubMed | Google Scholar
1Division of Immunology, Boston Children’s Hospital, Boston, Massachusetts, USA.
2Department of Pediatrics and
3Department of Cell Biology, Blavatnik Institute, Harvard Medical School, Boston, Massachusetts, USA.
4Division of Surgery, Boston Children’s Hospital, Boston, Massachusetts, USA.
5Department of Immunology, Blavatnik Institute, Harvard Medical School, Boston, Massachusetts, USA.
6Department of Molecular & Cellular Pharmacology, University of Miami Miller School of Medicine, Sylvester Comprehensive Cancer Center, Miami, Florida, USA.
7Gene Lay Institute of Immunology and Inflammation of Brigham and Women’s Hospital, Massachusetts General Hospital and Harvard Medical School, Boston, Massachusetts, USA.
Address correspondence to: Louis-Marie Charbonnier, Division of Immunology, Boston Children’s Hospital, KARP Building (10th floor), 1 Blackfan Circle, Boston, Massachusetts, 02115, USA. Phone: 617.919.1058; Email: Louis-Marie.Charbonnier@childrens.harvard.edu.
Authorship note: MAZ and CNHM contributed equally to this work.
Find articles by Kurmi, K. in: PubMed | Google Scholar
1Division of Immunology, Boston Children’s Hospital, Boston, Massachusetts, USA.
2Department of Pediatrics and
3Department of Cell Biology, Blavatnik Institute, Harvard Medical School, Boston, Massachusetts, USA.
4Division of Surgery, Boston Children’s Hospital, Boston, Massachusetts, USA.
5Department of Immunology, Blavatnik Institute, Harvard Medical School, Boston, Massachusetts, USA.
6Department of Molecular & Cellular Pharmacology, University of Miami Miller School of Medicine, Sylvester Comprehensive Cancer Center, Miami, Florida, USA.
7Gene Lay Institute of Immunology and Inflammation of Brigham and Women’s Hospital, Massachusetts General Hospital and Harvard Medical School, Boston, Massachusetts, USA.
Address correspondence to: Louis-Marie Charbonnier, Division of Immunology, Boston Children’s Hospital, KARP Building (10th floor), 1 Blackfan Circle, Boston, Massachusetts, 02115, USA. Phone: 617.919.1058; Email: Louis-Marie.Charbonnier@childrens.harvard.edu.
Authorship note: MAZ and CNHM contributed equally to this work.
Find articles by Haigis, M. in: PubMed | Google Scholar
1Division of Immunology, Boston Children’s Hospital, Boston, Massachusetts, USA.
2Department of Pediatrics and
3Department of Cell Biology, Blavatnik Institute, Harvard Medical School, Boston, Massachusetts, USA.
4Division of Surgery, Boston Children’s Hospital, Boston, Massachusetts, USA.
5Department of Immunology, Blavatnik Institute, Harvard Medical School, Boston, Massachusetts, USA.
6Department of Molecular & Cellular Pharmacology, University of Miami Miller School of Medicine, Sylvester Comprehensive Cancer Center, Miami, Florida, USA.
7Gene Lay Institute of Immunology and Inflammation of Brigham and Women’s Hospital, Massachusetts General Hospital and Harvard Medical School, Boston, Massachusetts, USA.
Address correspondence to: Louis-Marie Charbonnier, Division of Immunology, Boston Children’s Hospital, KARP Building (10th floor), 1 Blackfan Circle, Boston, Massachusetts, 02115, USA. Phone: 617.919.1058; Email: Louis-Marie.Charbonnier@childrens.harvard.edu.
Authorship note: MAZ and CNHM contributed equally to this work.
Find articles by
Charbonnier, L.
in:
PubMed
|
Google Scholar
|

Published September 8, 2026 - More info
JCI Insight. 2026;11(17):e200076. https://doi.org/10.1172/jci.insight.200076.
© 2026 Zafar et al. This work is licensed under the Creative Commons Attribution 4.0 International License. To view a copy of this license, visit http://creativecommons.org/licenses/by/4.0/.
Received: October 1, 2025; Accepted: May 22, 2026


-
Results
Glutamine-dependent biosynthetic pathways contribute to Foxp3 deficiency–mediated disease. To assess whether global glutamine utilization or only glutamine-dependent bioenergetic pathways were required to sustain autoimmunity, we initially compared the therapeutic effect of a broad glutamine antagonist 6-diazo-5-oxo-L-norleucine (DON) and of a GLS1-specific inhibitor (CB-839) in the context of Foxp3 deficiency (Foxp3ΔEGFPiCreR26YFP mice). Whereas DON broadly inhibits multiple glutamine-utilizing reactions essential for cellular processes, including synthesis of nucleic acids and proteins and generation of αKG for energy metabolism, CB-839 is a selective inhibitor of the enzyme GLS1, converting glutamine into glutamate. CB-839 treatment results in significant reduction in production of αKG and milder reduction in glutathione and glutamine-fueled nonessential AAs (NEAAs) compared with DON. However, the effect of CB-839 is paradoxical, as it is also reported to induce IFN associated gene expression in addition to its inhibitory effect in context of cancer (36). To evaluate the extent of glutamine-dependent bioenergetics and biosynthetic pathways we treated the Foxp3-deficient mice with DON or CB-839, and we found that DON- but not CB-839–treated mice showed a substantial improvement in overall disease severity, body weight index, and survival, as compared with vehicle-treated (PBS) animals (Figure 1, A and B, and Supplemental Figure 1A; supplemental material available online with this article; https://doi.org/10.1172/jci.insight.200076DS1). Cellular analysis revealed that DON, but not CB-839, reduced the frequency and number of splenic ΔTregs, total CD4+ and CD8+ T cell number, and activated/memory (CD62LloCD44hi) CD4+ and CD8+ Tconv cell frequency (Figure 1, C–F, and Supplemental Figure 1, B, C, and F). Furthermore, frequency and number of proinflammatory cytokine-producing CD4+ Tconv, ΔTreg (IFN-γ and IL-4), and CD8+ (IFN-γ) Tconv cells were also reduced upon DON treatment compared with those in vehicle-treated controls (Figure 1, G and H, and Supplemental Figure 1, D–F). Of note, Foxp3-deficient mice exhibit abundant autoantibodies in the serum (13, 37). We observed a significant reduction of splenic IgG1+IgD– B cells and serum levels of total IgM, IgA, IgG1, IgG2b, IgG2c, IgG3 Ig and direct IgG deposit within the kidneys of DON-treated mice, as compared with vehicle- or CB-839–treated animals (Figure 1, I–M). Indirect binding assays of serum IgG on ear sections of Rag1KO mice revealed that only DON treatment reduced the binding capacities of IgG on ear tissue (Supplemental Figure 1, G and H). To confirm the role of glutamine-dependent bioenergetic and biosynthetic pathways on B cell proliferation and class switching, we stimulated in vitro IgD+CD27– naive B cells isolated from WT mice with LPS+IL-4, resiquimod+IL-4, and CD40L+IL-4 in presence or absence of CB-839 and DON. We observed that, while CB-839 mildly reduced proliferation and class switching capacities of B cells in vitro in response to these 3 stimuli, DON treatment resulted in a superior inhibitory effect on B cell proliferation and antibody class switching (Supplemental Figure 1, I–P). Furthermore, DON-treated mice had decreased tissue inflammation (skin, liver, lungs, and kidney) compared with vehicle- and CB-839–treated mice (Figure 1, N and O). Furthermore, the role of glutamine-dependent biosynthetic pathways on inflammatory phenotype was extended in a dextran sodium sulfate–induced (DSS-induced) colitis model in the context of Foxp3-sufficient WT animals. Treatment with DSS in drinking water causes damage to the colonic epithelium, disrupting the mucosal barrier and inducing intestinal inflammation. Interestingly, animals receiving DSS in their drinking water along with i.p. DON treatment showed significantly lower body weight loss and reduced colitis severity (Supplemental Figure 2, A–D). This reduction of the severity of the DSS-induced colitis by DON treatment was associated with significantly lower CD4+ and CD8+ T cell infiltration and tissue damage in the colons of DON-treated mice, compared with vehicle-treated mice (Supplemental Figure 2, E and F). Additionally, CD4+ and CD8+ T cells showed lower activation (CD62LloCD44hi), higher naive T cell frequency, and reduction in proinflammatory cytokine secretion by CD4+ (IFN-γ and IL-4) and CD8+ (IFN-γ) Tconv cells (Supplemental Figure 2, G–N). Together, these results show that global blockade of glutamine functions, rather than its bioenergetic roles, support dysregulated autoreactive T and B cells to promote Foxp3 deficiency–mediated disease, suggesting that glutamine-dependent biosynthetic pathways play a predominant role in autoimmunity.
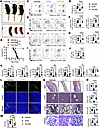 Figure 1
Glutamine-dependent biosynthetic pathways contribute to Foxp3 deficiency–mediated disease. (A and B) Gross appearance and the respective spleens of 21-day-old Foxp3ΔEGFPiCreR26YFP mice treated with vehicle, 6-diazo-5-oxo-norleucine (DON) or CB-839 (A) and survival over time (B). The results represent 1 of the 4 experiments. (C–J) Representative flow cytometric analysis and frequencies (scatterplots and means) of CD4+YFP+ ΔTregs (C and D); CD62LloCD44hi, CD62LhiCD44lo CD4+ Tconv (YFP–) cells (E and F); and IFN-γ and IL-4 expression by CD4+ Tconv (YFP–) cells (G and H) and IgG1+IgD– B cells (I and J) from the spleens of mice of the respective treatment group. (K) Serum concentrations of Ig IgM, IgA, IgG1, IgG2b, IgG2c, IgG3, and IgE of mice of the respective treatment group. (L and M) Representative immunofluorescence images of IgG deposit (original magnification, ×200) (L) and IgG mean fluorescent intensity (MFI) (M) of kidneys of mice of the respective treatment group (n = 6 per group). (N and O) Representative microscopic images of H&E staining (original magnification, ×200) (N) and histological scores (O) of the skin, lungs, livers, and kidneys of mice of the respective treatment group (n = 9). Statistical significance was determined by 1-way ANOVA with Tukey’s multiple comparisons. *P < 0.05, **P < 0.01, ***P < 0.001, ****P < 0.0001.
DON exerts beneficial effects independently of ΔTregs in Foxp3-deficient mice. ΔTregs produced proinflammatory cytokines such as IFN-γ and IL-4 and can potentially behave like pathogenic T cells and contribute to disease due to their potential autoreactivity in periphery of Foxp3-deficient mice. Since in vivo glutamine blockade by DON in Foxp3-deficient mice modulates not only T and B cell responses but also ΔTregs themselves, to evaluate the contribution of ΔTreg reprogramming by DON treatment, we tested the effect of ΔTreg depletion in DON-treated Foxp3-deficient mice (Figure 2). To accomplish ΔTreg depletion, Foxp3ΔEGFPiCreR26YFP and R26iDTR mice were crossed, allowing ΔTreg-specific expression of diphtheria toxin receptor (DTR), and upon diphtheria toxin (DT) treatment, ΔTreg depletion occurred. Surprisingly, the effect of DON on the Foxp3 deficiency–mediated disease was preserved even in ΔTreg-depleted mice (Figure 2, A–D, and Supplemental Figure 3A). Furthermore, the effect of DON on CD4+ Tconv effector memory frequency and number, Th1/Th2 cytokine (IFN-γ/IL-4) production, CD4+ and CD8+ naive T cell number, CD8+ Tconv effector memory frequency and IFN-γ production were only marginally altered upon ΔTreg depletion (Figure 2, E–H, and Supplemental Figure 3, B–F). Similar we observed a modest effect by DON on IgG1 class switching of B cells, serum Ig levels, autoantibodies against skin antigens and IgG deposit in kidney by DON in presence or absence of ΔTregs was observed (Figure 2, I–M, and Supplemental Figure 3, G and H). Finally, the overall effect of DON on tissue pathology was similar irrespective of the presence of ΔTregs (Figure 2, N and O). These results suggest that the salutary effects of DON on autoreactive and activated T and B cells are independent of ΔTreg metabolic reprogramming in the context of Foxp3 deficiency.
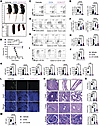 Figure 2
DON exerts beneficial effects independently of ΔTregs in Foxp3-deficient mice. (A and B) Gross appearance and the respective spleens of 21-day-old Foxp3ΔEGFPiCreR26YFP/iDTR mice treated with vehicle and DON with or without diphtheria toxin (DT) (A) and survival over time (B). The results represent 1 of the 4 experiments. (C–J) Representative flow cytometric analysis and frequencies (scatterplots and means) of CD4+YFP+ ΔTregs (C and D); CD62LloCD44hi, CD62LhiCD44lo CD4+ Tconv (YFP–) cells (E and F); and IFN-γ and IL-4 expression by CD4+ Tconv (YFP–) cells (G and H) and IgG1+IgD– B cells (I and J) from the spleens of mice of the respective treatment group. (K) Serum concentrations of Ig IgM, IgA, IgG1, IgG2b, IgG2c, IgG3, and IgE of mice of the respective treatment group. (L and M) Representative immunofluorescence images of IgG deposit (original magnification, ×200) (L) and IgG MFI (M) of kidneys of mice of the respective treatment group (n = 6 per group). (N and O) Representative microscopic images of H&E staining (original magnification, ×200) (N) and histological scores (O) of the skin, lungs, livers, and kidneys of mice of the respective treatment group (n = 9 per group). Statistical significance was determined by 1-way ANOVA with Tukey’s multiple comparisons. *P < 0.05, **P < 0.01, ***P < 0.001, ****P < 0.0001.
Glutamine usage blockage alters metabolic landscape. Various intermediate metabolites of glutamine metabolism contribute to different bioenergetic and biosynthetic processes. Glutamine acts as a source of carbon and nitrogen for nucleotide biosynthesis while its metabolite glutamate acts as a substrate for the synthesis of NEAAs and glutathione (38, 39). To further understand how inhibiting glutamine usage improves the Foxp3 deficiency–mediated disease, we analyzed plasma composition of Foxp3ΔEGFPiCre mice by liquid chromatography–mass spectrometry (LC-MS) at day 15 after birth following vehicle or DON treatment on day 11 and 14. Using principal component analysis (PCA), we were able to cluster the plasma samples by treatment (Figure 3A). Among 176 metabolites analyzed in vehicle- and DON-treated mouse plasma, 50 showed a marked difference in their relative abundance, represented in volcano plot and heatmap (Figure 3, B–D). A pathway enrichment analysis (using Kyoto Encyclopedia of Genes and Genomes [KEGG]) showed that the most altered metabolites were related to purine and histidine metabolism, suggesting that DON preferentially affects these pathways (Figure 3, C and D). Whereas metabolites related to the purine metabolism (e.g., FGAR, guanosine, inosine, xanthine, hypoxanthine,) were in higher relative abundance, metabolites related to glycolysis (e.g., lactate, pyruvate), TCA cycle (e.g., citrate, isocitrate), and glutamine-dependent AA synthesis (e.g., alanine, aspartate, asparagine, glutamate, proline, ornithine, serine) were in lower relative abundance in DON-treated mice, compared with vehicle-treated controls (Figure 3D). Since DON, but not CB-839, mitigates Foxp3 deficiency–mediated disease, we concluded that the TCA cycle and other glutamine-dependent bioenergetic metabolic pathways do not play a critical role in the in vivo DON effect in Foxp3-deficient mice. Among the glutamine-dependent biosynthetic pathways, inosine and asparagine (ASN) were substantially altered in differential abundance by DON treatment and represent interesting candidates to dampen autoreactive T and B cell responses, respectively (40–43). Analysis of the top 25 compounds corelated with the inosine and asparagine revealed upregulation of inosine metabolites coupled with a decrease in asparagine metabolites in the serum of DON-treated animals (Supplemental Figure 4, A and B). In agreement, metabolomic analysis of CD4+ T cells isolated from DON-treated Foxp3-deficient mice showed a differential metabolomic profile compared with that of CD4+ T cells isolated from PBS-treated Foxp3-deficient mice, including higher inosine level and enriched purine metabolic pathway activity in CD4+ T cells from DON-treated mice (Figure 4, A–D). These results confirm the direct role of inosine on DON-mediated T cell suppression. Additionally, metabolomics analysis of B cell isolated from DON-treated mice presented altered metabolomic profile, with enrichment of metabolites related to AA metabolism (Figure 4, E–H). Interestingly, there was a trend of higher asparagine level within B cell as opposed to serum asparagine level (Figure 4H). This observation reflects reduced utilization of asparagine by B cells upon DON treatment. These results support the direct role of glutamine on T and B cells mediated by inosine and asparagine, respectively.
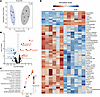 Figure 3
In vivo glutamine blockade alters purine and nonessential amino acid metabolism. (A) Principal component analysis (PCA) scores plot showing differentially expressed metabolites in the serum of DON- versus PBS-treated Foxp3ΔEGFPicreR26YFP mice. (B) Loading plots showing metabolites upregulated (red) versus downregulated (blue) in the serum of DON-treated Foxp3ΔEGFPicreR26YFP mice. (C) Lollipop diagram showing the markedly different KEGG pathways in DON- versus PBS-treated mouse plasma metabolites. (D) Heatmap comparing the abundance of plasma metabolites in DON- versus PBS-treated Foxp3-deficient mice. Red and blue indicate increased and decreased metabolite abundance, respectively, in the plasma of DON-treated mice relative to PBS-treated mice.
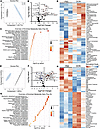 Figure 4
In vivo glutamine blockade in Foxp3-deficient mice alters T and B cell metabolism. (A–D) PCA plot (A), loading plot (B), lollipop diagram (C), and heatmap (D) comparing the metabolites of CD4+ T cells isolated from the spleens of DON- versus PBS-treated Foxp3ΔEGFPicreR26YFP mice. (E–H) PCA plot (E), loading plot (F), lollipop diagram (G), and heatmap (H) comparing the metabolites of B cells isolated from the spleen, of DON- versus PBS-treated Foxp3ΔEGFPicreR26YFP mice.
Inhibition of glutamine usage controls activation of autoreactive T and B cells in inosine- and asparagine-dependent manners, respectively. Inosine binds the adenosine (A2A) receptor expressed on effector T cells to prevent Th1/Th2 skewing of T cells, while asparagine can be taken up directly by immune cells, particularly germinal center B cells (43–45). To confirm the role of altered inosine and asparagine levels on T and B cell activity following DON treatment, we treated Foxp3ΔEGFPiCreR26YFP mice with DON in combination with an A2A receptor antagonist (SCH58261) or with asparagine supplementation. Cotreatment of DON with SCH58261 but not asparagine partially reversed the effect of DON on CD4+ Tconv effector memory frequency and number, Th1/Th2 cytokine (IFN-γ/IL-4) production by Tconv cells and ΔTregs, CD4+/CD8+/CD4+ effector T cell memory, and naive T cell number, CD8+ T cell number and IFN-γ production (Figure 5, A–F, and Supplemental Figure 5, A–H). In contrast, while concurrent asparagine supplementation with DON marginally affected T cell responses, it reversed the effect of DON on B cell activation and autoreactivity, including restoration of IgG1 class switching of B cells, germinal center B cell formation, IgG/IgM autoreactivity against self-antigens, high serum Ig levels, and IgG antibody deposit in kidney (Figure 5, G–M, and Supplemental Figure 5I). As a result, concurrent A2A receptor blockade reversed the beneficial effect of DON on skin inflammation in the context of asparagine supplementation restoration of IgG deposit in kidney resulted in increased severity of kidney pathology (Figure 5, N and O). By comparing the in vitro capacities of naive B cells isolated from WT mice to proliferate and secrete IgG1 upon LPS+IL-4 stimulation in presence or absence of DON and asparagine in asparagine low (DMEM) and rich (RPMI) medium, we confirmed that asparagine is a critical NEAA for B cell proliferation and IgG1 production that can partially reverse the effect of DON (Supplemental Figure 5, J–L). Overall, the effects of A2A receptor blockade and asparagine supplementation in the presence of DON on T and B cells suggest that DON alters glutamine dependent biosynthetic pathways to inhibit T and B cell functions, respectively, via inosine and asparagine to mitigate the Foxp3 deficiency–mediated disease.
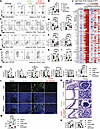 Figure 5
Inhibition of glutamine usage controls activation of autoreactive T and B cells in inosine- and asparagine-dependent manners, respectively. (A–I) Representative flow cytometric analysis and frequencies (scatterplots and means) of CD4+YFP+ ΔTregs (A and B); CD62LloCD44hi, CD62LhiCD44lo CD4+ Tconv (YFP–) cells (C and D); IFN-γ and IL-4 expression by CD4+ Tconv (YFP–) cells (E and F), IgG1+IgD– B cells (G and H), and GL-7+CD38– germinal center B cells (I) from the spleens of mice treated with vehicle, DON, DON+ASN, or DON+SCH58261. (J) Heatmap of IgG autoantigen array analysis in the serum of untreated age-matched WT and Foxp3ΔEGFPicreR26YFP mice treated with vehicle, DON, or DON+ASN. Fold change values for each group were calculated by normalizing with the values of WT mice. The observed fold change values are color-coded per the legend at the top of the heatmap. (K) Serum concentrations of Ig IgM, IgA, IgG1, IgG2b, IgG2c, IgG3, and IgE of mice of the respective treatment group. (L and M) Representative immunofluorescence images of IgG deposit (original magnification, ×200) (L) and mean fluorescence intensity (M) of kidneys of mice of the respective treatment group (n = 6). (N and O) Representative microscopic images of H&E staining (original magnification, ×200) (N) and histological scores (O) of the skin and kidneys of mice of the respective treatment group (n = 9). Statistical significance was determined by 1-way ANOVA with Tukey’s multiple comparisons. *P < 0.05, **P < 0.01, ***P < 0.001, ****P < 0.0001.
Asparagine exclusively controls activation of B cell in Foxp3 deficiency–mediated disease. Next, we wanted to assess the selective dependence of autoreactive B cell activation on asparagine in the context of Foxp3 deficiency using the asparagine-depleting enzyme asparaginase (ASNS). We observed that treatment of Foxp3ΔEGFPiCreR26YFP mice with ASNS has mild effect on gross representation and splenomegaly compared with treatment with DON (Figure 6, A and B). Consistent with asparagine supplementation with DON (Figure 5), depletion of asparagine with ASNS significantly reduced the IgG1 class switching of B cells and germinal center (GC) formation similar to DON (Figure 6, C–F). Notably, in contrast to DON treatment, ASNS treatment did not reduce the frequency of ΔTregs (Figure 6, G and H). Furthermore, unlike DON treatment, ASNS treatment also failed to control CD4+/CD8+ Tconv effector memory cell frequency, Th1/Th2 cytokine (IFN-γ/IL-4) production by CD4+ Tconv cells, and IFN-γ production by CD8+ Tconv cells (Figure 6, I–P). Furthermore, like its effect on B cell class switching and GC formation ASNS treatment resulted in significantly reduced serum IgG1 and IgE levels and IgG deposit in kidney, comparable to DON treatment (Figure 6, Q–T). These results suggest that alteration in asparagine bioavailability upon DON treatment results specifically in inhibition of B cell activation in the context of Foxp3 deficiency.
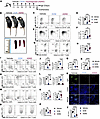 Figure 6
Asparagine exclusively controls B cell dysregulation in Foxp3 deficiency–mediated disease. (A and B) Treatment strategy (A) and gross appearance and the respective spleens of 21-day-old Foxp3ΔEGFPiCreR26YFP mice treated with vehicle, DON, or asparaginase (ASNS) (B). The results represent 1 of the 3 experiments. (C–P) Representative flow cytometric analysis and frequencies (scatterplots and means) of IgG1+IgD– B cells (C and D), GL-7+CD38– B cells (E and F), CD4+YFP+ ΔTregs (G and H), CD62LloCD44hi, CD62LhiCD44lo CD4+ Tconv (YFP–) cells (I and J), CD62LloCD44hi, CD62LhiCD44lo CD8+ Tconv (YFP–) (K and L), IFN-γ and IL-4 expression by CD4+ Tconv (YFP–) cells (M and N), and IFN-γ expression by CD8+ Tconv (YFP–) cells (O and P) from the spleens of mice of the respective treatment group. (Q and R) Serum concentrations of Ig IgG1 (Q) and IgE (R) of mice of the respective treatment group. (S and T) Representative immunofluorescence images of IgG deposit (original magnification, ×200) (S) and IgG mean fluorescent intensity (MFI) (T) of kidneys of mice of the respective treatment group (n = 6) per group. Statistical significance was determined by 1-way ANOVA with Tukey’s multiple comparisons. *P < 0.05, **P < 0.01, ***P < 0.001, ****P < 0.0001.


