
Research ArticleImmunologyPulmonology
Open Access |  10.1172/jci.insight.203080
Multiomic analysis identifies T cell subsets and mechanisms of epithelial interaction in idiopathic pulmonary fibrosis
Ana P.M. Serezani,1 Julia M.R. Bazzano,1 Bruno D. Pascoalino,1 Ludmilla da Silva,1 Abigail J. Dietrich,1 Chase J. Taylor,1 Taylor Sherrill,1 Annika Vannan,2 Carla L. Calvi,1 Paula I. Gonzalez-Ericsson,3 Erin M. Wilfong,1,4 Matthew Bacchetta,5 Ciara M. Shaver,1 Lorraine B. Ware,1,6 Margaret L. Salisbury,1 Luc Van Kaer,6 Nicholas E. Banovich,2 Jonathan A. Kropski,1,7,8 and Timothy S. Blackwell9,10
1Department of Medicine, Division of Allergy, Pulmonary and Critical Care Medicine, Vanderbilt University Medical Center, Nashville, Tennessee, USA.
2Translational Genomics Research Institute, Phoenix, Arizona, USA.
3Department of Medicine, Division of Hematology and Oncology,
4Department of Medicine, Division of Rheumatology and Immunology,
5Department of Cardiac Surgery, and
6Department of Pathology, Microbiology, and Immunology, Vanderbilt University Medical Center, Nashville, Tennessee, USA.
7Department of Cell and Developmental Biology, Vanderbilt University, Nashville, Tennessee, USA.
8Department of Veterans Affairs Medical Center, Nashville, Tennessee, USA.
9Department of Medicine, University of Michigan, Ann Arbor, Michigan, USA.
10Department of Veterans Affairs Medical Center, Ann Arbor, Michigan, USA.
Address correspondence to: Ana Serezani, Vanderbilt University Medical Center, 1161 21st Avenue S, MCN B1320B, Nashville, Tennessee 37232, USA. Phone: 615.875.9482; Email: ana.p.serezani@vumc.org.
Find articles by Serezani, A. in: PubMed | Google Scholar
1Department of Medicine, Division of Allergy, Pulmonary and Critical Care Medicine, Vanderbilt University Medical Center, Nashville, Tennessee, USA.
2Translational Genomics Research Institute, Phoenix, Arizona, USA.
3Department of Medicine, Division of Hematology and Oncology,
4Department of Medicine, Division of Rheumatology and Immunology,
5Department of Cardiac Surgery, and
6Department of Pathology, Microbiology, and Immunology, Vanderbilt University Medical Center, Nashville, Tennessee, USA.
7Department of Cell and Developmental Biology, Vanderbilt University, Nashville, Tennessee, USA.
8Department of Veterans Affairs Medical Center, Nashville, Tennessee, USA.
9Department of Medicine, University of Michigan, Ann Arbor, Michigan, USA.
10Department of Veterans Affairs Medical Center, Ann Arbor, Michigan, USA.
Address correspondence to: Ana Serezani, Vanderbilt University Medical Center, 1161 21st Avenue S, MCN B1320B, Nashville, Tennessee 37232, USA. Phone: 615.875.9482; Email: ana.p.serezani@vumc.org.
Find articles by Bazzano, J. in: PubMed | Google Scholar
1Department of Medicine, Division of Allergy, Pulmonary and Critical Care Medicine, Vanderbilt University Medical Center, Nashville, Tennessee, USA.
2Translational Genomics Research Institute, Phoenix, Arizona, USA.
3Department of Medicine, Division of Hematology and Oncology,
4Department of Medicine, Division of Rheumatology and Immunology,
5Department of Cardiac Surgery, and
6Department of Pathology, Microbiology, and Immunology, Vanderbilt University Medical Center, Nashville, Tennessee, USA.
7Department of Cell and Developmental Biology, Vanderbilt University, Nashville, Tennessee, USA.
8Department of Veterans Affairs Medical Center, Nashville, Tennessee, USA.
9Department of Medicine, University of Michigan, Ann Arbor, Michigan, USA.
10Department of Veterans Affairs Medical Center, Ann Arbor, Michigan, USA.
Address correspondence to: Ana Serezani, Vanderbilt University Medical Center, 1161 21st Avenue S, MCN B1320B, Nashville, Tennessee 37232, USA. Phone: 615.875.9482; Email: ana.p.serezani@vumc.org.
Find articles by Pascoalino, B. in: PubMed | Google Scholar
1Department of Medicine, Division of Allergy, Pulmonary and Critical Care Medicine, Vanderbilt University Medical Center, Nashville, Tennessee, USA.
2Translational Genomics Research Institute, Phoenix, Arizona, USA.
3Department of Medicine, Division of Hematology and Oncology,
4Department of Medicine, Division of Rheumatology and Immunology,
5Department of Cardiac Surgery, and
6Department of Pathology, Microbiology, and Immunology, Vanderbilt University Medical Center, Nashville, Tennessee, USA.
7Department of Cell and Developmental Biology, Vanderbilt University, Nashville, Tennessee, USA.
8Department of Veterans Affairs Medical Center, Nashville, Tennessee, USA.
9Department of Medicine, University of Michigan, Ann Arbor, Michigan, USA.
10Department of Veterans Affairs Medical Center, Ann Arbor, Michigan, USA.
Address correspondence to: Ana Serezani, Vanderbilt University Medical Center, 1161 21st Avenue S, MCN B1320B, Nashville, Tennessee 37232, USA. Phone: 615.875.9482; Email: ana.p.serezani@vumc.org.
Find articles by da Silva, L. in: PubMed | Google Scholar
1Department of Medicine, Division of Allergy, Pulmonary and Critical Care Medicine, Vanderbilt University Medical Center, Nashville, Tennessee, USA.
2Translational Genomics Research Institute, Phoenix, Arizona, USA.
3Department of Medicine, Division of Hematology and Oncology,
4Department of Medicine, Division of Rheumatology and Immunology,
5Department of Cardiac Surgery, and
6Department of Pathology, Microbiology, and Immunology, Vanderbilt University Medical Center, Nashville, Tennessee, USA.
7Department of Cell and Developmental Biology, Vanderbilt University, Nashville, Tennessee, USA.
8Department of Veterans Affairs Medical Center, Nashville, Tennessee, USA.
9Department of Medicine, University of Michigan, Ann Arbor, Michigan, USA.
10Department of Veterans Affairs Medical Center, Ann Arbor, Michigan, USA.
Address correspondence to: Ana Serezani, Vanderbilt University Medical Center, 1161 21st Avenue S, MCN B1320B, Nashville, Tennessee 37232, USA. Phone: 615.875.9482; Email: ana.p.serezani@vumc.org.
Find articles by Dietrich, A. in: PubMed | Google Scholar
1Department of Medicine, Division of Allergy, Pulmonary and Critical Care Medicine, Vanderbilt University Medical Center, Nashville, Tennessee, USA.
2Translational Genomics Research Institute, Phoenix, Arizona, USA.
3Department of Medicine, Division of Hematology and Oncology,
4Department of Medicine, Division of Rheumatology and Immunology,
5Department of Cardiac Surgery, and
6Department of Pathology, Microbiology, and Immunology, Vanderbilt University Medical Center, Nashville, Tennessee, USA.
7Department of Cell and Developmental Biology, Vanderbilt University, Nashville, Tennessee, USA.
8Department of Veterans Affairs Medical Center, Nashville, Tennessee, USA.
9Department of Medicine, University of Michigan, Ann Arbor, Michigan, USA.
10Department of Veterans Affairs Medical Center, Ann Arbor, Michigan, USA.
Address correspondence to: Ana Serezani, Vanderbilt University Medical Center, 1161 21st Avenue S, MCN B1320B, Nashville, Tennessee 37232, USA. Phone: 615.875.9482; Email: ana.p.serezani@vumc.org.
Find articles by Taylor, C. in: PubMed | Google Scholar
1Department of Medicine, Division of Allergy, Pulmonary and Critical Care Medicine, Vanderbilt University Medical Center, Nashville, Tennessee, USA.
2Translational Genomics Research Institute, Phoenix, Arizona, USA.
3Department of Medicine, Division of Hematology and Oncology,
4Department of Medicine, Division of Rheumatology and Immunology,
5Department of Cardiac Surgery, and
6Department of Pathology, Microbiology, and Immunology, Vanderbilt University Medical Center, Nashville, Tennessee, USA.
7Department of Cell and Developmental Biology, Vanderbilt University, Nashville, Tennessee, USA.
8Department of Veterans Affairs Medical Center, Nashville, Tennessee, USA.
9Department of Medicine, University of Michigan, Ann Arbor, Michigan, USA.
10Department of Veterans Affairs Medical Center, Ann Arbor, Michigan, USA.
Address correspondence to: Ana Serezani, Vanderbilt University Medical Center, 1161 21st Avenue S, MCN B1320B, Nashville, Tennessee 37232, USA. Phone: 615.875.9482; Email: ana.p.serezani@vumc.org.
Find articles by Sherrill, T. in: PubMed | Google Scholar
1Department of Medicine, Division of Allergy, Pulmonary and Critical Care Medicine, Vanderbilt University Medical Center, Nashville, Tennessee, USA.
2Translational Genomics Research Institute, Phoenix, Arizona, USA.
3Department of Medicine, Division of Hematology and Oncology,
4Department of Medicine, Division of Rheumatology and Immunology,
5Department of Cardiac Surgery, and
6Department of Pathology, Microbiology, and Immunology, Vanderbilt University Medical Center, Nashville, Tennessee, USA.
7Department of Cell and Developmental Biology, Vanderbilt University, Nashville, Tennessee, USA.
8Department of Veterans Affairs Medical Center, Nashville, Tennessee, USA.
9Department of Medicine, University of Michigan, Ann Arbor, Michigan, USA.
10Department of Veterans Affairs Medical Center, Ann Arbor, Michigan, USA.
Address correspondence to: Ana Serezani, Vanderbilt University Medical Center, 1161 21st Avenue S, MCN B1320B, Nashville, Tennessee 37232, USA. Phone: 615.875.9482; Email: ana.p.serezani@vumc.org.
Find articles by Vannan, A. in: PubMed | Google Scholar
1Department of Medicine, Division of Allergy, Pulmonary and Critical Care Medicine, Vanderbilt University Medical Center, Nashville, Tennessee, USA.
2Translational Genomics Research Institute, Phoenix, Arizona, USA.
3Department of Medicine, Division of Hematology and Oncology,
4Department of Medicine, Division of Rheumatology and Immunology,
5Department of Cardiac Surgery, and
6Department of Pathology, Microbiology, and Immunology, Vanderbilt University Medical Center, Nashville, Tennessee, USA.
7Department of Cell and Developmental Biology, Vanderbilt University, Nashville, Tennessee, USA.
8Department of Veterans Affairs Medical Center, Nashville, Tennessee, USA.
9Department of Medicine, University of Michigan, Ann Arbor, Michigan, USA.
10Department of Veterans Affairs Medical Center, Ann Arbor, Michigan, USA.
Address correspondence to: Ana Serezani, Vanderbilt University Medical Center, 1161 21st Avenue S, MCN B1320B, Nashville, Tennessee 37232, USA. Phone: 615.875.9482; Email: ana.p.serezani@vumc.org.
Find articles by Calvi, C. in: PubMed | Google Scholar
1Department of Medicine, Division of Allergy, Pulmonary and Critical Care Medicine, Vanderbilt University Medical Center, Nashville, Tennessee, USA.
2Translational Genomics Research Institute, Phoenix, Arizona, USA.
3Department of Medicine, Division of Hematology and Oncology,
4Department of Medicine, Division of Rheumatology and Immunology,
5Department of Cardiac Surgery, and
6Department of Pathology, Microbiology, and Immunology, Vanderbilt University Medical Center, Nashville, Tennessee, USA.
7Department of Cell and Developmental Biology, Vanderbilt University, Nashville, Tennessee, USA.
8Department of Veterans Affairs Medical Center, Nashville, Tennessee, USA.
9Department of Medicine, University of Michigan, Ann Arbor, Michigan, USA.
10Department of Veterans Affairs Medical Center, Ann Arbor, Michigan, USA.
Address correspondence to: Ana Serezani, Vanderbilt University Medical Center, 1161 21st Avenue S, MCN B1320B, Nashville, Tennessee 37232, USA. Phone: 615.875.9482; Email: ana.p.serezani@vumc.org.
Find articles by Gonzalez-Ericsson, P. in: PubMed | Google Scholar
1Department of Medicine, Division of Allergy, Pulmonary and Critical Care Medicine, Vanderbilt University Medical Center, Nashville, Tennessee, USA.
2Translational Genomics Research Institute, Phoenix, Arizona, USA.
3Department of Medicine, Division of Hematology and Oncology,
4Department of Medicine, Division of Rheumatology and Immunology,
5Department of Cardiac Surgery, and
6Department of Pathology, Microbiology, and Immunology, Vanderbilt University Medical Center, Nashville, Tennessee, USA.
7Department of Cell and Developmental Biology, Vanderbilt University, Nashville, Tennessee, USA.
8Department of Veterans Affairs Medical Center, Nashville, Tennessee, USA.
9Department of Medicine, University of Michigan, Ann Arbor, Michigan, USA.
10Department of Veterans Affairs Medical Center, Ann Arbor, Michigan, USA.
Address correspondence to: Ana Serezani, Vanderbilt University Medical Center, 1161 21st Avenue S, MCN B1320B, Nashville, Tennessee 37232, USA. Phone: 615.875.9482; Email: ana.p.serezani@vumc.org.
Find articles by Wilfong, E. in: PubMed | Google Scholar
1Department of Medicine, Division of Allergy, Pulmonary and Critical Care Medicine, Vanderbilt University Medical Center, Nashville, Tennessee, USA.
2Translational Genomics Research Institute, Phoenix, Arizona, USA.
3Department of Medicine, Division of Hematology and Oncology,
4Department of Medicine, Division of Rheumatology and Immunology,
5Department of Cardiac Surgery, and
6Department of Pathology, Microbiology, and Immunology, Vanderbilt University Medical Center, Nashville, Tennessee, USA.
7Department of Cell and Developmental Biology, Vanderbilt University, Nashville, Tennessee, USA.
8Department of Veterans Affairs Medical Center, Nashville, Tennessee, USA.
9Department of Medicine, University of Michigan, Ann Arbor, Michigan, USA.
10Department of Veterans Affairs Medical Center, Ann Arbor, Michigan, USA.
Address correspondence to: Ana Serezani, Vanderbilt University Medical Center, 1161 21st Avenue S, MCN B1320B, Nashville, Tennessee 37232, USA. Phone: 615.875.9482; Email: ana.p.serezani@vumc.org.
Find articles by
Bacchetta, M.
in:
PubMed
|
Google Scholar
|

1Department of Medicine, Division of Allergy, Pulmonary and Critical Care Medicine, Vanderbilt University Medical Center, Nashville, Tennessee, USA.
2Translational Genomics Research Institute, Phoenix, Arizona, USA.
3Department of Medicine, Division of Hematology and Oncology,
4Department of Medicine, Division of Rheumatology and Immunology,
5Department of Cardiac Surgery, and
6Department of Pathology, Microbiology, and Immunology, Vanderbilt University Medical Center, Nashville, Tennessee, USA.
7Department of Cell and Developmental Biology, Vanderbilt University, Nashville, Tennessee, USA.
8Department of Veterans Affairs Medical Center, Nashville, Tennessee, USA.
9Department of Medicine, University of Michigan, Ann Arbor, Michigan, USA.
10Department of Veterans Affairs Medical Center, Ann Arbor, Michigan, USA.
Address correspondence to: Ana Serezani, Vanderbilt University Medical Center, 1161 21st Avenue S, MCN B1320B, Nashville, Tennessee 37232, USA. Phone: 615.875.9482; Email: ana.p.serezani@vumc.org.
Find articles by
Shaver, C.
in:
PubMed
|
Google Scholar
|
1Department of Medicine, Division of Allergy, Pulmonary and Critical Care Medicine, Vanderbilt University Medical Center, Nashville, Tennessee, USA.
2Translational Genomics Research Institute, Phoenix, Arizona, USA.
3Department of Medicine, Division of Hematology and Oncology,
4Department of Medicine, Division of Rheumatology and Immunology,
5Department of Cardiac Surgery, and
6Department of Pathology, Microbiology, and Immunology, Vanderbilt University Medical Center, Nashville, Tennessee, USA.
7Department of Cell and Developmental Biology, Vanderbilt University, Nashville, Tennessee, USA.
8Department of Veterans Affairs Medical Center, Nashville, Tennessee, USA.
9Department of Medicine, University of Michigan, Ann Arbor, Michigan, USA.
10Department of Veterans Affairs Medical Center, Ann Arbor, Michigan, USA.
Address correspondence to: Ana Serezani, Vanderbilt University Medical Center, 1161 21st Avenue S, MCN B1320B, Nashville, Tennessee 37232, USA. Phone: 615.875.9482; Email: ana.p.serezani@vumc.org.
Find articles by
Ware, L.
in:
PubMed
|
Google Scholar
|
1Department of Medicine, Division of Allergy, Pulmonary and Critical Care Medicine, Vanderbilt University Medical Center, Nashville, Tennessee, USA.
2Translational Genomics Research Institute, Phoenix, Arizona, USA.
3Department of Medicine, Division of Hematology and Oncology,
4Department of Medicine, Division of Rheumatology and Immunology,
5Department of Cardiac Surgery, and
6Department of Pathology, Microbiology, and Immunology, Vanderbilt University Medical Center, Nashville, Tennessee, USA.
7Department of Cell and Developmental Biology, Vanderbilt University, Nashville, Tennessee, USA.
8Department of Veterans Affairs Medical Center, Nashville, Tennessee, USA.
9Department of Medicine, University of Michigan, Ann Arbor, Michigan, USA.
10Department of Veterans Affairs Medical Center, Ann Arbor, Michigan, USA.
Address correspondence to: Ana Serezani, Vanderbilt University Medical Center, 1161 21st Avenue S, MCN B1320B, Nashville, Tennessee 37232, USA. Phone: 615.875.9482; Email: ana.p.serezani@vumc.org.
Find articles by Salisbury, M. in: PubMed | Google Scholar
1Department of Medicine, Division of Allergy, Pulmonary and Critical Care Medicine, Vanderbilt University Medical Center, Nashville, Tennessee, USA.
2Translational Genomics Research Institute, Phoenix, Arizona, USA.
3Department of Medicine, Division of Hematology and Oncology,
4Department of Medicine, Division of Rheumatology and Immunology,
5Department of Cardiac Surgery, and
6Department of Pathology, Microbiology, and Immunology, Vanderbilt University Medical Center, Nashville, Tennessee, USA.
7Department of Cell and Developmental Biology, Vanderbilt University, Nashville, Tennessee, USA.
8Department of Veterans Affairs Medical Center, Nashville, Tennessee, USA.
9Department of Medicine, University of Michigan, Ann Arbor, Michigan, USA.
10Department of Veterans Affairs Medical Center, Ann Arbor, Michigan, USA.
Address correspondence to: Ana Serezani, Vanderbilt University Medical Center, 1161 21st Avenue S, MCN B1320B, Nashville, Tennessee 37232, USA. Phone: 615.875.9482; Email: ana.p.serezani@vumc.org.
Find articles by
Van Kaer, L.
in:
PubMed
|
Google Scholar
|
1Department of Medicine, Division of Allergy, Pulmonary and Critical Care Medicine, Vanderbilt University Medical Center, Nashville, Tennessee, USA.
2Translational Genomics Research Institute, Phoenix, Arizona, USA.
3Department of Medicine, Division of Hematology and Oncology,
4Department of Medicine, Division of Rheumatology and Immunology,
5Department of Cardiac Surgery, and
6Department of Pathology, Microbiology, and Immunology, Vanderbilt University Medical Center, Nashville, Tennessee, USA.
7Department of Cell and Developmental Biology, Vanderbilt University, Nashville, Tennessee, USA.
8Department of Veterans Affairs Medical Center, Nashville, Tennessee, USA.
9Department of Medicine, University of Michigan, Ann Arbor, Michigan, USA.
10Department of Veterans Affairs Medical Center, Ann Arbor, Michigan, USA.
Address correspondence to: Ana Serezani, Vanderbilt University Medical Center, 1161 21st Avenue S, MCN B1320B, Nashville, Tennessee 37232, USA. Phone: 615.875.9482; Email: ana.p.serezani@vumc.org.
Find articles by
Banovich, N.
in:
PubMed
|
Google Scholar
|
1Department of Medicine, Division of Allergy, Pulmonary and Critical Care Medicine, Vanderbilt University Medical Center, Nashville, Tennessee, USA.
2Translational Genomics Research Institute, Phoenix, Arizona, USA.
3Department of Medicine, Division of Hematology and Oncology,
4Department of Medicine, Division of Rheumatology and Immunology,
5Department of Cardiac Surgery, and
6Department of Pathology, Microbiology, and Immunology, Vanderbilt University Medical Center, Nashville, Tennessee, USA.
7Department of Cell and Developmental Biology, Vanderbilt University, Nashville, Tennessee, USA.
8Department of Veterans Affairs Medical Center, Nashville, Tennessee, USA.
9Department of Medicine, University of Michigan, Ann Arbor, Michigan, USA.
10Department of Veterans Affairs Medical Center, Ann Arbor, Michigan, USA.
Address correspondence to: Ana Serezani, Vanderbilt University Medical Center, 1161 21st Avenue S, MCN B1320B, Nashville, Tennessee 37232, USA. Phone: 615.875.9482; Email: ana.p.serezani@vumc.org.
Find articles by Kropski, J. in: PubMed | Google Scholar
1Department of Medicine, Division of Allergy, Pulmonary and Critical Care Medicine, Vanderbilt University Medical Center, Nashville, Tennessee, USA.
2Translational Genomics Research Institute, Phoenix, Arizona, USA.
3Department of Medicine, Division of Hematology and Oncology,
4Department of Medicine, Division of Rheumatology and Immunology,
5Department of Cardiac Surgery, and
6Department of Pathology, Microbiology, and Immunology, Vanderbilt University Medical Center, Nashville, Tennessee, USA.
7Department of Cell and Developmental Biology, Vanderbilt University, Nashville, Tennessee, USA.
8Department of Veterans Affairs Medical Center, Nashville, Tennessee, USA.
9Department of Medicine, University of Michigan, Ann Arbor, Michigan, USA.
10Department of Veterans Affairs Medical Center, Ann Arbor, Michigan, USA.
Address correspondence to: Ana Serezani, Vanderbilt University Medical Center, 1161 21st Avenue S, MCN B1320B, Nashville, Tennessee 37232, USA. Phone: 615.875.9482; Email: ana.p.serezani@vumc.org.
Find articles by Blackwell, T. in: PubMed | Google Scholar
Published September 8, 2026 - More info
JCI Insight. 2026;11(17):e203080. https://doi.org/10.1172/jci.insight.203080.
© 2026 Serezani et al. This work is licensed under the Creative Commons Attribution 4.0 International License. To view a copy of this license, visit http://creativecommons.org/licenses/by/4.0/.
Received: December 2, 2025; Accepted: July 28, 2026

-
Results
Characterization of lung T cell subsets in IPF. To identify the subsets of T cells present in the lungs, we performed cellular indexing of transcriptomes and epitopes by sequencing (CITE-seq) using the 10x Genomics platform on CD3+ T lymphocytes isolated from lung explants of 10 control patients, 9 IPF patients, and 10 non-IPF ILD patients (Supplemental Table 1; supplemental material available online with this article; https://doi.org/10.1172/jci.insight.203080DS1). Minced lung tissues were processed as previously described (11), and total CD3+ live T cells were sorted by flow cytometry. Before sequencing, cells were incubated with oligo-conjugated antibodies targeting 15 surface markers for CITE-seq (Figure 1A and Supplemental Table 2).
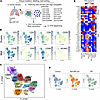 Figure 1
CITE-seq profiling and annotation of lung T cells. (A) Workflow schematic illustrating lung tissue dissociation, T cell staining, sorting, and CITE-seq library preparation. Created with BioRender (biorender.com). (B) Multimodal clustering integrating RNA and antibody-derived tag (ADT) protein measurements, visualized by uniform manifold approximation and projection (UMAP), from 91,434 cells isolated from 10 control lungs and 19 fibrotic ILD lungs (IPF and non-IPF ILD). Each dot represents one cell. (C) UMAP showing annotated T cell subsets based on combined RNA and ADT marker expression; colors indicate subsets as labeled. (D) UMAPs showing T cell cluster distribution stratified by diagnosis (control, non-IPF ILD, and IPF: n = 10, n = 10, and n = 9 lungs, respectively). (E) Heatmap of selected signature markers used to define each T cell subset, showing both RNA expression and ADT protein levels (values are normalized and scaled within each marker).
Using multimodal analysis of the processed data, we identified 11 subpopulations of CD4+ and CD8+ T cells based on combined RNA and protein marker expression (Figure 1B). Clusters were annotated according to canonical T cell markers as follows: CD4+ central memory T cells (Tcms; SELL+), CD4+ effector memory T cells (Tems; CD45RO+SELL–), CD4+ regulatory T cells (Tregs; CD25+, FOXP3+), CD4+ resident memory T cells (Trms; CD103+, ITGAE+), an unusual population of CD56+ Tregs (CD56+, NCAM1+, FOXP3+), CD8+ Tems (GZMK+), CD8+ Trms (CD103+, ITGAE+), cytotoxic CD4+ and cytotoxic CD8+ T cells (GNLY+, CD56–, NCAM1–), γδ T cells (TRDC+), and natural killer–like T cells (NKT-like; GNLY+, CD56+, NCAM1+) (Figure 1, C–E). Several of these subsets expressed cytotoxicity-related genes, including granzymes (GZMA, GZMB, GZMH). All T cell subsets were identified across participants and within the 3 groups, though in varied frequencies (Supplemental Figure 1, A and B). To confirm the existence of CD56+ Tregs in the lungs, we used our cytometry by time of flight (CyTOF) dataset from both peripheral blood and lungs (11) and identified the presence of FOXP3/CD56-expressing CD4+ T cells. CD56 was weakly detected in the lungs, but CD38 (a marker to identify activated NK cells; ref. 27) colocalized with FOXP3 in a subset of immune cells. These results indicate the presence of a CD56+ Treg-like population among CD4+CD25+ T cells, present predominantly in the lungs of IPF compared with control donors or peripheral blood (Supplemental Figure 1C). These findings highlight a diverse network of T cell subsets in the lung, including rare populations of regulatory T cells.
We explored disease-related alterations in gene expression between CD4+ Tregs and CD56+ Tregs by performing cell type–specific, subject-level pseudobulk differential expression analyses. We first identified differentially expressed genes (DEGs) in CD4+ Tregs and CD56+ Tregs in IPF compared with control subsets (Supplemental Figure 2A). We observed that the two subsets contain 33 common DEGs in IPF. These shared genes include canonical Treg markers, such as FOXP3, IL2RA (CD25), tumor necrosis factor receptor superfamily member 18 (TNFRSF18; also known as glucocorticoid-induced TNFR-related protein [GITR]), and T cell immunoglobulin and ITIM domain (TIGIT) (Supplemental Figure 2B). We performed a gene ontology analysis (Reactome pathway database, ref. 28) of the shared or unique DEGs observed in CD4+ Tregs and CD56+ Tregs (Supplemental Figure 2C), which revealed that shared genes are primarily involved in the regulation of the immune system and cytokine signaling, but also involved in other functions, such as the metabolism of carbohydrates. In contrast, DEGs unique to CD56+ Tregs are associated with several distinct pathways, which align with a more complex transcriptional response (Supplemental Figure 2C). We inspected the top 7 unique genes in CD56+ Tregs and observed that several genes were downregulated in IPF compared with control cells (Supplemental Figure 2D), including EPHA4 (ephrin type A receptor 4), which is primarily expressed by Tregs in the immunosuppressive tumor microenvironment (29). As a comparison, we performed gene ontology analysis in Tregs isolated from autoimmune-associated ILD (non-IPF ILD) and controls and observed some overlap between pathways differentially regulated in these cell types in IPF; however, CD4+ Tregs in non-IPF ILD exhibited more DEGs and pathways compared with CD4+ Tregs in IPF lungs (Supplemental Figure 2, E–H).
Defining the activation profile of T cells in IPF and non-IPF ILD. To identify signaling pathways underlying different functions of T cells in fibrosis, we expanded our pseudobulk differential expression analyses to include all 11 T cell subsets. The large majority of DEGs were upregulated in T cells in IPF compared with control subsets (Figure 2A). CD56+ Tregs showed the greatest number of DEGs compared with other T cell subsets. Figure 2B shows the top 5 DEGs for CD4+ Tregs, CD56+ Tregs, CD4+ Tems, CD4+ Trms, CD8+ Trms, and NKT-like cells. In these T cell subsets, we further examined DEGs using a multivariate linear model and PROGENy (a pathway inference framework based on different pathway resources; ref. 30) to identify differentially activated pathways. We found that epidermal growth factor receptor (EGFR) signaling, TGF-β, and TNF/TRAIL signaling were increased in these T cell subsets, with EGFR signaling consistently being the most upregulated pathway across subsets (Figure 2C). These results indicate a conserved set of signaling pathways in IPF, which are likely influenced by local factors present in the fibrotic microenvironment.
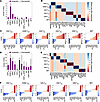 Figure 2
Differential gene expression and pathway activity across lung T cell populations in lung fibrosis. (A) Number of upregulated (purple) and downregulated (gray) differentially expressed genes (DEGs) in each T cell subset in IPF lungs compared with controls. DEGs were identified by PyDESeq2 pseudobulk analysis using thresholds of adjusted P value (padj) < 0.05 and log2 fold change > 1. (B) Heatmap of the top 5 DEGs per T cell subset from the IPF-versus-control pseudobulk analysis. (C) PROGENy pathway activity scores for the top 10 pathways across 6 T cell subsets in IPF lungs, inferred from pseudobulk gene expression profiles using multilevel modeling (MLM). Pathways are ranked by activity score; active pathways are shown in red and inactive pathways in blue. (D) Number of upregulated (purple) and downregulated (gray) DEGs in each T cell subset in non-IPF ILD lungs compared with controls (PyDESeq2 pseudobulk; padj < 0.05 and log2 fold change > 1). (E) Heatmap of the top 5 DEGs per T cell subset from the non-IPF ILD–versus–control pseudobulk analysis. (F) PROGENy pathway activity scores for the top 10 pathways across 6 T cell subsets in non-IPF ILD lungs, inferred by MLM from pseudobulk gene expression profiles; active pathways are shown in red and inactive pathways in blue.
Next, we analyzed T cell DEGs in non-IPF ILD subjects compared with control samples. We observed that DEGs were identified in all subsets of T cells in non-IPF ILD compared with controls, with the majority of DEGs being upregulated (like IPF) (Figure 2D). In addition to the finding of more DEGs in non-IPF ILD compared with IPF, the top 5 DEGs in non-IPF ILD subjects overlapped with but were not identical to those in IPF patients (Figure 2E). Importantly, upregulated pathways in CD4+ Tregs, CD56+ Tregs, CD4+ Tems, CD4+ Trms, CD8+ Trms, and NKT-like cells were different from those in IPF. Janus kinase and signal transducer and activator of transcription (JAK-STAT), TRAIL, and VEGF pathways were upregulated in all these T cell subsets in non-IPF ILD compared with controls (Figure 2F). Together, these results indicate important differences in the microenvironment of non-IPF ILD compared with IPF, driving different sets of disease-specific pathways in T cells.
Mapping lymphocyte spatial distribution in IPF lungs using tissue imaging. To determine the relationship between T cells and epithelial cells in IPF, we examined the distribution of T cell subsets in the lungs using CODEX-multiplexed tissue. Tissue microarray sections were generated from 2 distinct regions of paraffin-embedded lungs from 6 non-diseased controls and 6 IPF patients (Supplemental Table 1). A panel of 14 canonical and functional markers (Supplemental Table 3) was used to identify immune cell subsets, epithelial cells (pan-cytokeratin positive), and endothelial cells (CD31+). Among T cells, we identified CD4+ T cells (CD4+), regulatory T cells (Tregs; forkhead box P3–positive [FOXP3+] and CD56+ Tregs [CD56+FOXP3+]), CD8+ T cells (CD8+), and CD8+ GZMB+ T cells (Figure 3A). Quantification of T cell subsets revealed a significant increase in CD4+ T cells, Tregs, CD8+ T cells, and CD56+ Tregs in IPF compared with controls. We also observed that T cells were localized primarily in the alveolar interstitium of both control and IPF lungs, with many T cells found in proximity to the epithelium (Supplemental Figure 3). Then, we measured the distance between these different types of T cells and the nearest epithelial cells (cytokeratin positive). A cumulative distribution plot revealed that CD4+ T cells, CD8+ GZMB+ T cells, and Tregs were the populations closest to epithelial cells, whereas other CD8+ T cells and CD56+ Tregs were positioned at greater distances from epithelial cells (Figure 3B). To further understand the differences between Tregs and CD56+ Tregs, we calculated distances between all T cell populations and these two subsets of regulatory cells. Tregs were localized near all T cell subsets, whereas CD56+ Tregs were closer to CD8+ T cells and CD4+ Tregs (Figure 3B), suggesting that CD56+ Tregs may have more limited cellular interactions compared with conventional Tregs. Figure 3, C and D, shows a representative image of CD8+ GZMB+ T cells and their proximity to epithelial cells, and proximity of Tregs and CD56+ Tregs, in lung tissue from control and IPF donors. While conventional Tregs expressed FOXP3 exclusively in the intranuclear compartment, we observed that CD56+ Tregs exhibited cytoplasmic localization of the transcription factor FOXP3 (Figure 3D). These findings indicate that certain T cell subsets, including CD4+ T cells, CD8+ GZMB+ T cells, and Tregs, are in proximity to epithelial cells and may play a role in influencing epithelial cell functions, behavior, and survival in fibrosis.
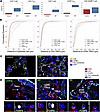 Figure 3
Spatial quantification of T cell subsets in control and IPF lungs by CODEX. (A) Cell types were annotated in QuPath as CD4+ T cells (CD4+), regulatory CD4+ T cells (Tregs; FOXP3+), CD8+ T cells (CD8+), cytotoxic CD8+ T cells (CD8+GZMB+), and CD56+ Tregs (CD56+FOXP3+). Box plots show normalized cell densities (cells/mm2) for each subset in control donors (n = 6) and IPF patients (n = 6); boxes indicate median and interquartile range, and points represent individual donors. Statistical significance was assessed using the Mann-Whitney U test (*P < 0.05). (B) Cumulative distribution of distances from each indicated T cell subset to the nearest epithelial cell in multiplexed spatial imaging of control and IPF lung tissues. (C) Representative CODEX images from lung tissue microarray sections showing CD8+GZMB+ T cells, stained for CD8 (green), granzyme B (GZMB; pink), pan-cytokeratin (white), and DAPI (blue). (D) Representative CODEX images from tissue microarray sections showing CD4+ Tregs and CD56+ Tregs, stained for CD56 (red), FOXP3 (white), CD4 (pink), pan-cytokeratin (aqua), and DAPI (dark blue). Scale bars: 10 μm.
Distribution of T cell subsets within distinct pathological niches. To further evaluate T cells in regions of the lung with active epithelial remodeling, we utilized our Xenium spatial transcriptomics dataset (26). This dataset includes samples from non-fibrotic control donors and IPF donors separated into areas of mild or severe fibrosis. Pathological evaluation of sections that underwent transcriptomic analysis noted key disease-associated features, such as epithelial remodeling, hyperplasia, and epithelial detachment. We analyzed 10 unaffected samples and 35 samples from donors with pulmonary fibrosis diagnoses (including 16 IPF), quantified the mean nearest-neighbor distance from T cells to alveolar and airway epithelial cell types, and compared T cell abundance between unaffected control tissue and IPF regions with mild versus severe fibrosis.
These analyses showed that T cells (CD4+, CD8+, NK/NKT) are located in proximity to alveolar epithelial cells (alveolar type 1 [AT1], AT2, and transitional AT2 cells) in both control and affected lungs, and are also found near secretory, multiciliated, and basal epithelial cells in fibrotic lungs (Figure 4A). Using cumulative distribution analyses, we quantified T cells within 50 μm of epithelial cells and found that T cell numbers were higher in severely fibrotic regions compared with unaffected regions (Figure 4B), supporting a role for T cells in disease progression. In addition, we determined the proportion of CD4+ T cells, CD8+ T cells, Tregs, and NK/NKT cells in areas with specific pathological features and identified increased CD4+ and CD8+ T cells and a reduction in NK/NKT cells in most diseased regions compared with normal alveoli (Figure 4C). Figure 4D shows a representative image of the distribution of different T cell subsets within regions assigned as fibroblastic foci and epithelial detachment in IPF, which are enriched for KRT5–KRT17+ (aberrant basaloid) cells (dashed lines represent a 50 μm distance from the central area). Thus, these results further support the concept that epithelial-lymphocyte interactions could contribute to fibrosis.
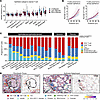 Figure 4
Spatial enrichment of T cell subsets in regions of epithelial abnormality and fibrosis. (A) Spatial transcriptomics analysis showing the median distance (micrometers) from each annotated epithelial cell subtype to the nearest T cell (CD3D/CD3E) in control (non-diseased) lung and in pulmonary fibrosis regions annotated as less affected or more affected. Each point represents one sample; box plots show the median and interquartile range across samples. (B) Cumulative mean number of CD4+, CD8+, Treg, NK/NKT, and proliferating T and NK/NKT cells located within 10–50 μm of alveolar or airway epithelial cells. Thin lines indicate individual samples and thick lines indicate group means. (C) Stacked bar plot showing the composition of T cells located inside and within 50 μm of representative normal and abnormal epithelial, immune, and fibrotic annotations. T cells within the range of multiple instances of the same annotation type were counted once. Fractions indicate the proportion of annotations of each type that contained T cells and were therefore included in the analysis. The dashed vertical line separates alveolar and airway epithelial annotation types. See Methods for full names of abbreviated annotation types. (D) Representative tissue annotations of fibroblastic foci and epithelial detachment showing the spatial distribution of T cell subsets within 50 μm of these structures. Adjacent panels show CD3E transcript expression in the same regions; solid lines denote the annotated regions and dashed rings indicate the approximately 50 μm perimeter. Scale bars: 50 μm.
Molecular drivers of cell-to-cell communications between T cells and epithelial cells. To investigate how T cell/epithelial cell crosstalk may influence pulmonary fibrosis, we analyzed single-cell RNA sequencing (scRNA-seq) data from CD45– (non-hematopoietic) and CD45+ (hematopoietic) lung cells generated from the same subjects who had undergone T cell CITE-seq analysis (23). The dataset was integrated using Harmony, resulting in 36 unsupervised clusters that we annotated as immune and structural cells, including lymphocytes; lymphatic, myeloid, epithelial, and basal cells; fibroblasts; and endothelial cells (Figure 5A). The lymphocyte cluster included CD4+, CD8+/NKT-like, and NK cells, and the epithelial cluster was composed of AT1, AT2, transitional AT2, and KRT5–KRT17+ cells and 3 subsets of secretory cells: SCGB1A1+MUC5+, SCGB1A1+SCGB3A2+, and SCGB3A2+. To identify the network of ligand-receptor pairs and the most common cell interactions between the different populations of T cells and epithelial cells, we used LIANA (ligand-receptor analysis framework) (31), a computational tool designed to identify interactions between secreted or cell membrane ligands and plasma membrane receptors across 2 different cells using multiomics data (Figure 5B). Additionally, we used Tensor-cell2cell analysis (32), an unsupervised method that generates matrices with communication scores for each ligand-receptor pair. This approach organizes the data into a 4-dimensional tensor structure, allowing for the simultaneous analysis of multiple samples or conditions (33). As a result, we generated 6 factor-specific networks representing cell-cell interactions among the epithelial and lymphocyte populations. Factors 1, 4, 5, and 6 revealed connections between different subsets of epithelial cells, while factors 2 and 3 highlighted interactions between lymphocytes and epithelial cells (Figure 5C). Focusing on factor 2, which shows signals from epithelial cells to lymphocytes, we observed that interactions between AT2 cells and T cell subsets were stronger than those between AT1 cells and T cells. Additionally, transitional AT2 cells and KRT5–KRT17+ cells showed strong interactions with both CD4+ and CD8+/NKT-like cells (Figure 5D). In factor 3 (signals from lymphocytes to epithelial cells), we observed robust communication between CD4+ and NK cells and KRT5–KRT17+ cells (Figure 5D). To determine specific ligand-receptor pairs in these interactions, we explored a bipartite network plot from factors 2 and 3 and identified the chemokine macrophage migration inhibitory factor (MIF), which is a ligand for CXCR4 and CD74 on T cells (Figure 5E). These interactions could be important for the recruitment and activation of T cells as well as macrophages (34, 35). Interactions among different epithelial cell populations are depicted in Supplemental Figure 4, A–D, and show a variety of ligand/receptor pairs, including adhesion molecules (ICAM1), members of the tissue inhibitor of metalloproteinases (TIMP) family, TGFβ, and MMP7, corroborating an intense tissue remodeling process. Transcripts for MIF were expressed especially by transitional AT2 and KRT5–KRT17+ epithelial cells (Supplemental Figure 4E). Epithelial cells also expressed varied levels of human leukocyte antigen (HLA) class I and II, indicating that these cells could function as antigen-presenting cells to both CD8+ and CD4+ T cells (Supplemental Figure 4E). Next, we quantified the proportion of MIF-positive and MIF-negative cells in AT2, transitional AT2, and KRT5–KRT17+ cells. These 3 populations were classified as MIF positive if at least one MIF mRNA transcript was detected. We observed that MIF-positive cells were abundant across all populations, but the proportion of MIF-positive cells was higher in the transitional AT2 and KRT5–KRT17+ cells (Figure 5F).
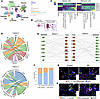 Figure 5
Cell-cell communication analysis of epithelial–T cell interactions in fibrotic lung. (A) UMAP of integrated whole-lung single-cell profiles from 224,404 cells isolated from 10 control lungs and 17 fibrotic ILD lungs. (B) Workflow schematic of ligand-receptor inference and tensor-based factorization to identify coordinated cell-cell interaction programs using LIANA and Tensor-cell2cell. Created with BioRender (biorender.com). (C) Heatmap summarizing sender and receiver cell populations participating in inferred interactions between the indicated T cell/NK subsets and epithelial populations based on LIANA and Tensor-cell2cell results. (D) Circos plot depicting epithelial–T cell relationships captured by interaction factors 2 and 3. (E) Bipartite network of significant ligand-receptor pairs associated with factor 2 (epithelial-to-T-cell signaling) and factor 3 (T-cell-to-epithelial signaling); nodes denote ligands and receptors, and edges represent interactions with weights greater than 0.005. (F) Stacked bar plot showing proportion of AT2, transitional AT2, and KRT5–KRT17+ cells classified as MIF positive (≥1 detected MIF transcript) or MIF negative (no detected MIF transcript) in all groups. Statistical significance was assessed using the Friedman test on per-library MIF-positive proportions, followed by post hoc paired Wilcoxon’s signed-rank tests (*P < 0.05). (G and H) Representative immunofluorescence images from lung tissue microarray sections (6 controls and 6 IPF): (G) MIF (red), pan-cytokeratin (green), and DAPI (dark blue); (H) CD3 (red), CXCR4 (white), pan-cytokeratin (green), and DAPI (dark blue). Scale bars: 100 μm.
An immunofluorescence staining assay for MIF and pan-cytokeratin (Figure 5G) or CD3, CXCR4, and pan-cytokeratin (Figure 5H) showed that MIF was found intracellularly in pan-cytokeratin–positive cells (epithelial cells). Moreover, CXCR4+ T cells were found to be abundant in the interstitium of IPF lungs. Together, these results indicate that epithelial cells may reshape the local immune environment by communicating with T cells via the MIF/CXCR4/CD74 axis. Because CXCR4/CD74 and EGFR signaling share several downstream intracellular signals and exhibit crosstalk mechanisms (36), we conclude that these receptors might engage in crosstalk during T cell activation in IPF. We examined expressions of EGFRs, CXCR4, and CD74 in T cell subsets using our CITE-seq analysis, which revealed that the average log expression of ERBB2 was lower compared with CXCR4 and CD74 (Supplemental Figure 5). However, we observed that ERBB2 was detected at high levels in a small group of cells in all populations, but in greater abundance in NKT-like cells. Therefore, the interplay between EGFR, CXCR4, and CD74 signaling pathways may represent a cooperative mechanism driving the activation and functions of several populations of T cells in fibrotic lungs.


