
Research ArticleGastroenterologyImmunologyInflammation
Open Access |  10.1172/jci.insight.204687
IL-13 and calpain-14 suppress the expression of SPINK7 by regulating OVOL1 in eosinophilic esophagitis
Nurit P. Azouz,1,2 Andrea M. Klingler,1 Sierra S. Beach,1 Kalen Rossey,1 Mark Rochman,1 Misu Paul,1 Julie M. Caldwell,1 Michael Brusilovsky,1 Alexander T. Dwyer,1 Xiaoting Chen,1,3 Daniel Miller,1,3 Carmy Forney,1,3 Leah C. Kottyan,1,2,3 Matthew T. Weirauch,1,3,4 and Marc E. Rothenberg1,2
1Division of Allergy and Immunology, Cincinnati Children’s Hospital Medical Center, Department of Pediatrics, University of Cincinnati College of Medicine, Cincinnati, Ohio, USA.
2Department of Pediatrics, University of Cincinnati College of Medicine, Cincinnati, Ohio, USA.
3Center for Autoimmune Genomics and Etiology, and
4Divisions of Human Genetics, Biomedical Informatics, and Developmental Biology, Cincinnati Children’s Hospital Medical Center, University of Cincinnati College of Medicine, Cincinnati, Ohio, USA.
Address correspondence to: Marc E. Rothenberg or Nurit Azouz, Division of Allergy and Immunology, Cincinnati Children’s Hospital Medical Center, 240 Albert Sabin Way, Cincinnati, Ohio 45229, USA. Phone: 1.513.307.6768; Email: marc.rothenberg@cchmc.org (MER). Phone: 1.513.803.0985; Email: Nurit.Azouz@cchmc.org (NA).
Find articles by
Azouz, N.
in:
PubMed
|
Google Scholar
|

1Division of Allergy and Immunology, Cincinnati Children’s Hospital Medical Center, Department of Pediatrics, University of Cincinnati College of Medicine, Cincinnati, Ohio, USA.
2Department of Pediatrics, University of Cincinnati College of Medicine, Cincinnati, Ohio, USA.
3Center for Autoimmune Genomics and Etiology, and
4Divisions of Human Genetics, Biomedical Informatics, and Developmental Biology, Cincinnati Children’s Hospital Medical Center, University of Cincinnati College of Medicine, Cincinnati, Ohio, USA.
Address correspondence to: Marc E. Rothenberg or Nurit Azouz, Division of Allergy and Immunology, Cincinnati Children’s Hospital Medical Center, 240 Albert Sabin Way, Cincinnati, Ohio 45229, USA. Phone: 1.513.307.6768; Email: marc.rothenberg@cchmc.org (MER). Phone: 1.513.803.0985; Email: Nurit.Azouz@cchmc.org (NA).
Find articles by Klingler, A. in: PubMed | Google Scholar
1Division of Allergy and Immunology, Cincinnati Children’s Hospital Medical Center, Department of Pediatrics, University of Cincinnati College of Medicine, Cincinnati, Ohio, USA.
2Department of Pediatrics, University of Cincinnati College of Medicine, Cincinnati, Ohio, USA.
3Center for Autoimmune Genomics and Etiology, and
4Divisions of Human Genetics, Biomedical Informatics, and Developmental Biology, Cincinnati Children’s Hospital Medical Center, University of Cincinnati College of Medicine, Cincinnati, Ohio, USA.
Address correspondence to: Marc E. Rothenberg or Nurit Azouz, Division of Allergy and Immunology, Cincinnati Children’s Hospital Medical Center, 240 Albert Sabin Way, Cincinnati, Ohio 45229, USA. Phone: 1.513.307.6768; Email: marc.rothenberg@cchmc.org (MER). Phone: 1.513.803.0985; Email: Nurit.Azouz@cchmc.org (NA).
Find articles by Beach, S. in: PubMed | Google Scholar
1Division of Allergy and Immunology, Cincinnati Children’s Hospital Medical Center, Department of Pediatrics, University of Cincinnati College of Medicine, Cincinnati, Ohio, USA.
2Department of Pediatrics, University of Cincinnati College of Medicine, Cincinnati, Ohio, USA.
3Center for Autoimmune Genomics and Etiology, and
4Divisions of Human Genetics, Biomedical Informatics, and Developmental Biology, Cincinnati Children’s Hospital Medical Center, University of Cincinnati College of Medicine, Cincinnati, Ohio, USA.
Address correspondence to: Marc E. Rothenberg or Nurit Azouz, Division of Allergy and Immunology, Cincinnati Children’s Hospital Medical Center, 240 Albert Sabin Way, Cincinnati, Ohio 45229, USA. Phone: 1.513.307.6768; Email: marc.rothenberg@cchmc.org (MER). Phone: 1.513.803.0985; Email: Nurit.Azouz@cchmc.org (NA).
Find articles by Rossey, K. in: PubMed | Google Scholar
1Division of Allergy and Immunology, Cincinnati Children’s Hospital Medical Center, Department of Pediatrics, University of Cincinnati College of Medicine, Cincinnati, Ohio, USA.
2Department of Pediatrics, University of Cincinnati College of Medicine, Cincinnati, Ohio, USA.
3Center for Autoimmune Genomics and Etiology, and
4Divisions of Human Genetics, Biomedical Informatics, and Developmental Biology, Cincinnati Children’s Hospital Medical Center, University of Cincinnati College of Medicine, Cincinnati, Ohio, USA.
Address correspondence to: Marc E. Rothenberg or Nurit Azouz, Division of Allergy and Immunology, Cincinnati Children’s Hospital Medical Center, 240 Albert Sabin Way, Cincinnati, Ohio 45229, USA. Phone: 1.513.307.6768; Email: marc.rothenberg@cchmc.org (MER). Phone: 1.513.803.0985; Email: Nurit.Azouz@cchmc.org (NA).
Find articles by
Rochman, M.
in:
PubMed
|
Google Scholar
|
1Division of Allergy and Immunology, Cincinnati Children’s Hospital Medical Center, Department of Pediatrics, University of Cincinnati College of Medicine, Cincinnati, Ohio, USA.
2Department of Pediatrics, University of Cincinnati College of Medicine, Cincinnati, Ohio, USA.
3Center for Autoimmune Genomics and Etiology, and
4Divisions of Human Genetics, Biomedical Informatics, and Developmental Biology, Cincinnati Children’s Hospital Medical Center, University of Cincinnati College of Medicine, Cincinnati, Ohio, USA.
Address correspondence to: Marc E. Rothenberg or Nurit Azouz, Division of Allergy and Immunology, Cincinnati Children’s Hospital Medical Center, 240 Albert Sabin Way, Cincinnati, Ohio 45229, USA. Phone: 1.513.307.6768; Email: marc.rothenberg@cchmc.org (MER). Phone: 1.513.803.0985; Email: Nurit.Azouz@cchmc.org (NA).
Find articles by Paul, M. in: PubMed | Google Scholar
1Division of Allergy and Immunology, Cincinnati Children’s Hospital Medical Center, Department of Pediatrics, University of Cincinnati College of Medicine, Cincinnati, Ohio, USA.
2Department of Pediatrics, University of Cincinnati College of Medicine, Cincinnati, Ohio, USA.
3Center for Autoimmune Genomics and Etiology, and
4Divisions of Human Genetics, Biomedical Informatics, and Developmental Biology, Cincinnati Children’s Hospital Medical Center, University of Cincinnati College of Medicine, Cincinnati, Ohio, USA.
Address correspondence to: Marc E. Rothenberg or Nurit Azouz, Division of Allergy and Immunology, Cincinnati Children’s Hospital Medical Center, 240 Albert Sabin Way, Cincinnati, Ohio 45229, USA. Phone: 1.513.307.6768; Email: marc.rothenberg@cchmc.org (MER). Phone: 1.513.803.0985; Email: Nurit.Azouz@cchmc.org (NA).
Find articles by
Caldwell, J.
in:
PubMed
|
Google Scholar
|
1Division of Allergy and Immunology, Cincinnati Children’s Hospital Medical Center, Department of Pediatrics, University of Cincinnati College of Medicine, Cincinnati, Ohio, USA.
2Department of Pediatrics, University of Cincinnati College of Medicine, Cincinnati, Ohio, USA.
3Center for Autoimmune Genomics and Etiology, and
4Divisions of Human Genetics, Biomedical Informatics, and Developmental Biology, Cincinnati Children’s Hospital Medical Center, University of Cincinnati College of Medicine, Cincinnati, Ohio, USA.
Address correspondence to: Marc E. Rothenberg or Nurit Azouz, Division of Allergy and Immunology, Cincinnati Children’s Hospital Medical Center, 240 Albert Sabin Way, Cincinnati, Ohio 45229, USA. Phone: 1.513.307.6768; Email: marc.rothenberg@cchmc.org (MER). Phone: 1.513.803.0985; Email: Nurit.Azouz@cchmc.org (NA).
Find articles by Brusilovsky, M. in: PubMed | Google Scholar
1Division of Allergy and Immunology, Cincinnati Children’s Hospital Medical Center, Department of Pediatrics, University of Cincinnati College of Medicine, Cincinnati, Ohio, USA.
2Department of Pediatrics, University of Cincinnati College of Medicine, Cincinnati, Ohio, USA.
3Center for Autoimmune Genomics and Etiology, and
4Divisions of Human Genetics, Biomedical Informatics, and Developmental Biology, Cincinnati Children’s Hospital Medical Center, University of Cincinnati College of Medicine, Cincinnati, Ohio, USA.
Address correspondence to: Marc E. Rothenberg or Nurit Azouz, Division of Allergy and Immunology, Cincinnati Children’s Hospital Medical Center, 240 Albert Sabin Way, Cincinnati, Ohio 45229, USA. Phone: 1.513.307.6768; Email: marc.rothenberg@cchmc.org (MER). Phone: 1.513.803.0985; Email: Nurit.Azouz@cchmc.org (NA).
Find articles by Dwyer, A. in: PubMed | Google Scholar
1Division of Allergy and Immunology, Cincinnati Children’s Hospital Medical Center, Department of Pediatrics, University of Cincinnati College of Medicine, Cincinnati, Ohio, USA.
2Department of Pediatrics, University of Cincinnati College of Medicine, Cincinnati, Ohio, USA.
3Center for Autoimmune Genomics and Etiology, and
4Divisions of Human Genetics, Biomedical Informatics, and Developmental Biology, Cincinnati Children’s Hospital Medical Center, University of Cincinnati College of Medicine, Cincinnati, Ohio, USA.
Address correspondence to: Marc E. Rothenberg or Nurit Azouz, Division of Allergy and Immunology, Cincinnati Children’s Hospital Medical Center, 240 Albert Sabin Way, Cincinnati, Ohio 45229, USA. Phone: 1.513.307.6768; Email: marc.rothenberg@cchmc.org (MER). Phone: 1.513.803.0985; Email: Nurit.Azouz@cchmc.org (NA).
Find articles by Chen, X. in: PubMed | Google Scholar
1Division of Allergy and Immunology, Cincinnati Children’s Hospital Medical Center, Department of Pediatrics, University of Cincinnati College of Medicine, Cincinnati, Ohio, USA.
2Department of Pediatrics, University of Cincinnati College of Medicine, Cincinnati, Ohio, USA.
3Center for Autoimmune Genomics and Etiology, and
4Divisions of Human Genetics, Biomedical Informatics, and Developmental Biology, Cincinnati Children’s Hospital Medical Center, University of Cincinnati College of Medicine, Cincinnati, Ohio, USA.
Address correspondence to: Marc E. Rothenberg or Nurit Azouz, Division of Allergy and Immunology, Cincinnati Children’s Hospital Medical Center, 240 Albert Sabin Way, Cincinnati, Ohio 45229, USA. Phone: 1.513.307.6768; Email: marc.rothenberg@cchmc.org (MER). Phone: 1.513.803.0985; Email: Nurit.Azouz@cchmc.org (NA).
Find articles by Miller, D. in: PubMed | Google Scholar
1Division of Allergy and Immunology, Cincinnati Children’s Hospital Medical Center, Department of Pediatrics, University of Cincinnati College of Medicine, Cincinnati, Ohio, USA.
2Department of Pediatrics, University of Cincinnati College of Medicine, Cincinnati, Ohio, USA.
3Center for Autoimmune Genomics and Etiology, and
4Divisions of Human Genetics, Biomedical Informatics, and Developmental Biology, Cincinnati Children’s Hospital Medical Center, University of Cincinnati College of Medicine, Cincinnati, Ohio, USA.
Address correspondence to: Marc E. Rothenberg or Nurit Azouz, Division of Allergy and Immunology, Cincinnati Children’s Hospital Medical Center, 240 Albert Sabin Way, Cincinnati, Ohio 45229, USA. Phone: 1.513.307.6768; Email: marc.rothenberg@cchmc.org (MER). Phone: 1.513.803.0985; Email: Nurit.Azouz@cchmc.org (NA).
Find articles by Forney, C. in: PubMed | Google Scholar
1Division of Allergy and Immunology, Cincinnati Children’s Hospital Medical Center, Department of Pediatrics, University of Cincinnati College of Medicine, Cincinnati, Ohio, USA.
2Department of Pediatrics, University of Cincinnati College of Medicine, Cincinnati, Ohio, USA.
3Center for Autoimmune Genomics and Etiology, and
4Divisions of Human Genetics, Biomedical Informatics, and Developmental Biology, Cincinnati Children’s Hospital Medical Center, University of Cincinnati College of Medicine, Cincinnati, Ohio, USA.
Address correspondence to: Marc E. Rothenberg or Nurit Azouz, Division of Allergy and Immunology, Cincinnati Children’s Hospital Medical Center, 240 Albert Sabin Way, Cincinnati, Ohio 45229, USA. Phone: 1.513.307.6768; Email: marc.rothenberg@cchmc.org (MER). Phone: 1.513.803.0985; Email: Nurit.Azouz@cchmc.org (NA).
Find articles by
Kottyan, L.
in:
PubMed
|
Google Scholar
|
1Division of Allergy and Immunology, Cincinnati Children’s Hospital Medical Center, Department of Pediatrics, University of Cincinnati College of Medicine, Cincinnati, Ohio, USA.
2Department of Pediatrics, University of Cincinnati College of Medicine, Cincinnati, Ohio, USA.
3Center for Autoimmune Genomics and Etiology, and
4Divisions of Human Genetics, Biomedical Informatics, and Developmental Biology, Cincinnati Children’s Hospital Medical Center, University of Cincinnati College of Medicine, Cincinnati, Ohio, USA.
Address correspondence to: Marc E. Rothenberg or Nurit Azouz, Division of Allergy and Immunology, Cincinnati Children’s Hospital Medical Center, 240 Albert Sabin Way, Cincinnati, Ohio 45229, USA. Phone: 1.513.307.6768; Email: marc.rothenberg@cchmc.org (MER). Phone: 1.513.803.0985; Email: Nurit.Azouz@cchmc.org (NA).
Find articles by Weirauch, M. in: PubMed | Google Scholar
1Division of Allergy and Immunology, Cincinnati Children’s Hospital Medical Center, Department of Pediatrics, University of Cincinnati College of Medicine, Cincinnati, Ohio, USA.
2Department of Pediatrics, University of Cincinnati College of Medicine, Cincinnati, Ohio, USA.
3Center for Autoimmune Genomics and Etiology, and
4Divisions of Human Genetics, Biomedical Informatics, and Developmental Biology, Cincinnati Children’s Hospital Medical Center, University of Cincinnati College of Medicine, Cincinnati, Ohio, USA.
Address correspondence to: Marc E. Rothenberg or Nurit Azouz, Division of Allergy and Immunology, Cincinnati Children’s Hospital Medical Center, 240 Albert Sabin Way, Cincinnati, Ohio 45229, USA. Phone: 1.513.307.6768; Email: marc.rothenberg@cchmc.org (MER). Phone: 1.513.803.0985; Email: Nurit.Azouz@cchmc.org (NA).
Find articles by
Rothenberg, M.
in:
PubMed
|
Google Scholar
|
Published April 28, 2026 - More info
JCI Insight. 2026;11(12):e204687. https://doi.org/10.1172/jci.insight.204687.
© 2026 Azouz et al. This work is licensed under the Creative Commons Attribution 4.0 International License. To view a copy of this license, visit http://creativecommons.org/licenses/by/4.0/.
Received: January 23, 2026; Accepted: April 23, 2026


-
Results
SPINK7 expression is induced during epithelial differentiation. We analyzed SPINK7 expression in cultures of esophageal epithelial progenitor cells (EPC2 cells) under conditions that promote cellular differentiation, namely high confluency and high calcium. SPINK7 expression was more strongly induced under high-confluency conditions compared with low-confluency conditions (Figure 1A). SPINK7 expression was further increased under high-calcium (1.8 mM) conditions compared with low-calcium conditions in high confluency conditions (0.09 mM; Figure 1A). Epigenetic analysis of the SPINK7 promoter region of EPC2 cells revealed an increase in H3K27 acetylation marks in the region surrounding SPINK7 transcription start site (TSS) in high-confluency conditions compared with low-confluency conditions (Figure 1B). The highest levels for the K27 acetylation mark were observed in cells that were grown in high confluency and high calcium (1.8 mM; Figure 1B). These findings indicate that SPINK7 is expressed during esophageal epithelial cell differentiation; we indeed observe this spatial expression of SPINK7 in differentiated cell clusters based on single-cell RNA-seq data from human esophageal biopsies (24). This analysis demonstrated that, out of 13 identified epithelial cells clusters, SPINK7 is mostly expressed in 3 epithelial clusters together with differentiation markers including FLG, MUC22, and SPRR1A (Figure 1C).
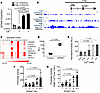 Figure 1
SPINK7 expression as a function of calcium and cell confluency. (A) Quantitative polymerase chain reaction (qPCR) of SPINK7 expression in EPC2 in cells. (B) CHIP peaks H3K27Ac in the promoter region of SPINK7 in EPC2 cells in the indicated conditions. (C) Heatmap depicting the relative expression of the indicated genes in epithelial clusters on the basis of single-cell RNA-seq data of dispersed cells from esophageal control biopsies. (D) Promoter activity in cells grown in high calcium and high confluency, cotransfected with either nano-luciferase (nLUC) vector containing the SPINK7 promoter (SPINK7) or a promoterless nLUC vector and with firefly vector to control for transfection efficiency (Control), presented as relative luminescence units (RLU). (E) Promoter activity in cells cotransfected with SPINK7-nLUC that were grown in the indicated concentrations of CaCl2 and normalized to cells cotransfected with nLUC and firefly vector. (F) Promoter activity in cells that were grown in 1.8 mM of CaCl2 and cotransfected with nLUC constructs that contain either 0, 1, 2, 3, 4, or 4.5 kb of the SPINK7 promoter sequence and firefly vector. (G) Promoter activity in cells cotransfected with nLUC constructs, containing either 0, 1, 2, 3, 4, or 4.5 kb of the SPINK7 promoter sequence and firefly vector, and grown in either 0.09 or 1.8 mM of CaCl2. The values of the 1.8 mM of CaCl2 lysates were divided to the values of the cells cultured in 0.09 mM of CaCl2. P values were calculated by 1-way ANOVA.
Identification of the SPINK7 promoter region. After identifying the regulatory region in the 4.5 kb 5′ region flanking the SPINK7 TSS using transcriptional and epigenetic data (Figure 1B), we tested the activity of this putative promoter. EPC2 cells were grown at high-confluency and high-calcium (1.8 mM) conditions to induce cell differentiation. Then, cells transiently transfected with a reporter construct containing the presumed promoter region (the 4.5 kb 5′ region flanking the SPINK7 TSS, referred to henceforth as SPINK7) or a control vector. The SPINK7-transfected cells had a mean approximately 340-fold increase in luminescence signal compared with cells transfected with the control vector (P < 0.0001; Figure 1D). Calcium ions increased promoter activity in a dose-dependent manner and reached a plateau at 1.8 mM of calcium (Figure 1E). No difference was observed in the control vector activity in different calcium concentrations (Supplemental Figure 1A; supplemental material available online with this article; https://doi.org/10.1172/jci.insight.204687DS1). These collective data indicate that this regulatory region of the SPINK7 gene has calcium-dependent promoter activity.
We subsequently determined the minimal sequence required for promoter activity. We generated reporter constructs containing the presumed promoter region (with either 4.5, 4, 3, 2, and 1 kb 5′ region flanking the SPINK7 TSS). The promoter activity of all reporter constructs was sufficient to drive at least some activity (Figure 1F) compared with the control construct. The luciferase activity of the cells transfected with the 4.5 kb and 4 kb constructs increased by 3-fold and 2-fold, respectively, compared with the luciferase activity of the cells that were transfected with the 1 kb construct (P = 0.0004 and P = 0.0001, respectively; Figure 1F). The luciferase activity of the cells transfected with the 3 kb and 2 kb constructs was not different than the luciferase activity of the cells transfected with the 1 kb construct (Figure 1F). In low-calcium conditions, low-promoter activity was observed in all the constructs, with no difference between the 1 kb and the 4.5 kb or 4 kb constructs (Supplemental Figure 1B). For the 4.5 kb and 4 kb constructs, luciferase activities were increased by 7-fold and 4-fold, respectively, in the high-calcium compared with the low-calcium media (P = 0.05 and P = 0.0003, respectively; Figure 1G). The 3 kb, 2 kb, and 1 kb constructs were not affected by high calcium (Figure 1G). These collective data suggest that induction of cellular differentiation (i.e., high-calcium and high-confluency conditions) promotes SPINK7 promoter activity via the 4.5 kb region upstream of the SPINK7 TSS and, more specifically, through the 3–4.5 kb.
The TF OVOL1 binds to SPINK7 promoter region. We next asked which TFs regulate SPINK7 promoter activity. Analysis of the SPINK7 promoter using TF binding motifs obtained from the CisBP database (build 1.02) (25) revealed several TFs that are predicted to bind the SPINK7 promoter. We narrowed this list of TFs to 36 by intersecting with genes that are induced during esophageal epithelial differentiation (as previously reported by us; ref. 11) or with esophageal-specific genes or with genes that are dysregulated in patients with EoE compared with control patients (Supplemental Table 1). We transiently overexpressed 4 resulting candidate TFs that may regulate SPINK7 expression (i.e., OVOL1, VDR, POU2F3, and PRDM1). Overexpression of VDR (in the presence or absence of the VDR ligand calcipotriol), POU2F3, and PRDM1 did not increase SPINK7 promoter activity (Figure 2A). In contrast, overexpression of OVOL1 increased SPINK7 promoter activity by 2.4-fold (P = 0.0006; Figure 2A). As a control, Western blot analysis confirmed that OVOL1 protein was overexpressed in the OVOL1-transfected cells compared with control cells (Supplemental Figure 2A).
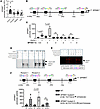 Figure 2
OVOL1 binding to the SPINK7 promoter region. (A) Nano-luciferase activity in lysates from cells transfected with SPINK7 promoter, firefly plasmid, and plasmids encoding for the indicated transcription factors normalized to control lysates from cells transfected with SPINK7 promoter, firefly plasmid, and an empty plasmid. (B) Analysis of the proximal human SPINK7 promoter sequence identified 4 potential OVOL1 binding sites. Transcription Start Site +1. (C) Nano-luciferase activity in lysates cotransfected with either OVOL1 or a control plasmid and with SPINK7 promoter deletion constructs. (D) Representative results from EMSA experiments using recombinant human OVOL1 protein. (E) Representative results from EMSA experiment using nuclear extracts from HEK-293T cells transfected with OVOL1 plasmid or a control plasmid. Cold competitors were added in concentrations of 1×, 2×, and 5× compared with the fluorescent probe (presented as 1, 2, and 5). (F) Nano-luciferase activity in lysates cotransfected with OVOL1 or a control plasmid (UT) and with the SPINK7 promoter with either mutated OVOL1 binding site 1 or mutated OVOL1 binding site 2 or WT SPINK7 promoter. Cells were either left untreated or treated with FICZ (1 μM). P values were calculated by 1-way ANOVA.
OVOL1 binds to the SPINK7 promoter and activates SPINK7 expression. We then examined whether SPINK7 is a direct OVOL1 target gene in esophageal epithelial cells. We predicted 4 OVOL1 binding sites upstream of the SPINK7 TSS (Figure 2B). We tested the requirement of this response by examining SPINK7 promoter activity in the presence or absence of OVOL1 overexpression (Figure 2B). Overexpression of OVOL1 induced promoter activity in cells that were transfected with the 4 kb and 4.5 kb constructs, with similar promoter activity (Figure 2C). In contrast, the promoter activity of cells that were transfected with the 3 kb, 2 kb, or 1 kb SPINK7 constructs were not affected by OVOL1 overexpression (Figure 2C).
We analyzed the binding of recombinant human OVOL1 protein to a fluorescent DNA probe corresponding to the –4139, –3379, –2078, and –208 regions of the SPINK7 promoter by Electrophoretic Mobility-Shift Assay (EMSA). OVOL1 shifted the mobility of the fluorescent probe in all probes, except the –3379 probe (Figure 2D). Unlabeled (cold) WT competitors that contain the predicted binding site at –4139, –2078, and –208 bp inhibited the mobility shift (Figure 2D). A mutant cold competitor that contains the predicted binding site at –4139 bp (GTGGCAC) failed to inhibit the mobility shift (Figure 2D). In addition, the administration of a rabbit anti–human OVOL1 antibody resulted in a supershift of the –2078 probe. To examine the possibility that additional cellular cofactors are required for the binding of OVOL1, we generated nuclear extracts of HEK-293T cells overexpressing OVOL1. The nuclear extracts shifted the –3379 probe, whereas the cold WT probe inhibited the shifted band in a dose-dependent manner (Figure 2E). A mutant cold competitor that contains the predicted binding site at –3379 bp (CAGTGGAAA) failed to inhibit the mobility shift (Figure 2E).
We tested the specificity of this response in 2 predicted OVOL1 binding sites that affected the SPINK7-nLUC activity when absent from the promoter region (Figure 2C). We constructed mutants in these predicted OVOL1 binding sites and assessed SPINK7-nLUC promoter reporter construct activation (Figure 2F). SPINK7-nLUC activation was decreased for the OVOL1 binding site mutant at –3379 bp when the ACTGTTCCC sequence was replaced with CAGTGGAAA (Figure 2F). In contrast, there was no effect on SPINK7-nLUC activation for the OVOL1 binding site mutant at –4139 bp when the TGTTACA sequence was replaced with GTGGCAC (Figure 2F). These collective data suggest that OVOL1 binds to all 4 sites in the SPINK7 promoter and that the –3379 bp region of the SPINK7 TSS is important for OVOL1-dependent gene expression. Additionally, our data suggest possible involvement of other cofactors regulating the OVOL1-mediated SPINK7 expression.
Loss of OVOL1 promotes impaired barrier function and TSLP production. We examined the consequences of depleting OVOL1 expression in EPC2 cells by stable transduction with a vector expressing either shRNA targeting OVOL1 or nonsilencing control (NSC) shRNA. OVOL1-silenced cells had more than 2-fold reduction in OVOL1 mRNA levels compared with NSC control (Figure 3A and Supplemental Figure 2B). OVOL1-silenced cells that were differentiated in air-liquid interface (ALI) culture system had a 3-fold decrease in SPINK7 expression compared with that of differentiated NSC-treated cells (Figure 3B). OVOL1-silenced cells had increased TSLP release compared with NSC-treated cells after Poly(I:C) stimulation (Figure 3C). This is consistent with the phenotype of SPINK7-depleted cells, which were previously demonstrated to produce increased TSLP upon Poly(I:C) stimulation (11). OVOL1 silenced cells displayed barrier impairment as assessed by decreased trans epithelial electrical resistance (TEER; Figure 3D). These data suggest that OVOL1 expression is critical for maintaining SPINK7 expression, barrier integrity, and controlling TSLP production by epithelial cells.
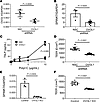 Figure 3
Effect of Loss of OVOL1 on barrier function and TSLP production. (A) qPCR analysis of OVOL1 expression from NSC- treated and OVOL1-silenced EPC2 cells. (B) qPCR analysis of SPINK7 expression from NSC-treated and OVOL1-silenced EPC2 cells at day 14 of ALI differentiation. (C) TSLP release from NSC- treated and OVOL1-silenced EPC2 cells that were grown in high-calcium media for 64 hours and then stimulated for 8 hours with the indicated concentrations of polyinosinic-polycytidylic acid (Poly(I:C)). Cell supernatants were assessed for TSLP levels from 3 independent experiments. Data are the mean ± SD. (D) TEER (Ω/cm2) measurement from NSC-treated, OVOL1-silenced EPC2 cells at day 7 of ALI differentiation. Data are the mean ± SD from 3 independent experiments performed in triplicate. (E) qPCR analysis of SPINK7 expression from CRISPR/Cas9 OVOL1-KO and control EPC2 cells at day 14 of ALI differentiation. (F) TEER (Ω/cm2) measurement from OVOL1 KO and control EPC2 cells at day 7 of ALI differentiation. Data are the mean ± SD from 3 independent experiments performed in triplicate. All P values were calculated by Student’s t test (unpaired, 2-tailed).
We subsequently generated OVOL1-KO cells using CRISPR/Cas9 genomic editing (Supplemental Figure 3, A and B). OVOL1 protein expression was undetected in OVOL1-KO cells compared with control cells (Supplemental Figure 3C). OVOL1-KO cells that were differentiated in ALI culture had a 10-fold decrease in SPINK7 expression compared with that of differentiated control EPC2 cells (P = 0.0004; Figure 3E) and had barrier impairment as assessed by decreased TEER (Figure 3F).
OVOL1 protein expression is lost in EoE. Analysis of OVOL1 mRNA expression did not reveal any difference between EoE biopsies and controls (Figure 4A and Supplemental Table 1). However, when analyzing OVOL1 protein expression in esophageal biopsies, we noted that OVOL1 intracellular localization changed by epithelial compartment. In the differentiating cells closer to the basal membrane, OVOL1 localization was nuclear; whereas, in the differentiated epithelium (the layers of epithelium near the lumen), OVOL1 localization was nonnuclear (Figure 4B). Analysis of OVOL1 protein expression revealed a decrease in protein expression in EoE compared with control biopsies (Figure 4C). Western blot analysis of OVOL1 showed that OVOL1 protein expression was decreased by 10-fold in esophageal biopsies from patients with EoE compared with control patients (Figure 4D). Notably, a higher molecular band of OVOL1 (50 kDa) remained evident in control and EoE biopsies (Supplemental Figure 4A). These collective data suggest that the OVOL1 protein is deficient in the esophagus of patients with EoE compared with control individuals.
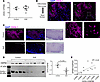 Figure 4
Expression of OVOL1 in EoE biopsies. (A) Expression of OVOL1 mRNA in EoE biopsies compared with control biopsies. (B) Representative image of immunofluorescence staining of OVOL1 (pink) and DAPI (blue) staining in control biopsy. White line separates the lumen from the epithelium; the lumen side is marked by the letter “L.” Scale bar: 20 µm. (C) Representative images of H&E and immunofluorescence staining of OVOL1 (pink) and DAPI (blue) staining in control and EoE biopsies. White line separates the lumen from the epithelium, and the lumen side is marked by the letter “L.” Scale bar: 30 µm. (D) Western blot analysis of OVOL1 expression in control and EoE biopsies. The graph on the right shows the OVOL1 expression relative to HSP90. (E) Linear regression of OVOL1 protein expression and SPINK7 mRNA expression from 12 esophageal biopsies (6 patients with EoE and 6 control patients). R2 and P were calculated via sample correlation coefficient and F-test, using GraphPad prism.
OVOL1 correlates with SPINK7 expression in esophageal biopsies. Having demonstrated that OVOL1 protein is lost in EoE and that OVOL1 directly binds to SPINK7 promoter, we hypothesized that the level of OVOL1 protein in esophageal biopsies would be correlated with SPINK7 mRNA expression. From 12 biopsies (n = 6 EoE; n = 6 controls), we isolated the RNA fraction and the protein fraction and measured the mRNA expression of SPINK7 and the protein expression of OVOL1 (Figure 4E). This analysis demonstrated a positive correlation (P = 0.019) between SPINK7 mRNA and OVOL1 protein expression (Figure 4E and Supplemental Figure 4B).
IL-13 and IL-4 inhibit OVOL1 activation. We aimed to determine the effect of IL-4 and IL-13, Th2 cytokines with established roles in atopic diseases, including EoE (8, 26, 27), on OVOL1. First, we investigated the subcellular localization of OVOL1. In unstimulated cells that overexpress OVOL1, OVOL1 was primarily localized to cytoplasmic organelles that bordered the membranal protein desmoglein 1 (DSG1) (Figure 5A). It has been demonstrated that the aryl hydrocarbon receptor (AHR) ligand, 6-Formylindolo[3,2-b]carbazole [FICZ], promotes the translocation of OVOL1 to the cells’ nuclei in keratinocytes (28). FICZ stimulation induced nuclear mobilization of OVOL1, whereas IL-4 or IL-13 stimulations prevented the FICZ-induced OVOL1 mobilization to the nucleus in OVOL1-overexpressing cells (Figure 5A). Consistently with OVOL1 nuclear localization, FICZ induced the promoter activity of SPINK7, while IL-4 and IL-13 decreased SPINK7 promoter activity in OVOL1-overexpressing cells (Figure 5, B and C). Because cells that were differentiated in ALI culture express high endogenous levels of OVOL1, we analyzed the effect of IL-4 and IL-13 on differentiated cells. In unstimulated differentiated cells, OVOL1 was mostly nuclear (Figure 5D). IL-4 or IL-13 stimulation promoted the exit of OVOL1 from the nucleus and decreased OVOL1 expression (Figure 5D and Supplemental Video 1–3). Next, we analyzed the effect of IL-13 on SPINK7 endogenous expression. FICZ stimulation increased endogenous SPINK7 expression (Figure 5E), and IL-13 decreased SPINK7 expression when the cells were stimulated with FICZ (Figure 5E). As a control for FICZ and IL-13 stimulation, their 2 target genes CYP1A1 and CCL26 expression were also examined and show the expected increases when used alone (Figure 5, F and G). Interestingly, FICZ stimulation was able to decrease the IL-13–dependent CCL26 expression by 2.7-fold (P < 0.0001; Figure 5G).
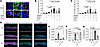 Figure 5
Effect of IL-13 and IL-4 on OVOL1-dependent SPINK7 expression. (A) Representative images of coimmunofluorescence of desmoglein1 (DSG1, green), OVOL1 (pink), and DAPI (blue) stain in OVOL1-overexpressing EPC2 cells that were either left untreated (UT) or treated over night with IL-4 or IL-13 (100 ng/mL) with or without FICZ (1 μm). Scale bar: 5 μm. Promoter activity in lysates triple-transfected with firefly vector and either SPINK7-nLUC or nLUC and either OVOL1 or a control plasmid. (B and C) Cells were either left untreated or treated with 1 μm FICZ, with or without IL-4 (B) or IL-13 (C). (D) Representative images of coimmunofluorescence of DSG1 (pink), OVOL1 (cyan), and DAPI (blue) stain in cells that were differentiated in the ALI model. Cells were either left untreated or treated with IL-4 or IL-13 (100 ng/mL), or IL-4 (100 ng/mL) with FICZ (1 μm). Scale bar: 10 μm. (E–G) mRNA expression of SPINK7 (E), CYP1A1 (F), or CCL26 (G) normalized to GADPH in a monolayer of EPC2 cells that were either left untreated or stimulated with IL-13 (100 ng/mL) and/or FICZ (1 μm). P values were calculated by one-way ANOVA test.
IL-13–induced CAPN14 expression depletes OVOL1 protein expression. Because IL-13 is a major driver of epithelial transcriptional changes, we asked if IL-13 regulates OVOL1 expression. IL-13 stimulation in EPC2 cells differentiated by ALI culture decreased OVOL1 protein expression by an average of 10-fold (P = 0.02; Figure 6A). Notably, the decreased OVOL1 expression in the ALI culture system contrasts with the cytoplasmic localization observed in a monolayer of EPC2 following overexpression of OVOL1 and IL-13 stimulation (Figure 5A). We suggest that the differential OVOL1 phenotypes between these 2 model systems is likely to be due to the difference between analyzing the endogenous OVOL1 (Figure 6A) and analyzing exogenous OVOL1 that is under constitutive promoter regulation and is constantly generated by the cells (Figure 6A). As a positive control for IL-13 stimulation, DSG1 protein expression decreased by approximately 20% in IL-13 stimulated ALI cultures compared with untreated ALI cultures (P = 0.01; Figure 6A). In contrast, OVOL1 mRNA expression was unchanged between IL-13–stimulated and control cells (Figure 6B). Consistent with the protein level, DSG1 mRNA decreased in IL-13–stimulated compared with untreated cells (P = 0.018; Figure 6B). These data demonstrate that IL-13 inhibited the nuclear retention of OVOL1 and loss of OVOL1 outside of the nucleus, whereas a nuclear shift of OVOL1 may enable protein stability.
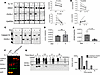 Figure 6
Posttranslational modification of OVOL1 induced by IL-13. (A) Western blot analysis of OVOL1, DSG1, and GAPDH expression in differentiated EPC2 cells that were either left untreated (UT) or stimulated with IL-13 (100 ng/mL) for 48 hours. The graphs on the right show quantification of OVOL1 and DSG1 relative to GAPDH with or without IL-13 treatment from paired UT/IL-13 samples from 6 independent experiments. P values were calculated by paired Student’s t test. (B) qPCR analysis of OVOL1 and DSG1 mRNA expression in differentiated EPC2 cells that were either left untreated or stimulated with IL-13 (100 ng/mL) for 48 hours; expression is normalized to GAPDH. P values were calculated by paired Student’s t test. (C) Western blot analysis of OVOL1 and calpain 14 expression in differentiated EPC2 cells with inducible expression of CAPN14 expression. CAPN14 is fused to a flag tag and is induced by doxycycline (Dox) treatment. (D and E) qPCR analysis of OVOL1 (D) and SPINK7 (E) in differentiated EPC2 with inducible expression of CAPN14 expression of CAPN14; expression is normalized to GAPDH. P values were calculated by unpaired Student’s t test. (F) Western blot analysis of OVOL1 in GFP-overexpressing or CAPN14-GFP–overexpressing cells with or without IL-13 treatment. GAPDH was used as a loading control. Anti-GFP was used for detection of GFP and CAPN14-GFP. (G) Western blot analysis of recombinant human OVOL1-GST (60 ng) that was either left untreated or incubated with nonnuclear protein fractions (C) or nuclear protein fractions (N) for the indicated times. The graph on the right is a quantification of OVOL1 band intensity (OD) shown from the left. UT, untreated.
The EoE transcriptome is enriched for proteases and has an imbalance between proteases and protease inhibitors, favoring a proteolytic state (11, 29, 30). Single-cell RNA-seq analysis that was previously performed by us (31) revealed that CAPN14 and OVOL1 are coexpressed in the same epithelial cluster in the esophagus (Figure 1C). The epithelial clusters that coexpressed OVOL1 and CAPN14 were enriched for SPINK7 and corresponded to cells that express differentiation markers (i.e., FLG, MUC22) and esophageal enriched genes (i.e., MUC22, MAL, KLK13; Figure 1C). The expressions of CAPN14 and OVOL1 were highly correlated across cells (r = 0.92; Spearman correlation). These findings prompted us to hypothesize that calpain-14 may be involved in OVOL1 posttranscriptional regulation. Notably, CAPN14 is an esophagus-specific protease, encoded by the CAPN14 gene, which is located in a strong EoE-associated risk locus (i.e., 2p23) (15, 32). CAPN14 is transcriptionally induced by IL-13 and has been shown to regulate epithelial barrier homeostasis and repair (10, 15). Inducible CAPN14 expression in differentiated esophageal epithelial cells revealed a marked reduction in OVOL1 protein (Figure 6C). In contrast to OVOL1 protein, OVOL1 mRNA expression was not affected by inducible CAPN14 expression (Figure 6D). Induction of CAPN14 expression decreased SPINK7 expression by 3.5-fold (P = 0.03; Figure 6E). In addition, constitutive expression of CAPN14-GFP decreased the expression of OVOL1 compared with that of control GFP vector transduction (Figure 6F), indicating that the reduction in OVOL1 protein expression resulted from CAPN14 expression and not as a result of doxycycline treatment. Consistently, IL-13 treatment further decreased OVOL1 expression in the CAPN14-GFP–overexpressing cells (Figure 6F). We then incubated recombinant OVOL1 protein with either nonnuclear or nuclear extracts; OVOL1 protein degraded more quickly when incubated with nonnuclear proteins compared with nuclear proteins (Figure 6G). These results indicate that OVOL1 is likely degraded outside of the nucleus and remains relatively stable in the nucleus. We therefore suggest that nuclear mobilization of OVOL1 protects OVOL1, whereas IL-13–mediated retention of OVOL1 outside of the cell nuclei, which consequently promotes degradation of OVOL1 by intracellular proteases, such as calpain-14. Accordingly, we incubated recombinant OVOL1 protein with cytosolic or nuclear extracts; OVOL1 protein degraded more quickly with incubation with nonnuclear proteins compared with nuclear proteins (Figure 6G).


