Research ArticleAgingCell biology
Open Access |

10.1172/jci.insight.207890
1Aging Institute and
2Department of Cell Biology, University of Pittsburgh School of Medicine, Pittsburgh, Pennsylvania, USA.
Address for correspondence. Toren Finkel, Aging Institute, University of Pittsburgh School of Medicine, 100 Technology Drive, Pittsburgh, Pennsylvania 15239, USA. Email: finkelt@pitt.edu.
Find articles by Cheng, Y. in: PubMed | Google Scholar
1Aging Institute and
2Department of Cell Biology, University of Pittsburgh School of Medicine, Pittsburgh, Pennsylvania, USA.
Address for correspondence. Toren Finkel, Aging Institute, University of Pittsburgh School of Medicine, 100 Technology Drive, Pittsburgh, Pennsylvania 15239, USA. Email: finkelt@pitt.edu.
Find articles by Gao, M. in: PubMed | Google Scholar
1Aging Institute and
2Department of Cell Biology, University of Pittsburgh School of Medicine, Pittsburgh, Pennsylvania, USA.
Address for correspondence. Toren Finkel, Aging Institute, University of Pittsburgh School of Medicine, 100 Technology Drive, Pittsburgh, Pennsylvania 15239, USA. Email: finkelt@pitt.edu.
Find articles by Tan, J. in: PubMed | Google Scholar
1Aging Institute and
2Department of Cell Biology, University of Pittsburgh School of Medicine, Pittsburgh, Pennsylvania, USA.
Address for correspondence. Toren Finkel, Aging Institute, University of Pittsburgh School of Medicine, 100 Technology Drive, Pittsburgh, Pennsylvania 15239, USA. Email: finkelt@pitt.edu.
Find articles by Liu, J. in: PubMed | Google Scholar
1Aging Institute and
2Department of Cell Biology, University of Pittsburgh School of Medicine, Pittsburgh, Pennsylvania, USA.
Address for correspondence. Toren Finkel, Aging Institute, University of Pittsburgh School of Medicine, 100 Technology Drive, Pittsburgh, Pennsylvania 15239, USA. Email: finkelt@pitt.edu.
Find articles by Finkel, T. in: PubMed | Google Scholar
Published November 9, 2026 - More info
Cellular senescence, a hallmark of aging, is accompanied by a striking expansion of the cell’s lysosomal compartment, yet the pathway leading to increased lysosomal content remains unresolved. Here, we demonstrate that the master lysosomal transcriptional regulator TFEB is activated during senescence through a pathway that involves conjugation of ATG8 onto single membranes (CASM). Using various senescence inducers, we show that senescence induction triggers robust TFEB nuclear translocation and upregulation of TFEB target genes. In contrast, inhibition of the core CASM machinery by CRISPR-mediated deletion of either ATG16L1, ATG12, or ATG5 markedly reduced senescence-induced TFEB nuclear translocation. In ATG16L1-KO cells, reconstitution with WT ATG16L1 but not the CASM-defective ATG16L1F467A mutant restored both ATG8 lipidation on the lysosomal surface and TFEB activation. Moreover, expression of the Salmonella effector protein SopF, a previously described specific CASM inhibitor, similarly blocked senescence-induced TFEB translocation. Functionally, upon stress, CASM-deficient cells exhibited a pronounced shift away from senescence and toward a cell death fate, a phenotype reversed by expressing a constitutively active form of TFEB. Together, these findings identify CASM-dependent TFEB activation as an essential mechanism enabling senescence-associated lysosomal expansion and suggest that lysosomal capacity modulates cell fate decisions in the aftermath of acute stress.
Cellular senescence is a stress-responsive program that induces stable cell cycle arrest in response to cellular damage (1). Although senescence has essential physiological functions during development and is beneficial in suppressing cancer, the accumulation of senescent cells in aging tissues is believed to be detrimental (2). Recognized as a hallmark of aging, understanding the mechanisms that maintain senescent cells has become a priority for developing senolytic strategies aimed at promoting healthy aging (3).
A notable cellular morphological change observed during senescence is the expansion of the lysosomal compartment, marked by an increase in both the number and size of lysosomes (4). This distinctive feature is evidenced by increased senescence-associated β-galactosidase (SA-β-gal) activity, along with the accumulation of the autofluorescent pigment lipofuscin, within senescent lysosomes (5, 6). Growing evidence suggests that these lysosomal changes are potentially important functional adaptations for senescent cells (7, 8). Consistent with this, the transcription factor EB (TFEB), a master regulator of lysosome biogenesis, has been shown to translocate to the nucleus during senescence and, hence, increase its transcriptional activity (9, 10).
Lysosomes are single-membrane organelles crucial for regulating cellular metabolism and maintaining protein quality control (11). The acidic lumen within these organelles hosts an array of enzymes, including proteases, lipases, and nucleases, which play crucial roles in facilitating the breakdown of macromolecules delivered through endocytosis or autophagy (11, 12). By recycling long-lived proteins and other cellular components into biosynthetic precursors, lysosomes provide a nutrient reservoir that supports survival under metabolic stress (13). In addition to being the central hub for degradation, lysosomes also serve as platforms for nutrient sensing through mammalian target of rapamycin complex 1 (mTORC1) signaling, and as noted, their biogenesis is controlled by TFEB dependent transcription (14, 15).
Classically, TFEB activity is regulated by mTORC1, which phosphorylates TFEB under nutrient-rich conditions, keeping TFEB inactive and retained in the cytosol. Upon conditions such as starvation, mTORC1 becomes globally inactivated, allowing TFEB to be dephosphorylated, facilitating its nuclear translocation, and inducing the expression of lysosomal and autophagy genes (16–18). However, several studies have reported that mTORC1 remains active during senescence (19–21), raising a mechanistic question as to precisely how TFEB is regulated during senescence.
A growing body of work identifies noncanonical autophagy or conjugation of ATG8 on single membranes (CASM) as an alternative pathway for TFEB activation (22, 23). CASM involves the lipidation of the ATG8 family of proteins, including LC3A, LC3B, LC3C, GABARAP, GABARAPL1, and GABARAPL2 on single-membrane organelles such as the lysosome, macropinosomes, late endosomes, and phagosomes (24, 25). Importantly, CASM on lysosomes has been shown to promote TFEB activation under certain conditions without suppressing mTORC1 activity toward its canonical substrates (22, 23, 26). In particular, conjugated lysosomal ATG8 is believed to bind and sequester the FLCN–FNIP1/2 complex, which normally activates RagC on the lysosomal surface. CASM therefore inhibits RagC, in turn, releasing TFEB from the lysosomal membrane and facilitating its nuclear translocation and capacity for lysosomal biogenesis. Whether CASM regulates TFEB during senescence, however, has not been explored.
Here, we show that genetic disruption of CASM components prevents ATG8 conjugation on lysosomes, blocks TFEB nuclear translocation, and abrogates lysosomal expansion during senescence. Upon stress, CASM inhibition shifts cell fate from senescence toward cell death. This CASM-deficient increase in cell death can be rescued by constitutive TFEB activation. Together, our findings identify CASM as a central upstream regulator of TFEB activity during senescence and reveal a mechanistic pathway in which lysosome-localized CASM drives TFEB activation and lysosomal expansion to determine whether stressed cells proceed toward cell death or senescence.
TFEB is activated during senescence. To study how TFEB is regulated during senescence, we first established a senescence model using the respiratory epithelial cell line BEAS-2B cells and 3 mechanistically distinct inducers: doxorubicin (DOX), bleomycin (Bleo), and hydrogen peroxide (H2O2). Each inducer elicited the hallmark features of cellular senescence, including a marked increase in SA-β-gal activity, a pronounced reduction in proliferation as assessed by EdU incorporation, and transcriptional upregulation of the senescence-associated secretory phenotype (SASP) genes IL6, IL8, IL1A, and CXCL1 (Supplemental Figure 1, A–E; supplemental material available online with this article; https://doi.org/10.1172/jci.insight.207890DS1). Having established this senescence model, we next assessed whether TFEB indeed translocates to the nucleus and becomes activated during senescence. Using lentivirus transduction, we stably expressed TFEB-EGFP in BEAS-2B cells to visualize its localization in cells. Prior to senescence induction with DOX, TFEB-EGFP fluorescence was predominantly cytosolic. However, after treatment with DOX, we observed a marked increase in the nuclear TFEB-EGFP signal (Figure 1, A and B). A similar nuclear translocation of TFEB was seen when senescence was induced using either Bleo or H2O2 (Supplemental Figure 1, F and H). Consistent with TFEB nuclear translocation, we also observed a decrease in the ratio of phosphorylated TFEB to total TFEB (p-TFEB/TFEB) in senescent cells (Figure 1C), consistent with activation of TFEB upon senescence induction (27, 28). To determine whether this nuclear translocation corresponded to TFEB transcriptional activation, we assessed the expression of established TFEB target genes (ULK1, ATG9A, ATP6V1E1, and CTSA). Within 24 hours of senescence induction, all 4 target genes were upregulated by approximately 1.4- to 3.7-fold compared with untreated controls (Figure 1D). Together, these data demonstrate that TFEB translocates from the cytosol to the nucleus and becomes transcriptionally active during senescence induction.
Figure 1TFEB translocates to the nucleus and is activated during senescence. (A) Fluorescence imaging of BEAS-2B cells expressing TFEB–EGFP showing TFEB subcellular localization on Day 0 (basal, untreated), Day 3, and Day 6 after senescence induction with 100 nM DOX. Scale bar: 10 μm. Images are representative of n = 3 independent experiments. (B) Quantification of cells with nuclear TFEB on the indicated days after senescence induction with 100 nM DOX. Data are mean ± SD from 3 independent experiments (≥30 cells per replicate).(C) Immunoblot analysis of the levels of phosphorylated TFEB (p-TFEB) and total TFEB in BEAS-2B cells on Day 0 (untreated), Day 3, and Day 6 after senescence induction with 100 nM DOX. Blots are representative of n = 3 independent experiments. (D) qPCR analysis of TFEB target gene expression (ULK1, ATG9A, ATP6V1E1, and CTSA) in BEAS-2B cells on Day 0 (untreated) and Day 1 after senescence induction with 100 nM DOX. Bar graphs show fold change (mean ± SD) relative to untreated controls. Statistical significance for each gene was determined by a 2-tailed unpaired t test with Welch’s correction. **P < 0.01, ****P < 0.0001.
CASM regulates TFEB activation during senescence. Given that TFEB is classically regulated by mTORC1 signaling, we next asked whether TFEB activation during senescence is accompanied by a global repression of canonical mTORC1 signaling. Upon mTORC1 activation, mTORC1 phosphorylates downstream targets such as p70 S6 kinase (S6K) and 4EBP1 (29). Thus, to assess mTORC1 activity following senescence induction, we examined the ratio of phosphorylated p70 S6K (p-S6K) to total p70 S6K in untreated versus senescent BEAS-2B cells. Western blot analysis revealed no appreciable change in the p-S6K/S6K ratio upon DOX-induced senescence, indicating that mTORC1 activity toward its best-known canonical substrate is not markedly altered during senescence (Figure 2, A and B).
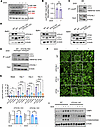
Figure 2TFEB activation during senescence occurs independently of canonical mTORC1 signaling and instead requires the CASM machinery. (A) Immunoblot triplicate analysis of p70 S6 kinase (S6K) and phospho-S6K (p-S6K) in WT BEAS-2B cells on Day 0 (untreated) and Day 3 after senescence induction with 100 nM DOX (dox). (B) Quantification of the p-S6K/S6K ratio. Data are mean ± SD of 3 independent experiments; significance by a ratio paired t test. (C) LysoIP immunoblot of LC3-II from control or senescent (Day 3) BEAS-2B cells expressing TMEM192-3xHA. β-Actin and ATG16L1 serve as loading controls. (D) Immunoblot analysis of LC3 in ATG16L1-, ATG12-, and ATG5-KO BEAS-2B cells ± 200 nM bafilomycin A1 for 24 h; β-actin is loading control. (E) Lyso-IP for WT and ATG16L1-KO cells. Blots are representative of n = 3 independent experiments. (F) Fluorescence imaging of TFEB–EGFP in WT and KO cells on Day 0 and Day 3 after dox. Boxed areas were selected for amplified view (third column). Arrows indicate nuclear TFEB localization. Scale bar: 32 μm. Images are representative of n = 3 independent experiments. (G) Quantification of cells with nuclear TFEB. Mean ± SD from 3 independent experiments (≥30 cells per replicate); statistical significance determined by one-way ANOVA followed by Dunnett’s multiple-comparison test against WT. (H) qPCR of TFEB transcriptional targets, ATP6V1E1 and CTSA, in ATG16L1-KO cells at baseline and Day 1 after dox (+), plotted as fold change (mean ± SD) relative to untreated controls. Statistical significance determined by a 2-tailed unpaired t test with Welch’s correction. See Figure 1D for a similar analysis of WT cells. (I) Immunoblot triplicate analysis of lysosomal LAMP1, cathepsin B, and β-galactosidase in WT or ATG16L1-KO cells on Day 0 and Day 3 after dox. β-Actin is the loading control. ***P < 0.001, ****P < 0.0001; ns, not significant.
Recent evidence suggests that, under certain circumstances, CASM regulates TFEB activation by modulating the accessibility of TFEB to the lysosome-associated mTORC1 complex (17, 27), thereby specifically influencing TFEB phosphorylation status without necessarily suppressing global mTORC1 activity (22, 23). To ascertain whether this pathway was relevant in senescence, we initially asked whether ATG8 conjugation on lysosomes increased in senescent cells. We used LysoIP, an established method for rapidly immunopurifying intact lysosomes, to compare LC3-II enrichment between untreated and senescent BEAS-2B cells (30). Lysosomes immunopurified from senescent cells displayed a clear increase in LC3-II levels relative to lysosomes from untreated cells (Figure 2C), consistent with CASM activity increasing during senescence.
ATG8 lipidation on either double membranes (canonical macroautophagy) or single membranes (noncanonical autophagy or CASM) requires the assembly of the ATG16L1-ATG12-ATG5 complex (25). We therefore disrupted CASM by generating independent CRISPR-edited KO cells for ATG16L1, ATG12, or ATG5 in BEAS-2B cells. Western blot analysis confirmed loss of each protein, and functional assessment using the V-ATPase inhibitor bafilomycin A1 verified that ATG8 lipidation was effectively blocked in these CASM-deficient cells. As expected, bafilomycin A1 treatment induced LC3-II accumulation in WT cells, whereas ATG16L1-, ATG12-, and ATG5-deficient cells showed no LC3-II increase, confirming loss of ATG8 conjugation activity in each of these CASM-deficient cells (Figure 2D). Consistent with this, LysoIP performed on ATG16L1-KO cells revealed an absence of LC3 enrichment on lysosomes under both basal and senescent conditions (Figure 2E).
We next determined whether CASM is required for TFEB activation during senescence. TFEB-EGFP was stably expressed in each KO line, and TFEB localization was assessed before and after senescence induction. Disruption of the ATG16L1-ATG12-ATG5 complex markedly reduced TFEB nuclear translocation compared with WT cells after inducing senescence with DOX (Figure 2, F and G) or with other inducers (Supplemental Figure 1, G and H). Immunofluorescence staining of endogenous TFEB recapitulated this result, with senescence-induced nuclear translocation markedly reduced in ATG16L1-, ATG12-, and ATG5-KO cells relative to WT cells (Supplemental Figure 2A). Moreover, analysis of the same TFEB target genes assessed in WT cells (Figure 1D) demonstrated that ATG16L1-KO cells had impaired senescence-induced TFEB transcriptional activity (Figure 2H). Consistent with impaired TFEB activation, senescence-associated lysosomal expansion was also disrupted in CASM-deficient cells, as evident by reduced expression of the lysosomal proteins LAMP1, cathepsin B, and β-galactosidase in senescent WT versus ATG16L1-KO cells (Figure 2I). Together, these results establish that the CASM machinery is essential for TFEB nuclear translocation, transcriptional activation, and the associated expansion of the lysosomal compartment during senescence.
TFEB activation during senescence requires CASM but not canonical macroautophagy. The ATG16L1-ATG12-ATG5 machinery required for senescence-associated TFEB activation is required for both CASM and macroautophagy. To distinguish between these 2 processes, we leveraged the previously described CASM-defective ATG16L1 effector mutant (ATG16L1F467A). Although the ATG16L1-ATG12-ATG5 complex mediates ATG8 lipidation in both canonical and noncanonical autophagy, the mechanisms slightly differ: conjugation of ATG8 to double membranes during canonical macroautophagy requires the FIP200 binding domain (FBD), whereas CASM relies on the C-terminal WD40 domain of ATG16L1 (31). The F467A point mutation disrupts this WD40 domain, selectively impairing CASM while preserving the canonical macroautophagy function of ATG16L1 (32).
Reconstitution of ATG16L1WT in ATG16L1-KO cells restored LC3-II accumulation on lysosomes during senescence (Figure 3, A and B), confirming functional rescue of CASM activity. Furthermore, ATG16L1WT reconstitution restored TFEB nuclear translocation to levels comparable with WT cells (Figure 3, C and D). In contrast, reconstitution with ATG16L1F467A failed to restore LC3 conjugation on lysosomes (Figure 3, A and B) and could not rescue TFEB nuclear translocation upon senescence induction (Figure 3, C and D). Immunofluorescence staining of endogenous TFEB confirmed this pattern, with nuclear translocation restored by reconstitution with ATG16L1WT but not with the CASM-defective ATG16L1F467A (Supplemental Figure 2B). In parallel, SA-β-gal positivity following senescence induction was restored in ATG16L1-KO cells reconstituted with ATG16L1WT but not in cells reconstituted with the CASM-deficient ATG16L1F467A (Supplemental Figure 2C). Together, these results suggest that CASM, rather than canonical macroautophagy, is the critical driver of TFEB activation during senescence.
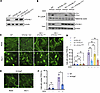
Figure 3Blocking CASM inhibits TFEB nuclear translocation and transcriptional activation during senescence. (A) Immunoblot analysis of ATG16L1 in WT, ATG16L1-KO, and ATG16L1-KO BEAS-2B cells reconstituted with either ATG16L1WT or the CASM-defective ATG16L1F467A. (B) Immunoblot analysis of control or senescent (Day 3 after senescence induction) WT, ATG16L1-KO, or ATG16L1-KO cells reconstituted with either ATG16L1WT or ATG16L1F467A BEAS-2B cells expressing lysosomal TMEM192 3xHA. Levels of LC3 (LC3-II) on lysosomes purified via LysoIP using the HA epitope were assessed. Whole-cell β-actin and ATG16L1 levels serve as lysate loading controls. Blots are representative of n = 3 independent experiments. (C) Fluorescence imaging of WT, ATG16L1-KO, ATG16L1-KO reconstituted with ATG16L1WT, and ATG16L1-KO reconstituted with ATG16L1F467A cells expressing TFEB-EGFP showing TFEB subcellular localization on Day 0 (untreated) and Day 3 after senescence induction with 100 nM DOX. Scale bar: 32 μm. Images are representative of n = 4 independent experiments. (D) Quantification of nuclear TFEB+ cells. Data are mean ± SD from 3 independent experiments (≥30 cells per replicate); statistical significance was determined by 1-way ANOVA followed by Šídák’s multiple-comparison test on the prespecified comparisons of interest. (E) Fluorescence imaging of V5-SopF–expressing BEAS-2B cells expressing TFEB-EGFP on Day 0 and Day 3 after senescence induction with 100 nM DOX. Scale bar: 32 μm. Images are representative of n = 4 independent experiments. (F) Quantification of cells with nuclear TFEB in WT cells or SopF expressing cells at baseline and 3 days after senescence induction. Data are mean ± SD from 3 independent experiments (≥30 cells per replicate); statistical significance was determined by a 2-tailed unpaired t test with Welch’s correction. *P < 0.05, **P < 0.01, ***P < 0.001; ns, not significant.
To further validate the specific role of CASM in regulating TFEB during senescence, we complemented our genetic loss-of-function models with an independent strategy. Salmonella outer protein F (SopF) is a Salmonella effector protein that has been reported to specifically block CASM by disrupting the interaction between the V-ATPase and ATG16L1 (33). We stably expressed V5 tagged-SopF in WT BEAS-2B cells (Supplemental Figure 3A) and, analogous to our KO data, demonstrated that SopF expression impaired CASM activity, as evidenced by minimal LC3-II association with lysosomes (Supplemental Figure 3B). Importantly, SopF expression also inhibited TFEB nuclear translocation upon senescence induction (Figure 3, E and F). These findings demonstrate that inhibition of CASM by either genetic disruption or a pathogen-derived effector protein similarly inhibits senescence-associated TFEB activation, thus further supporting CASM as an essential regulator of TFEB activation during senescence.
Finally, to further exclude a role for canonical macroautophagy in TFEB regulation during senescence, we generated ATG13-KO cells. ATG13 is an essential component of the upstream macroautophagy initiation complex but is dispensable for CASM (34, 35). As expected, loss of ATG13 (Supplemental Figure 4A) did not impair CASM activity, as LC3-II enrichment on lysosomes during senescence remained intact (Supplemental Figure 4B). Moreover, ATG13-KO cells exhibited TFEB nuclear translocation upon senescence induction at levels comparable with WT cells (Supplemental Figure 4, C and D). Together, these findings reinforce that CASM, rather than canonical macroautophagy, drives TFEB activation during senescence.
CASM regulates the cell fate decision between senescence and cell death. Since a previous study has shown that shRNA-mediated depletion of TFEB leads to cell death upon senescence induction (9), we reasoned that CASM inhibition, by preventing TFEB activation, should similarly shift cell fate from senescence toward cell death. We therefore sought to determine the functional consequence of blocking CASM following senescence induction. While we observed no proliferation or viability defect in CASM-deficient cells under normal growth conditions, we routinely observed an apparent increase in cell death in the days following a senescence-inducing stress. To more formally assess this, we quantified cell death by annexin V/propidium iodide (PI) staining and flow cytometry in ATG16L1-, ATG12-, and ATG5-deficient cells prior to and 3 days after senescence induction. While KO cells exhibited no increase in cell death levels before senescence induction, all 3 CASM-deficient lines displayed significantly increased cell death 3 days after DOX treatment (Figure 4, A and B). These findings were corroborated by an orthogonal caspase-3/7 activity assay, which likewise showed elevated caspase-3/7 activity in each CASM-deficient line following senescence induction (Supplemental Figure 5A). Importantly, this phenotype appeared specific to senescence-associated stress, as treatment with the apoptotic inducer staurosporine resulted in comparable levels of cell death between WT and CASM-deficient cells (Figure 4C).
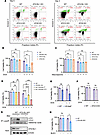
Figure 4Blocking CASM shifts the cell fate decision from senescence to cell death. (A) Cell death analysis by annexin V/propidium iodide (PI) staining and flow cytometry of WT and CASM-deficient KO BEAS-2B cells before and 3 days after senescence induction with 100 nM DOX. Flow cytometry plots are representative of n = 3 independent experiments. (B) Quantification of viability in WT and CASM-deficient knockout cells before and after senescence induction. Mean ± SD; statistical significance was determined by 1-way ANOVA followed by Dunnett’s multiple-comparison test against WT. (C) Quantification of viability in WT and CASM-deficient KO cells before and after 100 nM staurosporine treatment. Mean ± SD; statistical significance was determined by 1-way ANOVA followed by Dunnett’s multiple-comparison test against WT. (D) Quantification of viability in WT, ATG16L1-KO, or ATG16L1-KO cells reconstituted with ATG16L1WT or CASM-defective ATG16L1F467A. Data are mean ± SD; significance by 1-way ANOVA with Šídák’s multiple-comparison test on the prespecified comparisons of interest. (E) Quantification of viability in WT and SopF-expressing BEAS-2B cells before and 3 days after senescence induction. Data are mean ± SD; statistical significance was determined by a 2-tailed unpaired t test with Welch’s correction. (F) Quantification of viability in WT and ATG13-KO BEAS-2B cells before and 3 days after senescence induction. Data are mean ± SD; statistical significance was determined by a 2-tailed unpaired t test with Welch’s correction. (G) LysoIP immunoblot of LC3-II from control or senescent (Day 3) WT and ATG16L1-KO BJ fibroblasts expressing TMEM192-3xHA. β-Actin and ATG16L1 serve as loading controls. Blots are representative of n = 3 independent experiments. (H) Quantification of viability in WT and ATG16L1-KO BJ fibroblasts before and 3 days after senescence induction with 5 μM Bleo. Data are mean ± SD; significance by 2-tailed unpaired t test with Welch’s correction. *P < 0.05, **P < 0.01, ***P < 0.001, ****P < 0.0001; ns, not significant.
We next assessed whether restoring CASM machinery could rescue this phenotype. Reconstitution of ATG16L1-KO cells with ATG16L1WT substantially reduced cell death to WT levels, whereas reconstitution with the CASM defective ATG16L1F467A mutant failed to rescue this cell-death phenotype (Figure 4D). Caspase activity measurements corroborated these findings (Supplemental Figure 5A). Similarly, expression of SopF, which also blocks CASM, resulted in significantly increased cell death following senescence induction (Figure 4E). In contrast, ATG13-KO cells, which lack canonical autophagy function but retain CASM activity, were indistinguishable from WT cells in their level of cell death following a senescence-inducing stress (Figure 4F).
To determine whether this phenotype was cell-type–specific or dependent on the mechanism of senescence induction, we CRISPR-edited ATG16L1 in human BJ fibroblasts and induced senescence using Bleo. Similar to our observations in BEAS-2B cells, ATG16L1-deficient BJ cells exhibited significantly less TFEB nuclear translocation (Supplemental Figure 6, A and B), reduced senescence-associated LC3-II lysosomal accumulation, and a higher proportion of cell death after senescence induction compared with their WT counterparts (Figure 4, G and H). Collectively, these data demonstrate that CASM modulates the cell’s decision between cell death or senescence following an acute stress.
To determine whether TFEB could bypass the requirement for CASM during senescence, we expressed a constitutively active TFEB mutant (TFEBS142A) in ATG16L1-KO cells. Ser142 is a known phosphorylation site whose modification promotes TFEB nuclear export; substitution with alanine renders TFEB persistently nuclear and active (27, 36, 37). We first asked whether TFEBS142A expression could restore lysosomal biogenesis in CASM-deficient cells. Western blot analysis showed that senescence-induced upregulation of the lysosomal proteins LAMP1, cathepsin B, and β-galactosidase, which was blunted in ATG16L1-KO cells, was restored in ATG16L1-KO cells expressing TFEBS142A (Figure 5A). Thus, enforced TFEB activation is sufficient to drive lysosomal expansion during senescence in the absence of an intact CASM machinery.
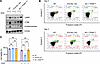
Figure 5A role for TFEB and lysosomal capacity in senescent cell fate decisions. (A) Immunoblot analysis of lysosomal expansion in WT, ATG16L1-KO, or ATG16L1-KO + TFEBS142A cells on Day 0 (untreated) and Day 3 after senescence induction with 100 nM DOX using LAMP1/ cathepsin B/β-galactosidase expression as markers of lysosomal content. β-Actin is used as a loading control. Blots are representative of n = 3 independent experiments. (B and C) Cell death analysis and viability quantification of WT, ATG16L1-KO cells, and ATG16L1-KO BEAS-2B cells expressing constitutively active TFEBS142A before and 3 days after senescence induction with 100 nM doxorubicin. Flow cytometry plots in B are representative of n = 4 independent experiments. In C, data are mean ± SD; statistical significance was determined by 1-way ANOVA followed by Dunnett’s multiple-comparison test against WT. ***P < 0.001; ns, not significant.
Expression of TFEBS142A in ATG16L1-KO cells also resulted in levels of cell death 3 days after senescence induction that were comparable with WT cells (Figure 5, B and C), a rescue independently confirmed by caspase activity assays (Supplemental Figure 7A), indicating that enforced TFEB activation rescues the cell death propensity of CASM-deficient cells. Consistent with an increase in cell death, ATG16L1-KO cells exhibited fewer numbers of surviving senescent cells 6 days after senescence induction (Supplemental Figure 7B). Again, this reduction in senescent cell number was rescued by TFEBS142A expression (Supplemental Figure 7B). Importantly, this rescue was also accompanied by a restoration of SA-β-gal positivity, which was severely blunted in ATG16L1-KO cells relative to WT cells, but was significantly increased by TFEBS142A expression (Supplemental Figure 7C). This rescue was not restricted to a single senescence-inducing stress. ATG16L1-KO cells exhibited a blunted upregulation of LAMP1, cathepsin B, and β-gal following Bleo exposure, while lysosomal biogenesis was restored by TFEBS142A expression (Supplemental Figure 8A). Similar effects were seen with Bleo-induced cell death (Supplemental Figure 8B). These findings demonstrate that CASM-dependent, TFEB-driven lysosomal biogenesis and expansion are essential for supporting the senescent cell fate.
Our results identify CASM as the essential upstream machinery required for TFEB activation during senescence, resolving the paradox of TFEB activation despite seemingly persistent canonical mTORC1 activity in senescent cells (19–21). Our findings demonstrate that CASM, specifically on lysosomes, promotes TFEB nuclear translocation, lysosomal biogenesis, and lysosomal expansion, which are processes likely essential for cells to survive the metabolic and proteostatic stress associated with senescence.
An increase in SA-β-gal activity has long been recognized as one of the hallmarks of senescent cells (5, 38–40). This increase in enzymatic activity reflects the expansion of the lysosomal compartment, as SA-β-gal activity corresponds to the endogenous lysosomal β-galactosidase operating at a suboptimal pH rather than a senescence-specific enzyme (41). Beyond increased lysosomal mass, senescent cells undergo substantial remodeling of lysosomal physiology, including altered membrane composition, lysosomal membrane permeabilization, and pH neutralization (42). These drastic changes raise the important question of whether lysosomal changes are simply byproducts of the senescence program or whether lysosomes play an active, regulatory role in establishing and maintaining the senescent state.
Recent work has expanded our understanding of lysosomes as dynamic regulators of cellular fate rather than merely passive waste disposal organelles. We recently proposed the lysosomal processing and adaptation system (LYPAS) as a helpful conceptual framework to describe how cells dynamically adapt their lysosomal capacity in response to diverse types of cellular stress (7). Under this model, various cellular insults, including those associated with senescence induction (e.g., DNA damage, oxidative stress, etc.), result in the upregulation of LYPAS, which includes both TFEB-dependent lysosomal biogenesis, and repair and adaptive signaling pathways, to help maintain cellular homeostasis and survival. However, if the stress exceeds the capacity of LYPAS this imbalance can eventually push the cell toward cell death.
Characterized as one of the key components of LYPAS, lysosomal biogenesis through TFEB is increasingly recognized as a key determinant of the senescent program. Our observations on TFEB activation and lysosomal capacity as a determinant of survival are consistent with previous observations (9). However, the upstream regulators of TFEB activation during senescence-inducing conditions remain unclear. Here, we show that senescence-associated TFEB activation does not rely on global mTORC1 suppression or on macroautophagy, but instead on lysosomal CASM. This positions CASM as a key regulatory switch that determines whether stressed cells undergo immediate cell death or proceed to a durable senescent state.
Studies have demonstrated that TFEB activation is not governed by a single linear pathway but instead occurs through multiple mechanistically distinct regulatory modes that are engaged depending on the nature and intensity of cellular stress. In particular, a recent report demonstrated that lysosomal stress promotes TFEB activation through both ATG conjugation–dependent and independent mechanisms that differentially influence TFEB phosphorylation and localization (43). Importantly, our results demonstrate that disruption of the ATG conjugation machinery markedly reduces but did not fully abolish TFEB nuclear translocation. These observations suggest that CASM represents a dominant regulatory axis promoting TFEB activation in senescent cells, while additional stress-responsive pathways likely cooperate to fine-tune TFEB activity. Such multilayered regulation may allow cells to integrate diverse metabolic and proteostatic signals to appropriately scale lysosomal adaptation during senescence.
A central conceptual question revolves around why CASM is dispensable during normal proliferation yet essential during senescence. CASM-deficient cells grow normally, perhaps because basal lysosomal capacity has sufficient functional reserve. However, senescence likely imposes extreme proteostatic and metabolic stress such as accumulation of damaged proteins, decline in mitochondrial metabolism, increase in oxidative stress, and production and secretion of SASP (44–46). Under these conditions, cells depend on rapid, large-scale lysosomal expansion, which are processes uniquely enabled by CASM. As we recently reviewed, this phenomenon may also be seen in the context of other organelles (47). When mitochondrial import capacity is exceeded, unimported proteins accumulate in the cytosol, triggering proteotoxic stress and apoptosis (48). Moderate mitochondrial stress activates adaptive responses, but excessive stress overwhelms organelle capacity and triggers cell death. Our findings suggest an analogous principle for lysosomes where senescent cells experience a dramatic elevation in degradative burden, and failure to expand or reinforce lysosomal capacity through CASM leads to cytotoxic stress and death.
Finally, these findings may have important therapeutic implications. CASM inhibition, whether genetic, chemical, or pathogen derived, blocks senescence entry and promotes senescence-induced cell death. This suggests that targeting CASM or its upstream regulators may provide senolytic strategies by disabling the lysosomal adaptations required for senescent cell survival. Given the conserved role of lysosomal remodeling in aging tissues (49), the CASM-TFEB axis represents a potential promising therapeutic target for selectively eliminating harmful senescent cells.
Sex as a biological variable. This study does not involve humans/animals so sex was not considered as a variable.
Cell culture, senescence model and drug treatment. BEAS-2B immortalized respiratory epithelial cells and BJ human fibroblasts were obtained from ATCC and were authenticated through short tandem repeat profiling (data publicly available from ATCC). These cell lines were free from mycoplasma contamination and regularly monitored using PCR-based mycoplasma testing (MD200, Alstem). BEAS-2B and BJ cells were cultured in DMEM supplemented with 10% fetal bovine serum (FBS) and penicillin/streptomycin. BJ cell medium was additionally supplemented with sodium pyruvate and nonessential amino acids. All cell lines were maintained at 37°C with 5% CO2. DOX hydrochloride (HY-15142R, Med Chem Express) and Bleo sulfate (HY-10162, Med Chem Express) were dissolved in dimethyl sulfoxide (DMSO) and aliquots were stored at –80°C for long term storage. BEAS-2B cells were induced into senescence with 100 nM of DOX for 3 days, after which cells were maintained in regular growth media without DOX. BJ cells were induced into senescence with 5 μM of Bleo for 3 days, after which cells were placed in their regular growth media without Bleo. For staurosporine treatment, cells were treated with 100 nM staurosporine for 24 hours. For Bafilomycin A1 treatment, cells were treated with 200 nM Bafilomycin A1 for 24 hours.
Antibodies. Antibodies for the indicated proteins include: LAMP1 (sc-20011, Santa Cruz), HA (sc-57592, Santa Cruz), LC3 (14600-1-AP, Proteintech), ATG16L1 (catalog 8089, Cell Signaling Technology), ATG12 (catalog 4180, Cell Signaling Technology), ATG5 (catalog 12994, Cell Signaling Technology), p-TFEB/TFEB (A303-673A, Bethyl Laboratories), p62/SQSTM1 (18420-1-AP, Proteintech), V5 (771149, Invitrogen), p70 S6K (catalog 9202, Cell Signaling Technology), p-p70 S6K (catalog 9204, Cell Signaling Technology), ATG13 (catalog 13468, Cell Signaling Technology), cathepsin B (catalog 31718, Cell Signaling Technology), β-galactosidase (15518-1-AP, Proteintech), TFEB (Abcam, ab267351; clone EPR22941-6; 1:100), β-actin (66009-1-Ig, Proteintech), GAPDH (60004-1-Ig, Proteintech), goat anti-mouse IgG HRP (31430, Invitrogen), goat anti-mouse IgG Fluor 488 (A32723, Invitrogen), donkey anti-mouse IgG Fluor 568 (A32788, Invitrogen), goat anti-rabbit IgG HRP (31460, Invitrogen), goat anti-rabbit IgG Fluor 488 (A32731, Invitrogen), donkey anti-mouse IgG Fluor 680 (A10043, Invitrogen).
Stable cell-line generation. To generate TFEB-EGFP cell lines, the lentiviral vector pLV-EF1a-IRES-Hygro (Addgene, 85134) was modified to express the pEGFP-N1-TFEB (Addgene, 38119) insert and subsequently used for viral packaging. The pLV-EF1a-IRES-Hygro empty vector backbone was used as control. Hygromycin selection was performed for a minimum of 1 week after infection of target cells with the lentivirus.
To generate CRISPR-CAS9–KO cell lines, 2 guide sequences were screened for each gene of interest, and we proceeded with the guide with the highest efficiency of gene editing for stable cell line creation. LentiCRISPR.v2 (Addgene, 52961) cloned with the selected guide sequences were used for viral packaging. LentiCRISPR.v2, without guide sequences cloned in, was used as controls. Puromycin selection was performed for a minimum of 1 week after the infection of target cells with the lenti-CRISPR viruses.
sgRNA sequences used include the following: ATG16L1-g1F: CACCGTGGACCGCAGGGTTAAGCTT; ATG16L1-g1R: AAACAAGCTTAACCCTGCGGTCCAC; ATG16L1-g2F: CACCGCAATTTAGTCCCGGACATGA; ATG16L1-g2R: AAACTCATGTCCGGGACTAAATTGC; ATG12-g1F: CACCGCCTCCAGCAGCAATTGAAGT; ATG12-g1R: AAACACTTCAATTGCTGCTGGAGGC; ATG12-g2F: CACCGCTTCCTACTTCAATTGCTGC; ATG12-g2R: AAACGCAGCAATTGAAGTAGGAAGC; ATG5-g1F: CACCGAACTTGTTTCACGCTATATC; ATG5-g1R: AAACGATATAGCGTGAAACAAGTTC; ATG5-g2F: CACCGTTCCATGAGTTTCCGATTGA; ATG5-g2R: AAACTCAATCGGAAACTCATGGAAC; ATG13-g1F: CACCGTTTACCCAATCTGAACCCGT; ATG13-g1R: AAACACGGGTTCAGATTGGGTAAAC; ATG13-g2F: CACCGCAGTCTGTTGTACACCGTGT; and ATG13-g2R: AAACACACGGTGTACAACAGACTGC.
To generate BEAS-2B cells stably expressing TMEM192-3xHA for LysoIP, the pLV-EF1a-IRES-Hygro (Addgene, 85134) vector was modified with the pLJC5-Tmem192-3xHA (Addgene, 102930) insert. Hygromycin selection was performed for a minimum of 1 week after infection of target cells with the lentivirus.
To generate ATG16L1 reconstitution cell lines, WT ATG16L1 or the CASM-defective ATG16L1 F467A mutant were cloned into pCDH-CMV-MCS (Addgene, 72265). Empty pCDH-CMV-MCS backbone was used as a control. For both constructs, silent mutations were introduced within the CRISPR guide target sites to prevent recutting in ATG16L1 KO cells. Following infections, cells were selected in hygromycin for a minimum of 1 week after infection of target cells with the lentivirus.
To generate V5-SopF cell lines, the pCDH-V5-SopF lentiviral expression construct was a gift from the laboratory of Jay Xiaojun Tan (Aging Institute, University of Pittsburgh School of Medicine, Pittsburgh, Pennsylvania, USA) (50). Lentivirus was produced and used to infect BEAS-2B cells, followed by puromycin selection for at least 1 week to establish stable V5-SopF–expressing cell lines which were confirmed by Western blot analysis using the epitope tag.
To generate ATG16L1-KO cells expressing TFEBS142A, a point mutation was introduced into pEGFP-N1-TFEB (Addgene, 38119), to substitute serine 142 with alanine (S142A). The resulting construct was verified by sequencing. The resulting pEGFP-N1-TFEB-S142A construct was then cloned into the pLV-EF1a-IRES-Hygro (Addgene, 85134) vector for lentiviral packaging. pLV-EF1a-IRES-Hygro empty backbone was used as a control. Hygromycin selection was performed for at least 1 week following lentiviral infection of target cells.
Fluorescence microscopy. BEAS-2B expressing TFEB-EGFP were seeded at 3 × 10⁵ cells/well in 6-well plates. Cells were induced into senescence by treatment with 100 nM DOX. Images were taken at each time point prior/post senescence induction using an ECHO Revolve Microscope. Cells were classified as having nuclear TFEB if the nuclear TFEB-EGFP signal was greater than or equal to the cytosolic TFEB-EGFP signal. Quantification represents mean ± SD from 3 independent experiments (≥30 cells per replicate). Statistical significance was determined by unpaired 2-tailed t test.
Confocal microscopy. BEAS-2B cells were seeded on glass coverslips (Warner Instruments, 64-0712) at 2.5 × 10⁴ cells/well in 24-well plates. Cells were induced into senescence by treatment with 100 nM DOX as above. At each time point, cells were fixed with 4% paraformaldehyde (PFA) in PBS for 20 minutes at room temperature. DAPI was used as a counterstain. The coverslips were mounted on slides using VECTASHIELD HardSet Antifade Mounting Medium (Vector Laboratory, H-1400). Images were taken using a Leica SP8 LIGHTNING confocal system using the built-in software Leica Application Suite X 3.5.5.19976. For imaging of endogenous TFEB, WT, KO, and reconstituted BEAS-2B lines were seeded on glass coverslips and induced into senescence with 100 nM DOX. Cells were fixed with 4% PFA, blocked, and incubated overnight at 4°C with a rabbit monoclonal anti-TFEB antibody (Abcam, ab267351; clone EPR22941-6; 1:100), followed by an Alexa Fluor 488–conjugated goat anti-rabbit secondary antibody with DAPI as a nuclear counterstain. Cells were classified as having nuclear TFEB when the nuclear TFEB signal was greater than or equal to the cytosolic signal, and the percentage of cells with nuclear TFEB was quantified (≥30 cells per replicate; 3 independent experiments).
SA-β-gal staining. SA-β-gal activity was assessed using the Senescence β-Galactosidase Staining Kit (Cell Signaling Technology, 9860) according to the manufacturer’s instructions. BEAS-2B cells were seeded in 6-well plates and induced into senescence with 100 nM DOX, 5 μM Bleo, or 500 μM H2O2. At the indicated time point, cells were washed with PBS, fixed with the provided Fixative Solution for 10–15 minutes at room temperature, and incubated with the β-Galactosidase Staining Solution (pH 6.0) overnight at 37°C in a dry incubator without CO2. Cells were imaged by bright-field microscopy, and the percentage of SA-β-gal+ (blue) cells was quantified from at least 3 independent fields per condition.
EdU incorporation assay. Cell proliferation was measured using the Click-iT Plus EdU Cell Proliferation Kit for Imaging, Alexa Fluor 488 (Thermo Fisher Scientific, C10637) according to the manufacturer’s instructions. BEAS-2B cells seeded on glass coverslips were induced into senescence with 100 nM DOX, 5 μM Bleo, or 500 μM H2O2, then incubated with 10 μM EdU for 2 hours prior to fixation. Cells were fixed with 4% paraformaldehyde and permeabilized with 0.5% Triton X-100, and the incorporated EdU was detected by the Click-iT Plus reaction. Nuclei were counterstained with Hoechst 33342. Images were acquired by confocal microscopy, and the percentage of EdU+ cells was quantified from at least 3 independent fields per condition.
Immunoblotting. For Western blot analysis, cells at the indicated times were washed 3 times with cold PBS and scraped into RIPA lysis buffer (89901, Pierce; Thermo Fisher) supplemented with protease inhibitor (A32953, Pierce; Thermo Fisher) and phosphatase inhibitor cocktail (4906845001, Roche). The samples were then incubated on ice for 30 minutes followed by centrifugation at 15,000g for 15 minutes at 4°C to remove insoluble components. The supernatants were then collected as whole cell lysates and protein concentration was quantified with Pierce BCA Protein Assay kit (23228, Thermo Fisher) following the manufacturer’s protocol. 50 μg of protein lysate were mixed with 6X Laemmli SDS buffer (BP-111R, BPS Bioscience) and heated at 95°C for 5 minutes. The protein samples were then separated on a 4%–20% precast polyacrylamide gel (Bio-Rad, 4561096) and transferred onto 0.2 μm nitrocellulose membranes using the Trans-blot Turbo system. The membrane was blocked with StartingBlock Blocking Buffer (Thermo Fisher, 337542) for 1 hour at room temperature and then incubated with primary antibody at 4°C overnight. The membrane was then washed 3 times with Tris-Buffered Saline with Tween-20 (TBST) and incubated with the HRP-conjugated secondary antibody or corresponding fluorescent secondary antibody at room temperature for 1 hour. The membrane was then washed and HRP secondary antibody incubated membranes were exposed with SuperSignal West Pico PLUS Chemiluminescent Substrate (Thermo Fisher, 334580) using a Bio-Rad ChemiDoc MP Imaging System. Band intensities were quantified by densitometry in ImageJ (NIH). Within each blot, the signal for the protein of interest was normalized to the corresponding loading control (β-actin) in the same lane; phosphoprotein signals (p-S6K, p-TFEB) were instead expressed as a ratio to the corresponding total protein in the same lane
RNA extraction, reverse transcription and quantitative PCR. BEAS-2B cells were seeded at 3 × 10⁵ cells/well in 6-well plates and 100 nM DOX was added to induce senescence. At each indicated time point, cells were collected, and RNA were extracted using RNeasy Mini Kit (74104, Qiagen) following the manufacturer’s protocol. Equal concentration of RNA was then reverse transcribed using iScript Reverse Transcription Supermix (1708849, Bio-Rad) following the manufacturer’s protocol. The obtained cDNA was then diluted at 1:10 and was used for a 20 μL qPCR reaction performed with PowerUp SYBR Green Master Mix (A25742, Thermo Fisher) in a Thermo Fisher QuantStudio 3 system. Expression levels of target genes were normalized to eukaryotic translation initiation factor 3, subunit F (EIF3F) (n = 3 biological replicates).
The following qPCR target gene primers used: IL6-F: CCAGGAGCCCAGCTATGAAC; IL6-R: CCCAGGGAGAAGGCAACTG; IL8-F: AAGGAAAACTGGGTGCAGAG; IL8-R: ATTGCATCTGGCAACCCTAC; IL1A-F: AACCAGTGCTGCTGAAGGA; IL1A-R: TTCTTAGTGCCGTGAGTTTCC; CXCL1-F: ATGGCCCGCGCTGCTCTCTCC; CXCL1-R: GTTGGATTTGTCACTGTTCAG; ULK1-F: AGGAAGATGTCTCTGGGTGG; ULK1-R: ACGTGCAAGTCAGACAGGTT; ATG9A-F: ATTTGCTGCTACTGGGAGAT; ATG9A-R: CACCATGTAGTTCTGGAAAC; ATP6V1E1-F: TTGCCACCAAAAACGATGTT; ATP6V1E1-R: AACTTCCTGTTGGCATTTGC; CTSA-F: GCCTCAACATCTACAATCTC; CTSA-R: ATGCGCACTTTATCCCCTGA; EIF3F-F: GACACAAGTCTCCAGAACGGC; and EIF3F-R: TGGTCTCAAAGTCATCGGGAA.
Lysosomal immunoprecipitation (LYSO-IP). Lysosomes from BEAS-2B cells stably expressing TMEM192-3xHA were immune-isolated as previously described (30). Briefly, cells were seeded at 1.5 × 10⁶ cells in 10 cm plates and induced into senescence by treatment with 100 nM DOX. At each indicated time point, cells were washed 3 times with cold PBS and scraped into KPBS (136 mM KCl, 10 mM KH2PO4, pH 7.25). One of 20 of the total suspension was retained for whole-cell lysate analysis (input), while the remaining portion was centrifuged at 1,000g for 2 minutes at 4°C. Cell pellets were then resuspended with KPBS buffer and homogenized 20 times with a 25G needle and then spun at 1,000g for 2 minutes at 4°C. The supernatant was transferred to a new tube, and 50 μL of anti-HA magnetic beads (88836, Thermo Fisher) was added and rotated for 10 minutes at 4°C. Lysosomes-bound beads were washed 5 times with KPBS buffer followed by the addition of 2X Laemmli SDS buffer (BP-111R, BPS Bioscience). The mixture was heated at 95°C for 5 minutes prior to Western blot analysis.
Cell death assays. BEAS-2B or BJ cells were seeded at 2.5 × 10⁵ cells/well in 6-well plates. One day after attachment, 100 nM DOX or 5 μM Bleo was added to induce senescence. At each indicated time point, cells and the conditioned media were collected and filtered through Polystyrene Round-Bottom Tube with Cell-Strainer Cap (352235, Falcon) and spun at 1,000g for 5 minutes. Cell pellets were then washed 2 times with PBS to remove media. Cells were then stained with annexin V and PI and incubated in the dark for 5 minutes. The stained cell samples were then processed by an Attune NxT Flow Cytometer. For caspase-3/7 activity assays, cells were seeded at 8 × 10³ cells/well in white-walled 96-well plates, induced into senescence as described above, and assayed at the indicated time points using the Caspase-Glo 3/7 luminescent assay (Promega) according to the manufacturer’s instructions; luminescence (relative light units, RLU) was recorded on a microplate reader.
Senescent cell number quantification. To quantify the number of surviving senescent cells, BEAS-2B cells were seeded at 2.5 × 10⁵ cells/well in 6-well plates and induced into senescence with 100 nM DOX as described above, after which cells were maintained in regular growth media without DOX. Six days after senescence induction, cells were washed with PBS, detached by trypsinization, and resuspended in a defined volume of media. Viable cells were counted by trypan blue exclusion on an automated cell counter, and data are expressed as cells per well from 3 independent experiments.
Statistics. All statistical analyses were performed in GraphPad Prism Version 9.5.1. Comparisons between 2 conditions were performed using a 2-tailed unpaired t test with Welch’s correction (not assuming equal variances), except for matched Western blot densitometry, which was analyzed by a ratio paired 2-tailed t test to account for pairing within each blot. For comparisons of multiple treatments or genotypes against a single shared control, each readout (or gene, for qPCR panels) was analyzed by 1-way ANOVA followed by Dunnett’s multiple-comparison test. For prespecified pairwise comparisons that did not share a common control (e.g., KO cells reconstituted with WT versus mutant protein), 1-way ANOVA was followed by Šídák’s multiple-comparison test on the selected comparisons of interest. Data are presented as mean ± SD, and adjusted P < 0.05 (or P < 0.05 for single comparisons) was considered statistically significant.
Data availability. Values for all individual data points shown in graphs and reported as means in the figures are provided in the Supporting Data Values file. No large-scale or sequencing datasets were generated in this study, and no custom analytic code was used; image quantification was performed in ImageJ (NIH) and all statistical analyses in GraphPad Prism as described above. No patient or third-party data were used, and there are no restrictions on data availability.
Author contributions. YWC designed and performed experiments, analyzed data, and wrote the manuscript. MG, JL, and JXT assisted with experimental design and data interpretation. TF supervised the study, provided conceptual guidance, and edited the manuscript.
AI disclosure. FigureLabs was used in generating the graphical abstract.
Conflict of interest. TF is a cofounder and stockholder in Generian Pharmaceuticals and Coloma Therapeutics.
Funding support. This work is the result of NIH funding, in whole or in part, and is subject to the NIH Public Access Policy. Through acceptance of this federal funding, the NIH has been given a right to make the work publicly available in PubMed Central.
We are grateful to members of the Finkel lab and the Aging Institute for helpful comments.
Address for correspondence. Toren Finkel, Aging Institute, University of Pittsburgh School of Medicine, 100 Technology Drive, Pittsburgh, Pennsylvania 15239, USA. Email: finkelt@pitt.edu.
Copyright: © 2026, Cheng et al. This is an open access article published under the terms of the Creative Commons Attribution 4.0 International License.
Reference information: JCI Insight. 2026;11(21):e207890.https://doi.org/10.1172/jci.insight.207890.