Go to The Journal of Clinical Investigation
  • About
  • Editors
  • Consulting Editors
  • For authors
  • Journal stats
  • Publication ethics
  • Publication alerts by email
  • Transfers
  • Advertising
  • Job board
  • Contact
  • Physician-Scientist Development
  • Current issue
  • Past issues
  • By specialty
    • COVID-19
    • Cardiology
    • Immunology
    • Metabolism
    • Nephrology
    • Oncology
    • Pulmonology
    • All ...
  • Videos
  • Collections
    • In-Press Preview
    • Resource and Technical Advances
    • Clinical Research and Public Health
    • Research Letters
    • Editorials
    • Perspectives
    • Physician-Scientist Development
    • Reviews
    • Top read articles

  • Current issue
  • Past issues
  • Specialties
  • In-Press Preview
  • Resource and Technical Advances
  • Clinical Research and Public Health
  • Research Letters
  • Editorials
  • Perspectives
  • Physician-Scientist Development
  • Reviews
  • Top read articles
  • About
  • Editors
  • Consulting Editors
  • For authors
  • Journal stats
  • Publication ethics
  • Publication alerts by email
  • Transfers
  • Advertising
  • Job board
  • Contact
Top
  • View PDF
  • Download citation information
  • Send a comment
  • Terms of use
  • Standard abbreviations
  • Need help? Email the journal
  • Top
  • Abstract
  • Introduction
  • Results
  • Discussion
  • Methods
  • Manuscript information
  • Supplemental material
  • Acknowledgments
  • Footnotes
  • References
  • Version history
  • Article usage
  • Citations to this article
Advertisement

Research ArticleAIDS/HIVImmunologyInfectious disease Open Access | 10.1172/jci.insight.208488

SIV infection disrupts the spatial cellular and communication networks of pulmonary granulomas during SIV/Mtb co-infection

Jessica M. Medrano,1,2 Persis Sunny,1,2,3 Collin R. Diedrich,1,2 Pauline Maiello,2,3 Christopher Kline,3 Tara Rutledge,1,2 Edwin Klein,4 Joshua T. Mattila,2,5 Jishnu Das,6,7 Zandrea Ambrose,2,3,5 and Philana Ling Lin1,2

1Department of Pediatrics, University of Pittsburgh Medical Center’s Children’s Hospital of Pittsburgh,

2Center for Vaccine Research, and

3Department of Microbiology & Molecular Genetics, University of Pittsburgh School of Medicine, Pittsburgh, Pennsylvania, USA.

4Division of Laboratory Animal Resources, University of Pittsburgh, Pittsburgh, Pennsylvania, USA.

5Department of Infectious Diseases and Microbiology, University of Pittsburgh School of Public Health, Pittsburgh, Pennsylvania, USA.

6Center for Systems Immunology, Department of Immunology, and

7Department of Computational and Systems Biology, University of Pittsburgh School of Medicine, Pittsburgh, Pennsylvania, USA.

Address for correspondence. Philana Ling Lin, Children’s Hospital of Pittsburgh, Rangos Research Center, 9th floor, 4401 Penn Avenue, Pittsburgh, Pennsylvania 15224, USA. Email: Philana.lin@chp.edu.

Find articles by Medrano, J. in: PubMed | Google Scholar

1Department of Pediatrics, University of Pittsburgh Medical Center’s Children’s Hospital of Pittsburgh,

2Center for Vaccine Research, and

3Department of Microbiology & Molecular Genetics, University of Pittsburgh School of Medicine, Pittsburgh, Pennsylvania, USA.

4Division of Laboratory Animal Resources, University of Pittsburgh, Pittsburgh, Pennsylvania, USA.

5Department of Infectious Diseases and Microbiology, University of Pittsburgh School of Public Health, Pittsburgh, Pennsylvania, USA.

6Center for Systems Immunology, Department of Immunology, and

7Department of Computational and Systems Biology, University of Pittsburgh School of Medicine, Pittsburgh, Pennsylvania, USA.

Address for correspondence. Philana Ling Lin, Children’s Hospital of Pittsburgh, Rangos Research Center, 9th floor, 4401 Penn Avenue, Pittsburgh, Pennsylvania 15224, USA. Email: Philana.lin@chp.edu.

Find articles by Sunny, P. in: PubMed | Google Scholar

1Department of Pediatrics, University of Pittsburgh Medical Center’s Children’s Hospital of Pittsburgh,

2Center for Vaccine Research, and

3Department of Microbiology & Molecular Genetics, University of Pittsburgh School of Medicine, Pittsburgh, Pennsylvania, USA.

4Division of Laboratory Animal Resources, University of Pittsburgh, Pittsburgh, Pennsylvania, USA.

5Department of Infectious Diseases and Microbiology, University of Pittsburgh School of Public Health, Pittsburgh, Pennsylvania, USA.

6Center for Systems Immunology, Department of Immunology, and

7Department of Computational and Systems Biology, University of Pittsburgh School of Medicine, Pittsburgh, Pennsylvania, USA.

Address for correspondence. Philana Ling Lin, Children’s Hospital of Pittsburgh, Rangos Research Center, 9th floor, 4401 Penn Avenue, Pittsburgh, Pennsylvania 15224, USA. Email: Philana.lin@chp.edu.

Find articles by Diedrich, C. in: PubMed | Google Scholar

1Department of Pediatrics, University of Pittsburgh Medical Center’s Children’s Hospital of Pittsburgh,

2Center for Vaccine Research, and

3Department of Microbiology & Molecular Genetics, University of Pittsburgh School of Medicine, Pittsburgh, Pennsylvania, USA.

4Division of Laboratory Animal Resources, University of Pittsburgh, Pittsburgh, Pennsylvania, USA.

5Department of Infectious Diseases and Microbiology, University of Pittsburgh School of Public Health, Pittsburgh, Pennsylvania, USA.

6Center for Systems Immunology, Department of Immunology, and

7Department of Computational and Systems Biology, University of Pittsburgh School of Medicine, Pittsburgh, Pennsylvania, USA.

Address for correspondence. Philana Ling Lin, Children’s Hospital of Pittsburgh, Rangos Research Center, 9th floor, 4401 Penn Avenue, Pittsburgh, Pennsylvania 15224, USA. Email: Philana.lin@chp.edu.

Find articles by Maiello, P. in: PubMed | Google Scholar

1Department of Pediatrics, University of Pittsburgh Medical Center’s Children’s Hospital of Pittsburgh,

2Center for Vaccine Research, and

3Department of Microbiology & Molecular Genetics, University of Pittsburgh School of Medicine, Pittsburgh, Pennsylvania, USA.

4Division of Laboratory Animal Resources, University of Pittsburgh, Pittsburgh, Pennsylvania, USA.

5Department of Infectious Diseases and Microbiology, University of Pittsburgh School of Public Health, Pittsburgh, Pennsylvania, USA.

6Center for Systems Immunology, Department of Immunology, and

7Department of Computational and Systems Biology, University of Pittsburgh School of Medicine, Pittsburgh, Pennsylvania, USA.

Address for correspondence. Philana Ling Lin, Children’s Hospital of Pittsburgh, Rangos Research Center, 9th floor, 4401 Penn Avenue, Pittsburgh, Pennsylvania 15224, USA. Email: Philana.lin@chp.edu.

Find articles by Kline, C. in: PubMed | Google Scholar

1Department of Pediatrics, University of Pittsburgh Medical Center’s Children’s Hospital of Pittsburgh,

2Center for Vaccine Research, and

3Department of Microbiology & Molecular Genetics, University of Pittsburgh School of Medicine, Pittsburgh, Pennsylvania, USA.

4Division of Laboratory Animal Resources, University of Pittsburgh, Pittsburgh, Pennsylvania, USA.

5Department of Infectious Diseases and Microbiology, University of Pittsburgh School of Public Health, Pittsburgh, Pennsylvania, USA.

6Center for Systems Immunology, Department of Immunology, and

7Department of Computational and Systems Biology, University of Pittsburgh School of Medicine, Pittsburgh, Pennsylvania, USA.

Address for correspondence. Philana Ling Lin, Children’s Hospital of Pittsburgh, Rangos Research Center, 9th floor, 4401 Penn Avenue, Pittsburgh, Pennsylvania 15224, USA. Email: Philana.lin@chp.edu.

Find articles by Rutledge, T. in: PubMed | Google Scholar

1Department of Pediatrics, University of Pittsburgh Medical Center’s Children’s Hospital of Pittsburgh,

2Center for Vaccine Research, and

3Department of Microbiology & Molecular Genetics, University of Pittsburgh School of Medicine, Pittsburgh, Pennsylvania, USA.

4Division of Laboratory Animal Resources, University of Pittsburgh, Pittsburgh, Pennsylvania, USA.

5Department of Infectious Diseases and Microbiology, University of Pittsburgh School of Public Health, Pittsburgh, Pennsylvania, USA.

6Center for Systems Immunology, Department of Immunology, and

7Department of Computational and Systems Biology, University of Pittsburgh School of Medicine, Pittsburgh, Pennsylvania, USA.

Address for correspondence. Philana Ling Lin, Children’s Hospital of Pittsburgh, Rangos Research Center, 9th floor, 4401 Penn Avenue, Pittsburgh, Pennsylvania 15224, USA. Email: Philana.lin@chp.edu.

Find articles by Klein, E. in: PubMed | Google Scholar

1Department of Pediatrics, University of Pittsburgh Medical Center’s Children’s Hospital of Pittsburgh,

2Center for Vaccine Research, and

3Department of Microbiology & Molecular Genetics, University of Pittsburgh School of Medicine, Pittsburgh, Pennsylvania, USA.

4Division of Laboratory Animal Resources, University of Pittsburgh, Pittsburgh, Pennsylvania, USA.

5Department of Infectious Diseases and Microbiology, University of Pittsburgh School of Public Health, Pittsburgh, Pennsylvania, USA.

6Center for Systems Immunology, Department of Immunology, and

7Department of Computational and Systems Biology, University of Pittsburgh School of Medicine, Pittsburgh, Pennsylvania, USA.

Address for correspondence. Philana Ling Lin, Children’s Hospital of Pittsburgh, Rangos Research Center, 9th floor, 4401 Penn Avenue, Pittsburgh, Pennsylvania 15224, USA. Email: Philana.lin@chp.edu.

Find articles by Mattila, J. in: PubMed | Google Scholar

1Department of Pediatrics, University of Pittsburgh Medical Center’s Children’s Hospital of Pittsburgh,

2Center for Vaccine Research, and

3Department of Microbiology & Molecular Genetics, University of Pittsburgh School of Medicine, Pittsburgh, Pennsylvania, USA.

4Division of Laboratory Animal Resources, University of Pittsburgh, Pittsburgh, Pennsylvania, USA.

5Department of Infectious Diseases and Microbiology, University of Pittsburgh School of Public Health, Pittsburgh, Pennsylvania, USA.

6Center for Systems Immunology, Department of Immunology, and

7Department of Computational and Systems Biology, University of Pittsburgh School of Medicine, Pittsburgh, Pennsylvania, USA.

Address for correspondence. Philana Ling Lin, Children’s Hospital of Pittsburgh, Rangos Research Center, 9th floor, 4401 Penn Avenue, Pittsburgh, Pennsylvania 15224, USA. Email: Philana.lin@chp.edu.

Find articles by Das, J. in: PubMed | Google Scholar |

1Department of Pediatrics, University of Pittsburgh Medical Center’s Children’s Hospital of Pittsburgh,

2Center for Vaccine Research, and

3Department of Microbiology & Molecular Genetics, University of Pittsburgh School of Medicine, Pittsburgh, Pennsylvania, USA.

4Division of Laboratory Animal Resources, University of Pittsburgh, Pittsburgh, Pennsylvania, USA.

5Department of Infectious Diseases and Microbiology, University of Pittsburgh School of Public Health, Pittsburgh, Pennsylvania, USA.

6Center for Systems Immunology, Department of Immunology, and

7Department of Computational and Systems Biology, University of Pittsburgh School of Medicine, Pittsburgh, Pennsylvania, USA.

Address for correspondence. Philana Ling Lin, Children’s Hospital of Pittsburgh, Rangos Research Center, 9th floor, 4401 Penn Avenue, Pittsburgh, Pennsylvania 15224, USA. Email: Philana.lin@chp.edu.

Find articles by Ambrose, Z. in: PubMed | Google Scholar

1Department of Pediatrics, University of Pittsburgh Medical Center’s Children’s Hospital of Pittsburgh,

2Center for Vaccine Research, and

3Department of Microbiology & Molecular Genetics, University of Pittsburgh School of Medicine, Pittsburgh, Pennsylvania, USA.

4Division of Laboratory Animal Resources, University of Pittsburgh, Pittsburgh, Pennsylvania, USA.

5Department of Infectious Diseases and Microbiology, University of Pittsburgh School of Public Health, Pittsburgh, Pennsylvania, USA.

6Center for Systems Immunology, Department of Immunology, and

7Department of Computational and Systems Biology, University of Pittsburgh School of Medicine, Pittsburgh, Pennsylvania, USA.

Address for correspondence. Philana Ling Lin, Children’s Hospital of Pittsburgh, Rangos Research Center, 9th floor, 4401 Penn Avenue, Pittsburgh, Pennsylvania 15224, USA. Email: Philana.lin@chp.edu.

Find articles by Lin, P. in: PubMed | Google Scholar |

Published September 24, 2026 - More info

Published in Volume 11, Issue 21 on November 9, 2026
JCI Insight. 2026;11(21):e208488. https://doi.org/10.1172/jci.insight.208488.
© 2026 Medrano et al. This work is licensed under the Creative Commons Attribution 4.0 International License. To view a copy of this license, visit http://creativecommons.org/licenses/by/4.0/.
Published September 24, 2026 - Version history
Received: April 27, 2026; Accepted: September 16, 2026
View PDF
Abstract

Tuberculosis (TB) caused by Mycobacterium tuberculosis (Mtb) is the leading infectious cause of death globally. Despite wide use of antiretroviral therapy (ART) by people living with HIV, the risk of TB remains increased. To understand immune interactions within lung granulomas, we compared spatial transcriptomics of Mtb and simian immunodeficiency virus (SIV) in co-infected macaques with or without ART as a model for HIV/Mtb co-infection. Spatially differentiated transcriptional profiles were observed in Mtb-only granulomas, with myeloid cells enriched in metabolic/antimicrobial pathways within the inner ring and T cell costimulatory/activation pathways enriched in the outer ring. These spatially distinct patterns were lost in SIV/Mtb granulomas, with higher enrichment in type I IFN pathways compared with Mtb-only granulomas. SIV/ART/Mtb granulomas had an intermediate transcriptional pattern without restoration to Mtb-only granulomas, despite a lack of viral replication. Cell-cell communication was reduced among SIV/Mtb co-infected groups. These data suggested that HIV disrupted spatially organized immune functions of granulomas, which were not fully restored by ART.

Introduction

Infection with Mycobacterium tuberculosis (Mtb) continues to be the leading cause of death from a single infectious agent, with over 10.7 million new cases of tuberculosis (TB) and 1.23 million deaths in 2024 and an estimated a one-quarter of the world having been infected with the bacteria (1). About 5–10% of those infected with Mtb will go on to develop active disease, typically within the first 2 years after infection (2). While the immunologic mechanisms necessary to control Mtb infection are not fully understood, the most important risk factor for severe TB disease is co-infection with human immunodeficiency virus (HIV) (1). The resurgence of the TB epidemic is closely tied to the emergence of HIV, and disease burden is concentrated in overlapping populations in southern Africa (1). These 2 pathogens have a synergistic relationship where each drives worse outcomes of the other; TB is the leading cause of death among people living with HIV (PLWH), as one-third of HIV-associated deaths are from TB (1, 3). About 73% of PLWH are on antiretroviral therapy (ART), which, while not curative, prevents ongoing HIV replication and restores CD4+ T cells. However, PLWH are still more likely to develop TB, despite suppressive ART (4).

The hallmark of TB is the granuloma: an organized collection of immune cells often with a necrotic central area of Mtb-infected macrophages surrounded by a ring of lymphocytes and other innate immune cells (reviewed in refs. 5, 6). Granulomas form within the lung parenchyma but can also spread to extrapulmonary sites, including lymph nodes, spleen, liver, central nervous system, and gastrointestinal/genitourinary tracts (reviewed in ref. 7). The granuloma is the primary site of immune interactions with Mtb. From the host’s perspective, granulomas function to contain Mtb, but Mtb has also evolved to persist within them (8). Their structure is heterogeneous both in the spectrum of granuloma types (e.g., mineralized, non-necrotic, and necrotic granulomas) and in the complex populations of macrophages and other immune cells present within a granuloma (5, 9, 10). Each granuloma is independent within the same host and even within the same lung lobe, and the clinical outcome of Mtb infection depends on the collective success or failure of multiple granulomas in inhibiting Mtb growth (10).

How HIV disrupts the protective immune responses against Mtb within granulomas remains incompletely understood, although studies with simian immunodeficiency virus (SIV) in non-human primates (NHPs) have shown that cells within the granuloma can be infected with SIV during co-infection (11–13). CD4+ T cells are the most influential adaptive immune cell type in mediating protection from Mtb, and are critical for activating macrophages, the first cell type to encounter Mtb, through secretion of cytokines produced by CD4+ T cells, including IFN-γ and TNF (14). In vitro, HIV infection of human peripheral blood mononuclear cells (PBMCs) increases Mtb burden in monocyte-derived macrophages (15); and in vivo, CD4+ T cells within the granuloma are depleted as early as 2 weeks after SIV infection (12). Depletion of CD4+ T cells during HIV or SIV co-infection is correlated with worse TB outcomes (4, 12, 16). Importantly, we and others have shown that SIV-induced reactivation of latent Mtb infection can occur independently of CD4+ T cell loss (11, 17). Work in NHPs has demonstrated that immune-driving protein expression in Mtb granulomas is spatially organized (9, 18–20), although the mechanisms by which T cell and macrophage communication in granulomas is altered during SIV co-infection are not fully elucidated.

Here, we used an NHP model of SIV and subsequent Mtb co-infection with and without suppressive ART to interrogate the immune cell dynamics in granulomas. During Mtb infection, cellular functions within the granuloma were spatially distinct, such that myeloid and T cell gene expression profiles were different within the inner and outer regions. Co-infection with SIV, which resulted in higher bacterial burden in the granuloma and severe TB disease, led to loss of functional distinction between the inner and outer regions, for both myeloid cells and T cells, and a reduction in overall cell-cell communication within the granuloma primarily driven by a reduction in T cell signaling. The reduction in functional organization of cells in granulomas was not fully restored in SIV/Mtb co-infected animals treated with ART, highlighting that while suppression of SIV viremia reduced bacterial burden and improved outcomes, ART did not rescue all aspects of SIV/Mtb pathogenesis (16, 21). Understanding how HIV alters dynamics within granulomas and drives increased TB disease during co-infection is critical for development of vaccines and therapeutics.

Results

Myeloid and T cell functions in granulomas are altered during SIV/Mtb co-infection. To understand the effect of HIV on cellular dynamics in Mtb granulomas, we used an NHP model of HIV/Mtb co-infection, using SIV as a surrogate for HIV. Co-infected animals were infected with pathogenic SIV with or without daily ART starting on day 3 after infection followed by low-dose Mtb challenge 16 weeks later (SIV/Mtb and SIV/ART/Mtb, respectively) (Figure 1A) (16). A control group of animals was infected with Mtb only. Plasma viremia peaked 1 week after infection before establishing a set point in SIV/Mtb animals, and all ART-treated animals had undetectable plasma viremia by 4 weeks after infection. CD4+ T cells were depleted in the blood and lung granulomas in SIV/Mtb but not SIV/ART/Mtb or Mtb-only animals (16). Mtb bacterial burden per granuloma was higher in SIV/Mtb granulomas compared with both Mtb-only and SIV/ART/Mtb animals (Figure 1B) (16). Almost all granulomas from SIV/Mtb animals had detectable SIV RNA by qRT-PCR (Figure 1C), whereas a selection of granulomas from SIV/ART/Mtb granulomas did not have detectable SIV RNA, as expected (16). Despite higher bacterial burden, SIV/Mtb granulomas were not appreciably different histologically from Mtb-only or SIV/ART/Mtb granulomas when assessed via hematoxylin and eosin (H&E) staining (Supplemental Figure 1; supplemental material available online with this article; https://doi.org/10.1172/jci.insight.208488DS1) (13). Thus, we hypothesized that the differences in SIV/Mtb granulomas may be related to cellular function rather than overall granuloma architecture.
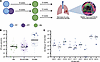
Study design and granuloma-specific Mtb and SIV quantitation.Figure 1

Study design and granuloma-specific Mtb and SIV quantitation. (A) Macaques were infected with SIV (16 weeks) and Mtb (12 weeks) (top row, n = 9), SIV (16 weeks) and Mtb (12 weeks) with ART beginning 3 days after SIV infection (middle row, n = 10), or Mtb only (3 months) (bottom row, n = 9). Macaques were necropsied and individual lung granulomas were harvested and assessed for Mtb bacterial colony forming units (CFU), SIV RNA copies, and histology. A subset of granulomas was assessed for spatial transcriptomics (NanoString GeoMX) and immunofluorescence. Created in BioRender (https://BioRender.com/q7ri765). (B) Total Mtb CFU in each granuloma isolated at necropsy. Each symbol is a granuloma; each shape is an NHP. Horizontal lines indicate medians per group. All granulomas harvested are shown, with dark shapes indicating the granulomas used for GeoMX. Data were adapted from Diedrich et al. (16). (C) SIV RNA copies per 1 × 10⁶ CD4 RNA copies in lung granulomas at necropsy. Each circle is a granuloma; horizontal lines indicate medians for each animal. All granulomas harvested are shown, with dark symbols indicating the granulomas used for GeoMX.

To assess the impact of SIV infection on immunological responses within the granuloma, spatially defined transcriptomic changes in granulomas were assessed using the NanoString GeoMX platform (Supplemental Table 1). In this assay, barcoded RNA probes targeting the whole transcriptome and fluorescent antibodies for T cells (CD3) and myeloid cells (CD68) were used. Regions of interest (ROIs) of the inner and outer rings (excluding the necrotic, acellular core) of the Mtb granulomas were manually delineated using serial H&E staining. The transcriptome of CD68+ myeloid cells and CD3+ T cells from each region of lung granuloma were interrogated (Supplemental Figure 2).

Differentially expressed genes (DEGs) from myeloid and T cells within entire granulomas (regardless of inner or outer ring) were compared between groups. Expression patterns in SIV/Mtb myeloid cells were distinct from both the transcriptome in Mtb-only myeloid cells (1205 DEGs; Supplemental Table 2) and SIV/ART/Mtb myeloid cells (1418 differentially expressed genes; Supplemental Table 2 and Figure 2A). Gene set enrichment analysis (GSEA) was performed to compare pathways enriched in DEGs in myeloid cells from each group. Proinflammatory pathways were the most dramatically enriched in DEGs from myeloid cells in SIV/Mtb granulomas compared with both the SIV/ART/Mtb and Mtb-only granulomas (Figure 2B, Supplemental Figure 3, and Supplemental Table 3). Myeloid cells from SIV/Mtb granulomas overall were significantly enriched in DEGs from type I IFN signaling pathways, acute inflammatory responses, IL-1 signaling, chemokine production, and response to chemokines compared with myeloid cells from Mtb and SIV/ART/Mtb granulomas (Figure 2C and Supplemental Table 3). Myeloid cells from the SIV/ART/Mtb granulomas differed in their enrichment pattern for DEGs in specific pathways; acute inflammatory responses (complement) and chemokine production DEGs were enriched relative to Mtb, although not identical to SIV/Mtb granulomas (Figure 2C and Supplemental Table 3). However, IL-1 signaling and IFN-α/β signaling, although not enriched overall in SIV/ART/Mtb myeloid cells, still had distinct gene expression patterns from Mtb-only myeloid cells (Figure 2C). Thus, myeloid cells contribute to a more inflammatory environment in SIV/Mtb granulomas, and ART can restore some, but not all, aspects of myeloid cell function.
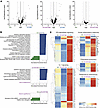
Myeloid cell function in granulomas is altered during SIV/Mtb co-infection.Figure 2

Myeloid cell function in granulomas is altered during SIV/Mtb co-infection. (A) Volcano plots of differential gene expression in myeloid cells in whole granulomas between groups. Each point represents 1 gene; horizontal dotted lines indicate adjusted P values at 0.05 and vertical lines indicate 1 and –1 log2(fold change). Wald test, design ~ batch + treatmentgroup. (B) GSEA (reduced redundancy) of all myeloid cells in granulomas between groups. Pathways are from WebGestalt using the Reactome database, with statistical significance set at a false discovery rate of less than 0.05. Only pathways with adjusted P values of less than 0.05 are shown. (C) Z scores of gene expression in genes from proinflammatory pathways in all myeloid cells from granulomas in each group. Genes are z scored by row.

DEGs from all granuloma T cells were also compared between groups (Figure 3A). As with myeloid cells, the SIV/Mtb T cell transcriptome was distinct from both SIV/ART/Mtb T cells (1032 DEGs; Supplemental Table 4) and Mtb-only T cells (1412 DEGs; Supplemental Table 4). SIV/ART/Mtb and Mtb-only T cell transcriptomes were more similar in gene expression patterns to each other (116 DEGs; Supplemental Table 4 and Figure 3A). Based on GSEA, T cells from the SIV/Mtb group had a significant expression of gene expression pathways related to T cell activation and signaling, including co-stimulation by CD28, PD-1 signaling, and IL-2 family signaling, compared with T cells in either the SIV/ART/Mtb or Mtb-only group (Figure 3B, Supplemental Figure 4, and Supplemental Table 5). Enrichment of DEGs in these pathways in SIV/ART/Mtb and Mtb-only T cells was similar (Figure 3C and Supplemental Table 5). Thus, T cells in SIV/Mtb granulomas were overall less activated and had less downstream signaling than SIV/ART/Mtb and Mtb-only T cells, which ART was able to restore to a similar level to that of T cells in Mtb-only granulomas.
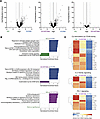
T cell function in granulomas is altered during SIV/Mtb co-infection.Figure 3

T cell function in granulomas is altered during SIV/Mtb co-infection. (A) Volcano plot of differential gene expression in all T cells in granulomas between groups. Each point is 1 gene; horizontal dotted lines indicate adjusted P values at 0.05 and vertical lines indicate 1 and –1 log2(fold change). Wald test, design ~ batch + treatmentgroup. (B) GSEA (reduced redundancy) of all T cells in granulomas between groups. Pathways are from WebGestalt using the Reactome database, with statistical significance set at a false discover rate of less than 0.05. Only pathways with adjusted P values of less than 0.5 are shown. (C) Z score of gene expression in genes from T cell activation and signaling pathways in all T cells in granulomas in each group. Genes are z scored by row.

Spatial distinction between the inner and outer portions of the granulomas among myeloid cell and T lymphocyte function is impaired during co-infection. As granulomas are highly structured environments, expression patterns of myeloid cell ROIs from the inner and outer rings of granulomas within each group were compared to understand how these transcriptional changes were spatially patterned. The transcriptomes of the inner and outer myeloid cells in Mtb-only granulomas were distinct from each other, with 1067 DEGs in the inner region compared with the outer region (Figure 4A and Supplemental Table 6). Enriched DEGs in myeloid cells in the inner versus outer regions of these Mtb-only granulomas were predominantly in pathways related to metabolism and antimicrobial function (Supplemental Table 7). In contrast, the transcriptomes of myeloid cells in SIV/Mtb granulomas in inner and outer regions were less distinct from each other (401 DEGs; Figure 4A and Supplemental Table 6), with a few unique pathways in the inner cellular ring (Supplemental Table 7). Spatial analysis of gene expression in SIV/ART/Mtb myeloid cells revealed that gene expression in the inner and outer rings was not as spatially distinct as in the Mtb-only group (293 DEGs; Figure 4A and Supplemental Table 7), although the DEGs were enriched in pathways also present in Mtb-only granulomas (Supplemental Table 7). Thus, while ART can restore some overall cellular functions in granulomas, it does not fully restore the spatial arrangement of their functions.
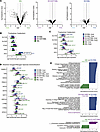
Spatial organization of myeloid cell function in granulomas is impaired durFigure 4

Spatial organization of myeloid cell function in granulomas is impaired during co-infection. (A) Volcano plots of differential gene expression in inner versus outer region myeloid cells in granulomas among groups. Each point represents 1 gene; horizontal dotted lines indicate adjusted P values at 0.05 and vertical lines indicate 1 and –1 log2(fold change). Wald test, design ~ batch + location. (B) Log2-transformed expression of genes involved in tryptophan catabolism among all granuloma myeloid cells. Genes from the GSEA leading edge. Wald test, design ~ batch + treatmentgroup. Only adjusted P values of less than 0.05 are indicated. (C) Log2-transformed expression of genes involved in tryptophan catabolism between inner versus outer regions of granuloma myeloid cells. Genes from the GSEA leading edge. Wald test, design ~ batch + location. Only adjusted P values of less than 0.05 are indicated. (D) Log2-transformed expression of genes involved in reactive oxygen and nitrogen species detoxification in inner versus outer regions of granuloma myeloid cells. Genes from the GSEA leading edge. Wald test, design ~ batch + location. Only adjusted P values of less than 0.05 are indicated. (E) GSEA (redundancy reduced) comparing myeloid cells in the inner region by group. Pathways are from WebGestalt using the Reactome database, with statistical significance set at a false discovery rate of less than 0.05. Only pathways with adjusted P values of less than 0.05 are shown.

One pathway seen in the Mtb inner ring of myeloid cells (Supplemental Table 7) and previously described in TB is the metabolism of the essential amino acid tryptophan (22, 23). Starvation of tryptophan in the local environment is one mechanism by which myeloid cells can kill intracellular pathogens (24). Indoleamine 2,3-dioxygenase 1 (IDO1) is the rate-limiting enzyme that mediates the breakdown of tryptophan. Overall IDO1 expression was upregulated in SIV/Mtb granulomas compared with both SIV/ART/Mtb and Mtb-only granulomas (Figure 4B). When assessed spatially, genes from multiple steps in catabolism of tryptophan were upregulated specifically in myeloid cells in the inner ring of Mtb-only granulomas and downregulated in the outer ring (Figure 4C), as previously observed (19). However, the spatially distinct differential expression of most genes was absent in myeloid cells between the inner and outer rings in both SIV/ART/Mtb and SIV/Mtb granulomas, which had similarly high expression of these genes throughout the granuloma and in which the outer ring lacked downregulated expression (Figure 4C). A similar pattern of expression was also seen for reactive oxygen/nitrogen species (ROS/RNS) detoxification, another mechanism by which myeloid cells can eliminate intracellular pathogens (24). Myeloid cells from the inner ROI had higher expression of genes in the ROS/RNS detoxification pathway compared with outer region ROIs of Mtb-only granulomas (Figure 4D). In contrast, the distinction between inner and outer myeloid cell ROIs from SIV/Mtb and SIV/ART/Mtb granulomas in this pathway was lost (Figure 4D), suggesting that these granulomas do not restrict expression of these genes to the inner region as observed in Mtb-only granulomas. Finally, expression patterns in myeloid cell ROIs from the inner and outer regions were compared between groups directly (Figure 4E, Supplemental Figure 5, and Supplemental Tables 8–11). GSEA showed that DEGs in the myeloid cells in the inner region of SIV/Mtb granulomas, where the majority of myeloid cells are located, were enriched in collagen biosynthesis and proinflammatory pathways, including type I IFN signaling, complement responses, and cytokine signaling, compared with both SIV/ART/Mtb and Mtb-only granulomas (Figure 4E and Supplemental Table 9). In contrast, Mtb-only myeloid cells in the inner region were enriched in DEGs from pathways related to gene expression and protein synthesis (translation initiation and elongation) (Figure 4E and Supplemental Table 9). Thus, the overall increased proinflammatory environment in the inner region of granulomas during SIV co-infection is driven by myeloid cells within the inner region, which is not corrected by early suppressive ART.

A parallel analysis of the spatial pattern among the inner and outer rings of granuloma T cells in each group was performed. As with myeloid cells, T cells in the inner and outer regions of Mtb-only granulomas had very distinct gene expression patterns from each other (981 DEGs; Figure 5A and Supplemental Table 12). T cells in the inner region were dominated by enrichment in DEGs from pathways related to metabolism and biosynthesis, whereas the outer ring was enriched in protein synthesis DEGs (Supplemental Table 13). This spatial pattern was impaired in SIV/Mtb and SIV/ART/Mtb granulomas, in which a more homogeneous gene expression pattern was observed, with fewer DEGs between the inner and outer rings (Figure 5A). Gene expression from T cells SIV/ART/Mtb granulomas were less spatially distinct than Mtb-only granulomas, with 439 DEGs (Supplemental Table 12), although the pattern of DEG enrichment was similar: an inner region of metabolism and biosynthesis and outer ring of protein synthesis (Supplemental Table 13). Finally, only 9 DEGs were identified between the inner and outer rings of SIV/Mtb granuloma T cells, with similar expression in the inner and outer regions and with no differentially expressed pathways (Figure 5A and Supplemental Tables 12 and 13).
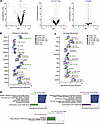
Spatial organization of T cell function in granulomas is impaired during coFigure 5

Spatial organization of T cell function in granulomas is impaired during co-infection. (A) Volcano plots of differential gene expression in inner versus outer region T cells in granulomas among groups. Each point represents 1 gene; horizontal dotted lines indicate adjusted P values at 0.05 and vertical lines indicate 1 and –1 log2(fold change). Wald test, design ~ batch + location. (B) Log2-transformed expression of genes involved in IFN-γ signaling between inner and outer region T cells in granulomas. Genes from the GSEA leading edge. Wald test, design ~ batch + treatmentgroup. Only adjusted P values of less than 0.05 are indicated. (C) Log2-transformed expression of genes involved in glucose metabolism between inner versus outer region T cells. Genes from the GSEA leading edge. Wald test, design ~ batch + treatmentgroup. Only adjusted P values of less than 0.05 are indicated. (D) GSEA (redundancy reduced) comparing T cells in the outer region by group. Pathways are from WebGestalt using the Reactome database, with statistical significance set at a false discovery rate of less than 0.05. Only pathways with adjusted P values of less than 0.05 are shown.

This spatial distinction was exemplified in the IFN-γ signaling pathway, among the most enriched immune DEGs in inner ring T cells, in which T cells in the inner region had higher expression of IFN-γ signaling genes than the outer ring in Mtb-only granulomas (Figure 5B). Some, but not all, T cell genes in the IFN-γ pathway in SIV/ART/Mtb granulomas had a similar differential pattern to that of Mtb-only T cells (Figure 5B). However, this differential pattern of expression was not observed in SIV/Mtb granuloma T cells, where gene expression was similar in the inner and outer rings (Figure 5B). Upstream of IFN-γ signaling, there was an overall overexpression of most genes related to IFN-γ production in T cells in Mtb-only granulomas relative to SIV/Mtb, although this pattern was not spatially distinct (Supplemental Figure 6). The spatial pattern of glucose metabolism was similarly differentiated in Mtb-only T cells, with higher expression in the inner ROIs than the outer ROIs, whereas the SIV/Mtb group had similar gene expression levels in both regions (Figure 5C). Lastly, the SIV/ART/Mtb granulomas also had an intermediate phenotype where expression of some genes in the glucose metabolism pathway was differentially expressed by region and others were not (Figure 5C).

In addition to comparing gene expression of T cells in the inner versus outer regions in each group, the gene expression patterns of T cells in the outer and inner granuloma regions were compared directly between groups (Figure 5D, Supplemental Figure 7, and Supplemental Tables 14–17). In the outer ring of the granuloma, where the majority of T cells are localized, SIV/Mtb T cells were enriched in DEGs from metabolic (respiratory electron transport, fatty acyl-CoA biosynthesis) and immune pathways (complement cascade, type I IFN) (Figure 5D). Whereas T cells from the outer ring of Mtb-only and SIV/ART/Mtb granulomas were enriched in DEGs from pathways related to T cell activation and signaling (CD28 co-stimulation) compared with SIV/Mtb outer T cell ROIs (Figure 5D). This decrease in T cell signaling and activation in SIV/Mtb granulomas, driven by the outer region T cells, may be associated with perturbed interactions with infected macrophages in granulomas, and thus contributes to increased bacterial burden compared with granulomas in animals infected with only Mtb.

To confirm that these spatially disrupted transcriptional differences in co-infected groups also reflected protein expression, serial sections of the granulomas were stained for IDO1 (Supplemental Figure 10). Granulomas from Mtb-only NHPs had more clearly defined IDO1 protein expression within the inner regions of granulomas. Granulomas from SIV/Mtb NHPs had more heterogeneous staining patterns, while granulomas from SIV/ART/Mtb had a more intermediate phenotype, as reflected in the transcriptional analysis.

SIV RNA within co-infected granulomas is present within both macrophages and T cells. SIV can infect cells within granulomas (11, 12), and both SIV and HIV can alter the function of both macrophages and T cells (25–32). However, the extent to which SIV infects macrophages versus T cells in granulomas is unclear. To assess which cells were SIV infected and where in these granulomas SIV-infected cells were localized, serial sections of granulomas were stained with RNAscope probes specific for SIV as well as markers for macrophages (CD68 and CD11c) and T cells (CD3). SIV-infected cells were identified as triple positive for SIV RNA, DAPI, and their respective cell markers. SIV/Mtb granulomas had higher viral RNA frequencies, which were similar in macrophages and T cells, with a median of 44% of macrophages and 38% of T cells containing detectable SIV RNA, with some heterogeneity among individual granulomas (Figure 6 and Supplemental Figure 8). SIV/ART/Mtb granulomas, in which SIV RNA was undetectable by qRT-PCR (16), had lower detectable SIV RNA frequencies in both macrophages (median 3%) and T cells (median 5%) (Figure 6 and Supplemental Figure 8). SIV RNA was also throughout the granuloma, from the outer lymphocyte cuff into the myeloid region (Figure 6A). As SIV can infect both macrophages and T cells in granulomas, the function of both cell types may be perturbed by viral infection, which is likely associated with the differences in both myeloid and T cell transcriptional changes throughout the granuloma and poor control of Mtb burden in granulomas.
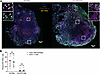
SIV infection within co-infected granulomas is distributed in both myeloidFigure 6

SIV infection within co-infected granulomas is distributed in both myeloid cells and T cells. (A) RNAscope (SIV gag and pol; yellow) and immunohistochemistry (CD3+ T cells, green; CD11c/CD68+ myeloid cells, magenta) staining in SIV/Mtb (left) and SIV/ART/Mtb (right) granulomas. Scale bars: 100 μm. (B) Median percentages (with IQR) of myeloid cells (CD68+CD11+DAPI+; magenta) and T cells (CD3+DAPI+; green) that had detectable SIV RNA. SIV/Mtb: macrophages median 44.5% (IQR values: 22.0%, 45.9%). SIV/Mtb: T cells median 38.6% (IQR values: 20.3%, 41.6%). SIV/ART/Mtb: macrophages median 3.6% (IQR values: 2.1%, 4.5%). SIV/ART/Mtb: T cells median 4.7% (IQR values: 1.2%, 5.7%). Mann-Whitney with Holm-Šidák multiple-comparison adjustment. n = 7 granulomas from 5 SIV/Mtb animals (1–2 granulomas per animal) and 7 granulomas from 6 SIV/ART/Mtb animals (1–2 granulomas per animal).

Spatial analysis of ligand-receptor pair communication within granulomas. To understand how macrophages and T cells interact with each other and how that communication could be altered by SIV in granulomas, cell-cell communication was assessed using CellChat. CellChat compares gene expression of ligands and receptors in cells and uses a database of known ligand-receptor pairs to determine which cells are likely to be communicating with each other (33). ROIs were grouped into inner macrophages, outer macrophages, inner T cells, and outer T cells to compare communication in granulomas across groups in a spatial context. The cellular communication network of these ROIs was visualized by mapping the strength of ligand-receptor interactions between cell types, with interaction strength defined by the degree of expression of ligands and receptors. This spatially informed communication network showed that the network edges, which represent the strength of interactions between ROIs, were weaker in SIV/Mtb granulomas, particularly between inner T cells and both inner and outer macrophages, compared with the strength of interactions between inner and outer macrophages, which was comparable between groups (Figure 7, A–C). Communication strength in SIV/ART/Mtb granulomas had an intermediate phenotype, with stronger communication between inner T cell ROIs and inner and outer macrophage ROIs than in SIV/Mtb granulomas but not as strong as Mtb-only granulomas (Figure 7, A–C). This pattern in the reduction in strength of cell-cell communication in the context of SIV/Mtb co-infection was also true when considering the number of interactions between cell groups, particularly inner region T cell communication with outer and inner region macrophages (Supplemental Figure 9, A–C).
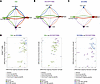
Analysis of cell-cell communication in granulomas.Figure 7

Analysis of cell-cell communication in granulomas. (A–C) Aggregated cell-cell communication networks between inner and outer myeloid cells and T cells in (A) Mtb-only granulomas, (B) SIV/ART/Mtb granulomas, and (C) SIV/Mtb groups. Arrows indicate signal senders to signal receivers. Colors indicate sender group: green is outer myeloid cells, red is inner myeloid cells, purple is outer T cells, and blue is inner T cells. Arrow thickness is proportional to the strength of ligand-receptor interactions. Node size is proportional to the number of ROIs in that cell type. (D) Ligand-receptor signaling strength changes in inner T cells summarized as pathways in each paired comparison of Mtb versus SIV/Mtb (left), Mtb versus SIV/ART/Mtb (middle), and SIV/Mtb versus SIV/ART/MTB (right) groups. Each symbol indicates a pathway, color indicates group, shape indicates signal direction. Overexpression of a signaling genes was determined using the Wilcoxon rank-sum test with significance set at an adjusted P value of less than 0.05. Communication probability was determined as described in Jin et al. (33).

To further characterize these defects in cellular communication and their directionality, the summative incoming and outgoing interaction strength of sending and receiving spatially defined cell types was visualized. While T cells throughout the granuloma had lower overall interactions relative to inner and outer macrophages, both incoming and outgoing signaling in T cells in the inner region specifically were decreased in the SIV/Mtb and SIV/ART/Mtb granulomas compared with Mtb-only granulomas (Supplemental Figure 9B). Inner T cells were located in the same region of granulomas as the Mtb-infected macrophages, and thus, reduction in their signaling to macrophages may reflect a mechanism of impaired bacterial control during SIV/Mtb co-infection. To identify the signaling pathways that comprised this defect in communication from the inner region T cells, pathways with differential ligand-receptor signaling in each spatially informed cell type were compared across groups (Figure 7D). Inner region T cells in Mtb-only granulomas were enriched in DEGs from signaling pathways related to cellular migration, adhesion, and migration relative to SIV/Mtb inner region T cells, including signaling through intracellular adhesion molecule (ICAM), fibronectin (FN1), adhesion G protein–coupled receptors (ADGRL), and thrombospondin (THBS) (Figure 7D). Signaling in these pathways was also reduced to a lesser extent compared with SIV/ART/Mtb inner region T cells (Figure 7D). The decreased communication in these SIV/Mtb granulomas between inner T cells and both inner and outer myeloid cells as well as among T cells is consistent with GSEA data demonstrating a reduction in T cell signaling pathways. Decreased signaling in these pathways may also reflect dysregulation in myeloid cell and T cell interactions, and thus a greater opportunity for bacterial dissemination and increased bacterial burden, which may be correlated with the increase in extrapulmonary disease seen in SIV/Mtb and SIV/ART/Mtb animals (16).
Discussion

The granuloma is the centerpiece of immune cell interactions during Mtb infection, in which immune cells are recruited to the site of infection in a highly organized architectural structure, starting from a central area of Mtb-infected myeloid cells, such as macrophages and dendritic cells, with or without necrosis surrounded by peripheral zones of lymphocytes. Insights into the complex interactions within the highly organized immune landscape of the granuloma (both regional and cell-to-cell) have only recently been undertaken with the advent of novel spatial, systems immunology, and computational techniques. In this study, IDO1 expression was limited to the inner myeloid region of Mtb granulomas. Similar to our findings, granulomas from Mtb-infected NHPs and humans have been shown to produce IDO1 within the central myeloid areas (19, 22, 34), and closely positioned near the lymphocytic cuff. Some have speculated that IDO1 may play a key role in immune suppression near the hypoxic central area of the granuloma, an area of high Mtb burden, to prevent excessive inflammation (20). This area of hypoxia may also be a dominant driver of the complex immune interactions at this interface between the inner and outer rings of granulomas observed in our study. Our work contributes to the field by highlighting the functionally distinct nature of each zone composing the granuloma during Mtb infection and demonstrating that this distinction is lost during SIV/Mtb co-infection that is associated with high Mtb burden and poor clinical outcome.

The HIV/Mtb syndemic continues to be major cause of morbidity and mortality worldwide (1, 3), and yet understanding the mechanisms that lead to worse outcomes in co-infection are difficult to study in humans, as infection order and duration are typically unknown or imprecise and relevant tissue cannot easily be obtained antemortem. We used an NHP model of HIV/Mtb co-infection that recapitulates human infection where Mtb and SIV infection as well as ART administration are highly controlled. We and others have shown that SIV RNA copies can be found in granulomas (12, 35), and our data further show that SIV infects both myeloid cells and T cells within granulomas at similar frequencies. Our data instead emphasize that co-infection leads to a disruption in the zonal organization of cell function and cell-cell communication rather than a disruption of granuloma architecture. SIV/Mtb granulomas exhibit more proinflammatory environments, with enrichment in DEGs from pathways involving type I IFN signaling, than Mtb-only or SIV/ART/Mtb granulomas, particularly within myeloid cells. T cells in SIV/Mtb granulomas were less enriched in DEGs from activation and downstream signaling pathways and had an overall reduction in communication among myeloid cells and T cells, particularly in signaling pathways related to collagen, cell migration, and cell adhesion, which were only partially restored in SIV/ART/Mtb granulomas, which lack viral replication.

Type I IFN (IFN-α and -β) signaling is a canonical antiviral immune response that mediates the upregulation of IFN-stimulated genes through JAK/STAT signaling (36). These responses are upregulated during HIV infection (36, 37) and are necessary to stimulate innate immune responses early in infection (38). However, type I IFN signaling in TB is less understood and has been correlated with more severe outcomes of infection and higher bacterial burden (39–42). Moreover, sustained type I IFN leads to a compensatory increase in suppressive IL-10 and dysfunctional T cells, impairing the balance necessary for successful clearance of Mtb (43). In the present study, gene expression from type I IFN signaling was enriched in myeloid cells in SIV/Mtb granulomas relative to both Mtb-only and SIV/ART/Mtb granulomas, suggesting that unsuppressed viral replication is associated with a more pronounced proinflammatory response. Whether this causes higher Mtb burden or results from that higher Mtb burden is unclear from this single-time-point study. A proinflammatory milieu may skew the phenotype of activated macrophages, which are polarized into M1 or M2 phenotypes based on the local microenvironment, such that M1 macrophages are proinflammatory while M2 macrophages are antiinflammatory and associated with wound healing (44). Studies using a combination of NHP samples and in silico modeling have demonstrated that an initial proinflammatory environment in granuloma macrophages is necessary for eventual bacterial containment of Mtb, but that prolonged proinflammatory polarization is detrimental for controlling dissemination (45). Thus, sustained proinflammatory IFN signaling in the SIV/Mtb myeloid cells compared with the Mtb-only and SIV/ART/Mtb myeloid cells may contribute to their higher bacterial burden, although further studies are necessary to determine causality.

Tryptophan catabolism has been recognized to play an important role in TB granulomas and spatially organized tryptophan catabolism in Mtb granulomas has also been observed previously in granulomas during Mtb-only infection (19, 22). Tryptophan catabolism is immunosuppressive; it skews T cell polarization towards regulatory T cells and reduces T cell proliferation (46, 47), and can promote M2 polarization in myeloid cells (48). IDO1, the rate-limiting enzyme in tryptophan catabolism, has also been studied as a potential biomarker for TB disease in humans (49, 50). While IDO1 inhibition reduced bacterial burden during early Mtb infection in a highly susceptible macaque model (22), it did not alter burden during SIV/Mtb co-infection with ART despite improved quality of immune responses (21). In this study, SIV/Mtb granulomas did not have downregulated IDO1 expression in the outer region and instead had an altered spatial pattern with higher levels of IDO1 throughout the granuloma. The role of IDO1 in Mtb outcomes is likely multifactorial and complex, as it has been observed in granulomas with both non-viable and viable Mtb (20). T cell–derived IFN-γ, also known as type II IFN, has been the focus of T cell–mediated immunity to TB (reviewed in ref. 51). CD4+ T cell secretion of IFN-γ activates macrophages for elimination of phagocytosed pathogens (reviewed in ref. 52), and has been shown to be important in the control of Mtb infection in mice (53, 54), although IFN-independent mechanisms of control have also been demonstrated (55, 56). TB vaccine studies using peripheral IFN-γ production as a correlate of protection have not yielded consistent results (57), although recent studies in NHPs have shown that airway T cell production of IFN-γ may be a better predictor of protective immunity (58). In this study, expression of genes in the IFN-γ signaling pathway, but not IFN-γ production pathway, in granuloma T cells was spatially differentiated within the inner and outer regions of Mtb-only granulomas but not spatially differentiated within SIV/Mtb granulomas. This added context provides insight into how the spatial distribution of effector IFN-γ signaling may play a larger role in infection outcomes. Also, glucose metabolism in T cells was spatially differentiated in Mtb-only but not SIV/Mtb granulomas. Glucose metabolism by T cells has been linked to their activation and effector function (ref. 59 and reviewed in ref. 60). These findings are also consistent with differences in glucose metabolism observed between Mtb-only and SIV/Mtb groups, as T cell activation is associated with shifts in glucose metabolism (the Warburg effect) as oxidative phosphorylation and fatty oxidation pathways shift to aerobic glycolysis despite available oxygen (reviewed in ref. 61). Infection of CD4+ T cells by HIV has been shown to increase the metabolism of glucose in T cells (62), and HIV replication is enhanced by cellular use of glycolysis (63). In the co-infected granulomas in this study, SIV can be found throughout both myeloid and T cell regions of the granuloma, which may be related to the lack of spatial restriction of enrichment of glucose metabolism pathway genes to the outer ring in SIV/Mtb granulomas. In both these T cell pathways, ART did not restore the spatial distinction of all gene expression. The data from this study highlight how granuloma success or failure in bacterial containment is associated with immune cell interactions in the granuloma, particularly between myeloid cells and T cells, and provides better understanding of the spatial context of that communication. Other studies investigating the spatial dynamics of Mtb granulomas have also shown that granulomas are highly organized, and that protective responses to Mtb in granulomas are not a dichotomous beneficial antiinflammatory or harmful proinflammatory environment. Instead, studies have shown that an initial proinflammatory response is critical to bacterial control, but that sustained proinflammatory responses are detrimental to granuloma control of Mtb (45, 64). This study demonstrates how SIV co-infection impairs the organization of cellular function within the granuloma, such that SIV/Mtb granulomas are overall more inflammatory environments throughout the entire granuloma and antimycobacterial functions are no longer contained to the inner region as in Mtb-only granulomas. This organization may be required to prevent ongoing immunopathology as has been seen in other Mtb granulomas (9).

We also show that ART can restore some, but not all, aspects of cellular functional impairment in granulomas. ART-treated animals did not have granulomas with spatially differentiated cellular function to the same extent as Mtb granulomas, but they had less inflammatory environments, stronger cell-cell communication, and ultimately lower bacterial burden relative to granulomas from ART-naive SIV/Mtb animals. This suggests that SIV infection in the absence of ongoing replication with very early ART suppression still alters the spatially distinct regions of the granuloma. By demonstrating that SIV infects macrophages as well as T cells within granulomas, this study also provides another potential source of cellular dysregulation that may be associated with poor bacterial control.

This study was limited in that the GeoMX platform is not a single-cell assay, and as such the resolution per ROI was a median of 187 cells. Therefore, the conclusions should be interpreted as changes within groups of cells in granuloma regions rather than changes in individual cells. Cell-cell communication was assessed by labeling ROIs as in either the inner or outer ring, which limits resolution in spatial analysis. Due to the limitations of the number of antibodies for immunophenotyping with this platform, CD68 was used to define all myeloid cells. Myeloid cell ROIs in this study also likely include nearby neutrophils in addition to macrophages. The differential expression of S100A8 and S100A9 proteins, classically although not exclusively found in neutrophils (65), further supports the notion that this myeloid cell subset includes neutrophils as well as macrophages. Thus, these findings should be considered to reflect changes in both cell types. Finally, our data include all CD3+ cells in the T cell subset and do not distinguish between CD4+ and CD8+ T cells. The frequency of CD4+ T cells was significantly reduced in the SIV/Mtb granulomas in this study, which was not observed in SIV/ART/Mtb granulomas (16). As expected, the frequency of CD8+ T cells increased relative to CD4+ T cells in the SIV/Mtb group (16), which could confound the T cell profiles. The SIV/Mtb group in this study contained fewer T cell ROIs, especially in the outer region, as expected, although all T cell ROIs from all groups were filtered during quality control such that they contained equivalent numbers of T cell nuclei (Supplemental Table 18). Thus, the reduction in global T cell signaling cannot be attributed to a specific T cell subset but rather to T cells overall. Lastly, while we can identify SIV+ cells in granulomas, identifying viable Mtb on a single-cell basis is not yet technologically available.

This study raises important questions about the cellular interactions in the granuloma that may be important for controlling TB disease burden in the context of HIV co-infection, including during suppressive ART. It is likely that TB development, both alone and in the context of co-infection, is multifactorial and may be influenced by cellular function, bacterial burden, and immune activation, among other factors. The data presented here show that the spatial organization of cell function within granulomas is notably altered in co-infection and highlights that SIV/Mtb granulomas are more proinflammatory environments. Other recent multimodal work in the field has also demonstrated the importance of spatial relationships in TB granulomas, showing that elevated expression of IDO1 and normal oxygen tension were associated with T cell infiltration with higher bacterial burden, whereas the absence of T cells was observed with areas of low IDO1 expression and hypoxia (20). The disrupted microenvironment represented by widespread IDO1 expression patterns seen in granulomas from the co-infected animals here also supports a loss of containment of these regions, leading to worse TB outcomes. Newer spatial transcriptomics platforms that can more closely approximate single-cell resolution will be useful to disentangle the interactions between specific subsets of myeloid and T cells. Further work is needed to understand whether modulation of differentially expressed pathways identified in this analysis can rescue cell-cell communication in the context of viral co-infection, which will be necessary to elucidate the precise mechanisms driving these differences in disease outcomes, and may lead to development of targets for host-directed therapies and vaccine development.

Methods

Sex as a biological variable. This study encompassed samples from 21 male NHPs and 2 female NHPs (Supplemental Table 1) due to limitations in availability of female NHPs. The 2 female NHPs were in the SIV/Mtb group (1 NHP) and the SIV/ART/Mtb group (1 NHP).

Animal care and infections. Chinese cynomolgus macaques aged 5–8 years (Supplemental Table 1) were purchased from Valley Biosystems and randomized to Mtb-only (n = 10), SIV/Mtb (n = 9), or SIV/ART/Mtb (n = 10) infection groups. SIV-infected macaques were infected with 7 × 10⁴ infectious units (IU) SIVΔB670 (ARP-633, HIV Reagent Program) intravenously and randomized to either daily ART (tenofovir [20 mg/kg], emtricitabine [40 mg/kg], and dolutegravir [2.5 mg/kg] subcutaneously) beginning 3 days after SIV infection or no ART. SIV/Mtb animals (at 4 months of SIV infection) and Mtb-only animals were infected with low-dose (8–17 colony-forming units [CFU]) barcoded Mtb Erdman strain (66) via bronchoscopic instillation as previously described (67, 68). Animals were housed at a BSL-3 NHP facility in the Regional Biocontainment Laboratory at the University of Pittsburgh after Mtb infection. Mtb infection was confirmed by presence of granulomas on serial PET-CT as previously described (69–71). SIV and Mtb disease progression was monitored by serial peripheral blood draw (plasma viremia, immune responses, erythrocyte sedimentation rate), bronchoalveolar lavage (immune responses, Mtb growth), gastric aspirate (Mtb growth), PET-CT, and daily clinical examination.

Necropsy, tissue processing, Mtb quantitation, and SIV quantitation. Animals were necropsied as previously described (72). In summary, PET-CT–matched granulomas from the lung, lymph node, and other sites as well as grossly appearing lung and lymph node, were excised and assessed for immune responses, histopathology, bacterial burden, and viral burden. TB lesions and other tissues were divided in half such that was placed in formalin after excision and then processed into formalin-fixed, paraffin-embedded (FFPE) blocks and half was homogenized for assessment of bacterial burden, viral burden, and immune responses. To quantify Mtb burden, tissue homogenates were plated on 7H11 plates to assess CFU and estimated CFU per granuloma was calculated as previously described (72). Homogenates were also stored in Trizol LS for assessment of viral burden, and then RNA was extracted as previously described (16). SIV in tissue was quantified by qRT-PCR also as previously described (16, 73, 74) using SuperScript III First-Strand Synthesis SuperMix (Thermo Fisher Scientific) for cDNA synthesis, SsoAdvanced Universal Probes Supermix (Bio-Rad) for qPCR, with primers and probes for SIVΔB670 (forward 5′-GTCTGCGTCATTTGGTGCATTC-3′, reverse 5′-CACTAGATGTCTCTGCACTATTTGTTTTG-3′, probe FAM-CGCAGAAGAGAAAGTGAAACATACTGAGGAAG-TAMRA). Tissue SIV RNA was normalized per 1 × 10⁶ CD4 RNA. CD4+ T cell frequencies in granulomas were measured with flow cytometry as previously described (16). Briefly, granuloma single-cell homogenates were incubated with media and Brefeldin A for 4 hours and stained with antibodies as previously described (16). Samples were run on an LSR II (BD) and analyzed with FlowJo software v.10.8 (Treestar Inc).

NanoString GeoMX assay. Freshly cut tissue sections 5 μm thick were cut from lung granuloma FFPE blocks (Supplemental Table 1) less than 3 years old (SIV/Mtb n = 7, SIV/ART/Mtb = 8, Mtb = 9 granulomas) and mounted onto positively charged slides (Fisherbrand Superfrost Plus slides, Thermo Fisher Scientific). Granulomas were selected for which there was associated metadata (CFU, SIV RNA, histology; Supplemental Table 1) and which came from different animals within each group. Slides were stained with antibodies against CD68 (Thermo Fisher Scientific, mouse, clone KP1), CD3E (Origene, mouse, clone UMAB54), CD8a (Origine, mouse, clone OTI3H6), and the NanoString GeoMX Human Whole Transcriptome Atlas barcoded RNA probes. The GeoMX platform uses mRNA probes that bind to complementary host mRNA in tissue, and then the probes from specific cell types in each ROI are selectively UV-photocleaved for collection and sequencing using masks based on antibody markers to assess the transcriptome from specific cell types individually; each ROI is thus separated into cell-type-specific areas of interest by antibody-determined cell type in a tissue. (75). There is high homology between the macaque and human genomes (76), and granuloma ROI samples were well above the minimum suggested raw read and aligned read counts, supporting high confidence in cross-reactivity between NHP and human RNA. ROIs in granulomas were chosen based on antibody staining as well as H&E-stained serial sections. The ROIs in the granulomas were drawn in the GeoMX platform using 2 sources of information for histology: (a) the CD68, CD3E, and CD8A antibody staining from the GeoMX staining of the tissue and (b) side-by-side H&E serial sections of the same granuloma to ensure that the regions aligned with the myeloid cell rich inner core and lymphocyte-enriched outer rim. ROIs were manually labeled as “inner,” “outer,” or “mixed” based on their location in granulomas. The granulomas in this analysis were run in 2 batches (denoted in Supplemental Table 1). RNA probes from cell-type-specific ROIs were photocleaved and were sequenced per GeoMX standard processing protocol using NanoString’s nCounter and Digital Spatial Profiler platforms. Raw data were analyzed and quality checked using the NanoString NCTools, GeomxTools (version 3.10.0), and GeoMxWorkflows (version 1.0.1) packages available via Bioconductor (version 3.20; https://bioconductor.org/news/bioc_3_20_release/) using R (version 4.22; https://cran.r-project.org/mirrors.html) and RStudio (version 2023.12.1+402; https://docs.posit.co/ide/user/). All ROIs were filtered to include a minimum of 1000 reads, 80% trimmed reads, 80% stitched reads, 80% aligned reads, 50% sequencing saturation, and 50 μm2 area. Myeloid cell ROIs were additionally filtered to contain between 67 and 670 nuclei, and lymphocyte ROIs were filtered to contain between 70 and 797 nuclei (maximum 10-fold range). ROIs with expressing less than 5% of genes above the limit of detection and genes detected in fewer than 20% of ROIs were filtered out.

Batch correction, differential gene expression, and pathway analyses. Cell-type-specific filtered GeoMx data were batch corrected and differential gene expression was assessed using the DESeq2 (version 1.28.3; https://bioconductor.org/packages/release/bioc/html/DESeq2.html) package available via Bioconductor using R (version 4.22) and RStudio (version 2023.12.1+40 2). Data generated from 2 GeoMx runs were batch corrected in DESeq2 by including batch as the first factor in the analysis design, log2 transforming using variance stabilization, and using the removeBatchEffect function in limma (https://bioconductor.org/packages/release/bioc/html/limma.html). Differential gene expression per cell type in granulomas overall was determined using the Wald statistical test where the design was ~ batch + treatmentgroup. Data included in the overall granuloma comparison included all ROIs from the granulomas regardless of spatial location. Spatially defined differential gene expression per cell type (i.e., inner ROIs versus outer ROIs) within each group was determined using the Wald test where the design was ~ batch + location. Spatially defined differential gene expression per cell type within each region (i.e., inner ROIs compared across groups) among each group was determined using the Wald test where the design was ~ batch + treatmentgroup. Data included in the spatially defined granuloma comparison included “inner” and “outer” ROIs from the granulomas exclusively (i.e., “mixed” ROIs were excluded). Statistical significance for all Wald tests was set at an adjusted P value of less than 0.05. Pathway analysis assessed using GSEA was performed using the WEB-based Gene SeT AnaLysis Toolkit (WebGestalt) (version 2019; https://www.webgestalt.org/) using Reactome and Gene Ontology databases with statistical significance set at a false discovery rate of less than 0.05. DEGs from the leading edge of the pathways were used for visualization.

Cell-cell communication analysis. Cell-cell communication in lung granulomas was assessed using the CellChat package (v2.1.2; https://github.com/jinworks/CellChat) (33), using R (version 4.4.0) and RStudio (version 0.5.0) via the University of Pittsburgh Center for Research Computing’s HTC cluster to compare expression of ligands and receptors in ROIs. The batch-corrected log2-normalized gene expression matrix (gene × ROI) of genes with log2-normalized expression values above zero from GeoMX was used as input. Macrophage and T cell ROIs were tagged in metadata as inner or outer ROIs based on H&E images and GeoMX-stained immunohistochemistry images. In brief, communication probability for ligand-receptor pairs was assessed within in group using 5% truncated mean (i.e., the percentage of ROIs in a group expressing a given ligand or receptor must be above 5%) and then combined into a merged CellChat object for data visualization per developer’s instructions. Overexpression of a signaling genes was determined using the Wilcoxon rank-sum test with significance set at an adjusted P value of less than 0.05. Communication probability was determined as described in Jin et al. (33).

RNAscope and immunohistochemistry. The presence of SIVΔB670 RNA–infected cells was visualized in granulomas using RNAscope 2.5 HD Red (ACDBio). Tissue sections (5 μm thick) were cut from FFPE blocks and mounted onto positively charged slides (Fisherbrand Superfrost Plus slides). RNAscope 2.5 HD Red chromogenic kit (ACDBio, 322360) was used to visualize SIVΔB670 gag and pol mRNA as per the manufacturer’s instructions using ACDBio proprietary custom probes designed for SIVΔB670 gag and pol. Briefly, slides were baked for 30 minutes at 60°C before use and then deparaffinized in a xylene and ethanol immersion series. Slides were pretreated with hydrogen peroxide and ACDBio RNAscope Protease Plus. Microwave-based antigen retrieval was performed using tri-sodium citrate dihydrate buffer. Probes were hybridized to tissue and serially amplified as per the manufacturer’s instructions until signal detection. After signal detection using FastRed, tissues were subsequently stained with antibodies against CD3 (Dako, rabbit polyclonal, catalog A0452; 1:50), CD68 (Thermo Fisher Scientific, mouse, clone KP1; 1:40), and CD11c (Leica, mouse, clone 5D11; 1:40) overnight at 4°C. Secondary antibodies Alexa Fluor 488–preabsorbed anti-rabbit (Abcam, catalog ab150073) and Alexa Fluor 647–preadsorbed anti-mouse (Abcam, catalog ab150119) were used at 1:1000 dilution. Slide autofluorescence was quenched using the TrueVIEW quenching kit (Vector Laboratories, SP-8400) per the manufacturer’s instructions (3-minute incubation after secondary staining). Nuclei were visualized using DAPI in the mounting medium. Stitched images of granulomas were acquired using a widefield Nikon DS-Qi2 microscope (×20 magnification, 0.75 aperture) and analyzed using the Nikon Elements High Content Analysis research package (version 6.10.01; https://www.microscope.healthcare.nikon.com/products/software/nis-elements/software-packages). Images were autodeconvoluted and quantified using a General Analysis 3 algorithm to count DAPI+ cells, DAPI+CD3+ T cells, DAPI+CD68+CD11c+ macrophages, DAPI+CD3+SIV RNA+ infected T cells, and DAPI+CD68+CD11c+SIV RNA+ infected macrophages.

IDO1 immunofluorescence. IDO1 protein expression in granulomas was assessed using immunofluorescence. Tissue sections (5 μm thick) were cut from FFPE blocks of the granulomas and mounted onto positively charged slides (Fisherbrand Superfrost Plus slides). Slides were baked for 30 minutes at 60°C before use and then deparaffinized in a xylene and ethanol immersion series. Antigen retrieval was performed in an instant pot (model: IP-LUX) using tri-sodium citrate dihydrate buffer for 7 minutes. Slides were stained with anti-IDO1 primary antibody (LS Bio, clone OTI2G4; 1:100) at 4°C overnight. Tissues were then stained with secondary antibody Alexa Fluor 647–preabsorbed anti-mouse (Abcam, catalog ab150119) at 1:1000 dilution for 1 hour at room temperature. As with RNAscope images, slide autofluorescence was quenched using the TrueVIEW quenching kit (Vector Laboratories, SP-8400) per the manufacturer’s instructions (3-minute incubation after secondary staining). Nuclei were visualized using DAPI in the mounting medium. Stitched images of granulomas were acquired using a widefield Nikon DS-Qi2 microscope (×20 magnification, 0.75 aperture) and analyzed using the Nikon Elements High Content Analysis research package (version 6.10.01).

Statistics. Statistical comparison of CD4+ T cells in lung granulomas and CFU in lung granulomas was assessed with a random effect model with the animal as the random effect and group and fixed effect, fit using the restricted maximum likelihood (REML) method (JMP Pro 17.2.0) and with Tukey’s HSD–adjusted P values. Statistical comparison of SIV RNA in T cells and myeloid cells was assessed using the Mann-Whitney test with Holm-Šidák adjustment for multiple comparisons. Statistical analyses for differential gene expression (DESeq2), pathway analyses (GSEA), and cell-cell communication probability (CellChat) were as described above. In all visualizations, only statistically significant (adjusted P values < 0.05) comparisons are shown. In the boxplots, the lower bound of the box is the 25th percentile, the upper bound of the box is the 75th percentile, and the line inside the box the median. The whiskers are drawn per Tukey method, where the lower whisker is the smallest value greater than 25th percentile minus 1.5IQR (outlying points are less than this difference) and the upper whisker is the largest value less than 75th percentile plus 1.5IQR (outlying points are greater than this sum).

Study approval. All animal protocols were approved by the University of Pittsburgh Institutional Animal Care and Use Committee in compliance with the Animal Welfare Act and Guide for the Care and Use of the Laboratory Animals.

Data availability. The granuloma spatial transcriptomics data generated with NanoString GeoMX and used in these experiments have been made publicly available through the NCBI Gene Expression Omnibus with accession number GSE327094. Values for all data points in graphs are reported in the Supporting Data Values file.

Manuscript information

Author contributions. ZA and PLL designed the research study, analyzed data, and wrote the manuscript. JMM conducted experiments, acquired data, analyzed data, and wrote the manuscript. JD supervised data analysis and wrote the manuscript. JTM provided reagents and analyzed data. PM analyzed data and conducted statistical analyses. PS, CK, CRD, TR, and EK conducted experiments, acquired data, and analyzed data.

AI disclosure. No AI was used in any part of the research design, data extraction, data analysis, manuscript writing, or figure preparation for the work presented in this study.

Conflict of interest. The authors have declared that no conflict of interest exists.

Funding support. This study was supported by the following:

  • NIH National Institute of Allergy and Infectious Diseases (NIAID) grant R01 AI134195 (to PLL and ZA).
  • NIH NIAID grant T32 AI049820 (to JMM).
  • NIH NIAID grant F31 AI181616 (to JMM).
  • NIH NIAID grant UC7 AI180311 (supporting the operations of the University of Pittsburgh Regional Biocontainment Laboratory [RBL]within the Center for Vaccine Research [CVR]).
  • NIH National Institute of General Medical Sciences grant T32 GM144300 (to University of Pittsburgh MD/PhD program for JMM).
  • NIH Office of the Director grant S10 OD028483 (to the University of Pittsburgh Center for Research Computing and Data [RRID:SCR_022735] through the HTC cluster).
  • The Otis Childs Trust of the Children’s Hospital of Pittsburgh Foundation (to PLL).
  • The Bill and Melinda Gates Foundation (to PLL).

This work is the result of NIH funding, in whole or in part, and is subject to the NIH Public Access Policy. Through acceptance of this federal funding, the NIH has been given a right to make the work publicly available in PubMed Central.

Supplemental material

View Supplemental data

View Supplemental table 1

View Supplemental table 10

View Supplemental table 11

View Supplemental table 12

View Supplemental table 13

View Supplemental table 14

View Supplemental table 15

View Supplemental table 16

View Supplemental table 17

View Supplemental table 18

View Supplemental table 2

View Supplemental table 3

View Supplemental table 4

View Supplemental table 5

View Supplemental table 6

View Supplemental table 7

View Supplemental table 8

View Supplemental table 9

View Supporting data values

Acknowledgments

We thank all the excellent veterinary and laboratory staff at the Tuberculosis Research Group for their hard work and dedication to animal care and sample processing. This study would be impossible without their work. We thank E. Mike Meyer and the NanoString core at the University of Pittsburgh Hillman Cancer Center for staining and sequencing the GeoMX samples and also thank Hanxi Xiao and Mary Cundiff from the Das lab for helpful conversations about systems immunology and bioinformatics analyses. The content is solely the responsibility of the authors and does not necessarily represent the official views of the NIH.

Address for correspondence. Philana Ling Lin, Children’s Hospital of Pittsburgh, Rangos Research Center, 9th floor, 4401 Penn Avenue, Pittsburgh, Pennsylvania 15224, USA. Email: Philana.lin@chp.edu.

Footnotes

Copyright: © 2026, Medrano et al. This is an open access article published under the terms of the Creative Commons Attribution 4.0 International License.

Reference information: JCI Insight. 2026;11(21):e208488.https://doi.org/10.1172/jci.insight.208488.

References
  1. World Health Organization. Global tuberculosis report 2025. https://www.who.int/teams/global-programme-on-tuberculosis-and-lung-health/tb-reports/global-tuberculosis-report-2025 Accessed September 18th, 2026.
  2. Behr MA, et al. Revisiting the timetable of tuberculosis. BMJ. 2018;362:k2738.
    View this article via: CrossRef PubMed Google Scholar
  3. Joint United Nations Programme on HIV/AIDS. 2024 Global AIDS report — The Urgency of Now: AIDS at a Crossroad. https://www.unaids.org/sites/default/files/media_asset/2024-unaids-global-aids-update_en.pdf Accessed September 18th, 2026.
  4. Lawn SD, et al. Burden of tuberculosis in an antiretroviral treatment programme in sub-Saharan Africa: impact on treatment outcomes and implications for tuberculosis control. AIDS. 2006;20(12):1605–1612.
    View this article via: CrossRef PubMed Google Scholar
  5. Cadena AM, et al. Heterogeneity in tuberculosis. Nat Rev Immunol. 2017;17(11):691–702.
    View this article via: CrossRef PubMed Google Scholar
  6. Saunders BM, Cooper AM. Restraining mycobacteria: role of granulomas in mycobacterial infections. Immunol Cell Biol. 2000;78(4):334–341.
    View this article via: CrossRef PubMed Google Scholar
  7. Golden MP, Vikram HR. Extrapulmonary tuberculosis: an overview. Am Fam Physician. 2005;72(9):1761–1768.
    View this article via: PubMed Google Scholar
  8. Martin CJ, et al. A bug’s life in the granuloma. Semin Immunopathol. 2016;38(2):213–220.
    View this article via: CrossRef PubMed Google Scholar
  9. Mattila JT, et al. Microenvironments in tuberculous granulomas are delineated by distinct populations of macrophage subsets and expression of nitric oxide synthase and arginase isoforms. J Immunol. 2013;191(2):773–784.
    View this article via: CrossRef PubMed Google Scholar
  10. Lin PL, et al. Sterilization of granulomas is common in active and latent tuberculosis despite within-host variability in bacterial killing. Nat Med. 2014;20(1):75–79.
    View this article via: CrossRef PubMed Google Scholar
  11. Diedrich CR, et al. SIV and Mycobacterium tuberculosis synergy within the granuloma accelerates the reactivation pattern of latent tuberculosis. PLoS Pathog. 2020;16(7):e1008413.
    View this article via: CrossRef PubMed Google Scholar
  12. Foreman TW, et al. CD4 T cells are rapidly depleted from tuberculosis granulomas following acute SIV co-infection. Cell Rep. 2022;39(9):110896.
    View this article via: CrossRef PubMed Google Scholar
  13. Diedrich CR, et al. Relationship between HIV coinfection, interleukin 10 production, and Mycobacterium tuberculosis in human lymph node granulomas. J Infect Dis. 2016;214(9):1309–1318.
    View this article via: CrossRef PubMed Google Scholar
  14. O’Garra A, et al. The immune response in tuberculosis. Annu Rev Immunol. 2013;31(1):475–527.
    View this article via: CrossRef Google Scholar
  15. Pathak S, et al. Effects of in vitro HIV-1 infection on mycobacterial growth in peripheral blood monocyte-derived macrophages. Infect Immun. 2010;78(9):4022–4032.
    View this article via: CrossRef PubMed Google Scholar
  16. Diedrich CR, et al. Antiretroviral treatment does not prevent extrapulmonary tuberculosis during SIV/Mtb coinfection in macaques. JCI Insight. 2026;11(4):e199314.
    View this article via: JCI Insight CrossRef PubMed Google Scholar
  17. Foreman TW, et al. CD4+ T-cell-independent mechanisms suppress reactivation of latent tuberculosis in a macaque model of HIV coinfection. Proc Natl Acad Sci U S A. 2016;113(38):E5636–E5644.
    View this article via: CrossRef PubMed Google Scholar
  18. Marakalala MJ, et al. Inflammatory signaling in human tuberculosis granulomas is spatially organized. Nat Med. 2016;22(5):531–538.
    View this article via: CrossRef PubMed Google Scholar
  19. McCaffrey EF, et al. The immunoregulatory landscape of human tuberculosis granulomas. Nat Immunol. 2022;23(2):318–329.
    View this article via: CrossRef PubMed Google Scholar
  20. McCaffrey EF, et al. The immunometabolic topography of cellular organization and bacterial control in tuberculosis granulomas. Nat Immunol. 2026;27(4):867–880.
    View this article via: CrossRef PubMed Google Scholar
  21. Singh B, et al. Indoleamine-2,3-dioxygenase inhibition improves immunity and is safe for concurrent use with cART during Mtb/SIV coinfection. JCI Insight. 2024;9(15):e179317.
    View this article via: JCI Insight CrossRef PubMed Google Scholar
  22. Gautam US, et al. In vivo inhibition of tryptophan catabolism reorganizes the tuberculoma and augments immune-mediated control of Mycobacterium tuberculosis. Proc Natl Acad Sci U S A. 2018;115(1):E62–E71.
    View this article via: CrossRef PubMed Google Scholar
  23. Kaushal D, et al. Immune responses in lung granulomas during Mtb/HIV co-infection: implications for pathogenesis and therapy. Pathogens. 2023;12(9):1120.
    View this article via: CrossRef PubMed Google Scholar
  24. Weiss G, Schaible UE. Macrophage defense mechanisms against intracellular bacteria. Immunol Rev. 2015;264(1):182–203.
    View this article via: CrossRef PubMed Google Scholar
  25. Hunegnaw R. Alveolar macrophage dysfunction and increased PD-1 expression during chronic SIV infection of rhesus macaques. Front Immunol. 2019;10:1537.
    View this article via: CrossRef PubMed Google Scholar
  26. Jambo KC, et al. Small alveolar macrophages are infected preferentially by HIV and exhibit impaired phagocytic function. Mucosal Immunol. 2014;7(5):1116–1126.
    View this article via: CrossRef PubMed Google Scholar
  27. Espindola MS, et al. Epigenetic alterations are associated with monocyte immune dysfunctions in HIV-1 infection. Sci Rep. 2018;8(1):5505.
    View this article via: CrossRef PubMed Google Scholar
  28. Roberts ER, et al. Collapse of cytolytic potential in SIV-specific CD8+ T cells following acute SIV infection in rhesus macaques. PLoS Pathog. 2016;12(12):e1006135.
    View this article via: CrossRef PubMed Google Scholar
  29. Collins DR, et al. Functional impairment of HIV-specific CD8+ T cells precedes aborted spontaneous control of viremia. Immunity. 2021;54(10):2372–2384.
    View this article via: CrossRef PubMed Google Scholar
  30. Amelio P, et al. HIV infection functionally impairs Mycobacterium tuberculosis-specific CD4 and CD8 T-cell responses. J Virol. 2019;93(5):–.:e01728-18.
    View this article via: CrossRef PubMed Google Scholar
  31. Ayrga S, Koorsen G. Metabolic reprogramming in HIV+ CD4+ T-cells: implications for immune dysfunction and therapeutic targets in M. tuberculosis co-infection. Metabolites. 2025;15(5):285.
    View this article via: CrossRef PubMed Google Scholar
  32. McKay PF, et al. Global dysfunction of CD4 T-lymphocyte cytokine expression in simian-human immunodeficiency virus/SIV-infected monkeys is prevented by vaccination. J Virol. 2003;77(8):4695–4702.
    View this article via: CrossRef PubMed Google Scholar
  33. Jin S, et al. Inference and analysis of cell-cell communication using CellChat. Nat Commun. 2021;12(1):1088.
    View this article via: CrossRef PubMed Google Scholar
  34. Singh B, et al. Inhibition of indoleamine dioxygenase leads to better control of tuberculosis adjunctive to chemotherapy. JCI Insight. 2023;8(2):e163101.
    View this article via: JCI Insight CrossRef PubMed Google Scholar
  35. Diedrich CR, et al. Reactivation of latent tuberculosis in cynomolgus macaques infected with SIV is associated with early peripheral T cell depletion and not virus load. PLoS One. 2010;5(3):e9611.
    View this article via: CrossRef PubMed Google Scholar
  36. Soper A, et al. Type I interferon responses by HIV-1 infection: association with disease progression and control. Front Immunol. 2017;8:1823.
    View this article via: CrossRef PubMed Google Scholar
  37. Mackelprang RD, et al. Upregulation of IFN-stimulated genes persists beyond the transitory broad immunologic changes of acute HIV-1 infection. iScience. 2023;26(4):106454.
    View this article via: CrossRef PubMed Google Scholar
  38. Harris LD, et al. Downregulation of robust acute type I interferon responses distinguishes nonpathogenic simian immunodeficiency virus (SIV) infection of natural hosts from pathogenic SIV infection of rhesus macaques. J Virol. 2010;84(15):7886–7891.
    View this article via: CrossRef PubMed Google Scholar
  39. Kotov DI, et al. Early cellular mechanisms of type I interferon-driven susceptibility to tuberculosis. Cell. 2023;186(25):5536–5553.
    View this article via: CrossRef PubMed Google Scholar
  40. Moreira-Teixeira L, et al. Type I interferons in tuberculosis: foe and occasionally friend. J Exp Med. 2018;215(5):1273–1285.
    View this article via: CrossRef PubMed Google Scholar
  41. Mundra A, et al. Pathogenicity of type I interferons in Mycobacterium tuberculosis. Int J Mol Sci. 2023;24(4):3919.
    View this article via: CrossRef PubMed Google Scholar
  42. Dorhoi A, et al. Type I IFN signaling triggers immunopathology in tuberculosis-susceptible mice by modulating lung phagocyte dynamics. Eur J Immunol. 2014;44(8):2380–2393.
    View this article via: CrossRef PubMed Google Scholar
  43. Anes E, et al. Role of type I interferons during Mycobacterium tuberculosis and HIV infections. Biomolecules. 2024;14(7):848.
    View this article via: CrossRef PubMed Google Scholar
  44. Lugo-Villarino G, et al. Macrophage polarization: convergence point targeted by mycobacterium tuberculosis and HIV. Front Immunol. 2011;2:43.
    View this article via: CrossRef PubMed Google Scholar
  45. Marino S, et al. Macrophage polarization drives granuloma outcome during Mycobacterium tuberculosis infection. Infect Immun. 2015;83(1):324–338.
    View this article via: CrossRef PubMed Google Scholar
  46. Favre D, et al. Tryptophan catabolism by indoleamine 2,3-dioxygenase 1 alters the balance of TH17 to regulatory T cells in HIV disease. Sci Transl Med. 2010;2(32):32ra36.
    View this article via: CrossRef PubMed Google Scholar
  47. Trabanelli S, et al. Induction of regulatory T cells by dendritic cells through indoleamine 2,3-dioxygenase: a potent mechanism of acquired peripheral tolerance. Curr Med Chem. 2011;18(15):2234–2239.
    View this article via: CrossRef PubMed Google Scholar
  48. Pan J, et al. Harnessing amino acid pathways to influence myeloid cell function in tumor immunity. Mol Med. 2025;31(1):44.
    View this article via: CrossRef PubMed Google Scholar
  49. Suzuki Y, et al. Serum indoleamine 2,3-dioxygenase activity predicts prognosis of pulmonary tuberculosis. Clin Vaccine Immunol. 2012;19(3):436–442.
    View this article via: CrossRef PubMed Google Scholar
  50. Adu-Gyamfi CG, et al. Plasma indoleamine 2, 3-dioxygenase, a biomarker for tuberculosis in human immunodeficiency virus-infected patients. Clin Infect Dis. 2017;65(8):1356–1358.
    View this article via: CrossRef PubMed Google Scholar
  51. Ghanavi J, et al. The role of interferon-gamma and interferon-gamma receptor in tuberculosis and nontuberculous mycobacterial infections. Int J Mycobacteriol. 2021;10(4):349–357.
    View this article via: CrossRef PubMed Google Scholar
  52. Annunziato F, et al. Human Th1 dichotomy: origin, phenotype and biologic activities. Immunology. 2014;144(3):343–351.
    View this article via: CrossRef PubMed Google Scholar
  53. Flynn JL, et al. An essential role for interferon gamma in resistance to Mycobacterium tuberculosis infection. J Exp Med. 1993;178(6):2249–2254.
    View this article via: CrossRef PubMed Google Scholar
  54. Green AM, et al. IFN-γ from CD4 T cells is essential for host survival and enhances CD8 T cell function during Mycobacterium tuberculosis infection. J Immunol. 2013;190(1):270–277.
    View this article via: CrossRef PubMed Google Scholar
  55. Cowley SC, Elkins KL. CD4+ T cells mediate IFN-gamma-independent control of Mycobacterium tuberculosis infection both in vitro and in vivo. J Immunol. 2003;171(9):4689–4699.
    View this article via: CrossRef PubMed Google Scholar
  56. Gallegos AM, et al. A gamma interferon independent mechanism of CD4 T cell mediated control of M. tuberculosis infection in vivo. PLoS Pathog. 2011;7(5):e1002052.
    View this article via: CrossRef PubMed Google Scholar
  57. Macleod M. Learning lessons from MVA85A, a failed booster vaccine for BCG. BMJ. 2018;360:k66.
    View this article via: CrossRef PubMed Google Scholar
  58. Darrah PA, et al. Airway T cells are a correlate of i.v. Bacille Calmette-Guerin-mediated protection against tuberculosis in rhesus macaques. Cell Host Microbe. 2023;31(6):962.
    View this article via: CrossRef PubMed Google Scholar
  59. Chang CH, et al. Posttranscriptional control of T cell effector function by aerobic glycolysis. Cell. 2013;153(6):1239–1251.
    View this article via: CrossRef PubMed Google Scholar
  60. Palmer CS, et al. Glucose metabolism regulates T cell activation, differentiation, and functions. Front Immunol. 2015;6:1.
    View this article via: CrossRef PubMed Google Scholar
  61. Sheedy FJ, Divangahi M. Targeting immunometabolism in host defence against Mycobacterium tuberculosis. Immunology. 2021;162(2):145–159.
    View this article via: CrossRef PubMed Google Scholar
  62. Kang S, Tang H. HIV-1 infection and glucose metabolism reprogramming of T cells: another approach toward functional cure and reservoir eradication. Front Immunol. 2020;11:572677.
    View this article via: CrossRef PubMed Google Scholar
  63. Hegedus A, et al. HIV-1 pathogenicity and virion production are dependent on the metabolic phenotype of activated CD4+ T cells. Retrovirology. 2014;11:98.
    View this article via: CrossRef PubMed Google Scholar
  64. Gideon HP, et al. Variability in tuberculosis granuloma T cell responses exists, but a balance of pro- and anti-inflammatory cytokines is associated with sterilization. PLoS Pathog. 2015;11(1):e1004603.
    View this article via: CrossRef PubMed Google Scholar
  65. Sprenkeler EGG, et al. S100A8/A9 is a marker for the release of neutrophil extracellular traps and induces neutrophil activation. Cells. 2022;11(2):236.
    View this article via: CrossRef PubMed Google Scholar
  66. Martin CJ, et al. Digitally barcoding Mycobacterium tuberculosis reveals in vivo infection dynamics in the macaque model of tuberculosis. mBio. 2017;8(3):–.:e00312-17.
    View this article via: CrossRef PubMed Google Scholar
  67. Capuano SV, et al. Experimental Mycobacterium tuberculosis infection of cynomolgus macaques closely resembles the various manifestations of human M. tuberculosis infection. Infect Immun. 2003;71(10):5831–5844.
    View this article via: CrossRef PubMed Google Scholar
  68. Lin PL, et al. Quantitative comparison of active and latent tuberculosis in the cynomolgus macaque model. Infect Immun. 2009;77(10):4631–4642.
    View this article via: CrossRef PubMed Google Scholar
  69. White AG, et al. Analysis of 18FDG PET/CT imaging as a tool for studying Mycobacterium tuberculosis infection and treatment in non-human primates. J Vis Exp. 2017;(127):56375.
    View this article via: PubMed CrossRef Google Scholar
  70. Lin PL, et al. PET CT identifies reactivation risk in cynomolgus macaques with latent M. tuberculosis. PLoS Pathog. 2016;12(7):e1005739.
    View this article via: CrossRef PubMed Google Scholar
  71. Coleman MT, et al. Early changes by (18)fluorodeoxyglucose positron emission tomography coregistered with computed tomography predict outcome after Mycobacterium tuberculosis infection in cynomolgus macaques. Infect Immun. 2014;82(6):2400–2404.
    View this article via: CrossRef PubMed Google Scholar
  72. Maiello P, et al. Rhesus macaques are more susceptible to progressive tuberculosis than cynomolgus macaques: a quantitative comparison. Infect Immun. 2018;86(2):–.:e00505-17.
    View this article via: CrossRef PubMed Google Scholar
  73. Kline C, et al. Persistence of viral reservoirs in multiple tissues after antiretroviral therapy suppression in a macaque RT-SHIV model. PLoS One. 2013;8(12):e84275.
    View this article via: CrossRef PubMed Google Scholar
  74. Palmer S, et al. New real-time reverse transcriptase-initiated PCR assay with single-copy sensitivity for human immunodeficiency virus type 1 RNA in plasma. J Clin Microbiol. 2003;41(10):4531–4536.
    View this article via: CrossRef PubMed Google Scholar
  75. Zollinger DR, et al. GeoMx™ RNA assay: high multiplex, digital, spatial analysis of RNA in FFPE tissue. Methods Mol Biol. 2020;2148:331–345.
    View this article via: PubMed CrossRef Google Scholar
  76. Yan G, et al. Genome sequencing and comparison of two nonhuman primate animal models, the cynomolgus and Chinese rhesus macaques. Nat Biotechnol. 2011;29(11):1019–1023.
    View this article via: CrossRef PubMed Google Scholar
Version history
  • Version 1 (September 24, 2026): In-Press Preview
  • Version 2 (November 9, 2026): Electronic publication

Article tools

  • View PDF
  • Download citation information
  • Send a comment
  • Terms of use
  • Standard abbreviations
  • Need help? Email the journal

Metrics

  • Article usage
  • Citations to this article

Go to

  • Top
  • Abstract
  • Introduction
  • Results
  • Discussion
  • Methods
  • Manuscript information
  • Supplemental material
  • Acknowledgments
  • Footnotes
  • References
  • Version history
Advertisement
Advertisement

Copyright © 2026 American Society for Clinical Investigation
ISSN 2379-3708

Sign up for email alerts