
Research ArticleEndocrinologyGeneticsMetabolism
Open Access |  10.1172/jci.insight.198799
A familial case of FLAD1 protein deficiency associated with impaired adrenal steroidogenesis
Olga A. Averina,1 Natalia Yu. Kalinchenko,2 Vitaly A. Ioutsi,2 Andrey V. Pirogov,3 Alexander V. Bogachev,1 Oleg A. Permyakov,1 Vitaly S. Buev,1,4 Ekaterina A. Guseva,1,3,4 Anastasia V. Priymak,1,3 Olga A. Bazhanova,5 Mariia A. Emelianova,4 Olga O. Grigoryeva,1 Galina V. Baydakova,5 Maxim A. Abakumov,6 Vasily N. Manskikh,1 Olga A. Dontsova,1,3,4,7 Petr V. Sergiev,1,3,4 and Anatoly N. Tiulpakov5
1Belozersky Institute of Physico-Chemical Biology, Lomonosov Moscow State University, Moscow, Russia.
2Endocrinology Research Centre, Moscow, Russia.
3Faculty of Chemistry, Lomonosov Moscow State University, Moscow, Russia.
4Center for Bio- and Medical Technologies, Skolkovo Institute of Science and Technology, Skolkovo, Russia.
5Research Centre for Medical Genetics, Moscow, Russia.
6Pirogov Russian National Research Medical University, Moscow, Russia.
7Shemyakin–Ovchinnikov Institute of Bioorganic Chemistry, Moscow, Russia.
Address correspondence to: Petr Sergiev, Belozersky Institute of Physico-Chemical Biology, Lomonosov Moscow State University, 119991 Moscow, Russian Federation. Email: petya@genebee.msu.ru.
Authorship note: OAA and NYK contributed equally to this work. PVS and ANT contributed equally to this work.
Find articles by Averina, O. in: PubMed | Google Scholar
1Belozersky Institute of Physico-Chemical Biology, Lomonosov Moscow State University, Moscow, Russia.
2Endocrinology Research Centre, Moscow, Russia.
3Faculty of Chemistry, Lomonosov Moscow State University, Moscow, Russia.
4Center for Bio- and Medical Technologies, Skolkovo Institute of Science and Technology, Skolkovo, Russia.
5Research Centre for Medical Genetics, Moscow, Russia.
6Pirogov Russian National Research Medical University, Moscow, Russia.
7Shemyakin–Ovchinnikov Institute of Bioorganic Chemistry, Moscow, Russia.
Address correspondence to: Petr Sergiev, Belozersky Institute of Physico-Chemical Biology, Lomonosov Moscow State University, 119991 Moscow, Russian Federation. Email: petya@genebee.msu.ru.
Authorship note: OAA and NYK contributed equally to this work. PVS and ANT contributed equally to this work.
Find articles by Kalinchenko, N. in: PubMed | Google Scholar
1Belozersky Institute of Physico-Chemical Biology, Lomonosov Moscow State University, Moscow, Russia.
2Endocrinology Research Centre, Moscow, Russia.
3Faculty of Chemistry, Lomonosov Moscow State University, Moscow, Russia.
4Center for Bio- and Medical Technologies, Skolkovo Institute of Science and Technology, Skolkovo, Russia.
5Research Centre for Medical Genetics, Moscow, Russia.
6Pirogov Russian National Research Medical University, Moscow, Russia.
7Shemyakin–Ovchinnikov Institute of Bioorganic Chemistry, Moscow, Russia.
Address correspondence to: Petr Sergiev, Belozersky Institute of Physico-Chemical Biology, Lomonosov Moscow State University, 119991 Moscow, Russian Federation. Email: petya@genebee.msu.ru.
Authorship note: OAA and NYK contributed equally to this work. PVS and ANT contributed equally to this work.
Find articles by Ioutsi, V. in: PubMed | Google Scholar
1Belozersky Institute of Physico-Chemical Biology, Lomonosov Moscow State University, Moscow, Russia.
2Endocrinology Research Centre, Moscow, Russia.
3Faculty of Chemistry, Lomonosov Moscow State University, Moscow, Russia.
4Center for Bio- and Medical Technologies, Skolkovo Institute of Science and Technology, Skolkovo, Russia.
5Research Centre for Medical Genetics, Moscow, Russia.
6Pirogov Russian National Research Medical University, Moscow, Russia.
7Shemyakin–Ovchinnikov Institute of Bioorganic Chemistry, Moscow, Russia.
Address correspondence to: Petr Sergiev, Belozersky Institute of Physico-Chemical Biology, Lomonosov Moscow State University, 119991 Moscow, Russian Federation. Email: petya@genebee.msu.ru.
Authorship note: OAA and NYK contributed equally to this work. PVS and ANT contributed equally to this work.
Find articles by Pirogov, A. in: PubMed | Google Scholar
1Belozersky Institute of Physico-Chemical Biology, Lomonosov Moscow State University, Moscow, Russia.
2Endocrinology Research Centre, Moscow, Russia.
3Faculty of Chemistry, Lomonosov Moscow State University, Moscow, Russia.
4Center for Bio- and Medical Technologies, Skolkovo Institute of Science and Technology, Skolkovo, Russia.
5Research Centre for Medical Genetics, Moscow, Russia.
6Pirogov Russian National Research Medical University, Moscow, Russia.
7Shemyakin–Ovchinnikov Institute of Bioorganic Chemistry, Moscow, Russia.
Address correspondence to: Petr Sergiev, Belozersky Institute of Physico-Chemical Biology, Lomonosov Moscow State University, 119991 Moscow, Russian Federation. Email: petya@genebee.msu.ru.
Authorship note: OAA and NYK contributed equally to this work. PVS and ANT contributed equally to this work.
Find articles by Bogachev, A. in: PubMed | Google Scholar
1Belozersky Institute of Physico-Chemical Biology, Lomonosov Moscow State University, Moscow, Russia.
2Endocrinology Research Centre, Moscow, Russia.
3Faculty of Chemistry, Lomonosov Moscow State University, Moscow, Russia.
4Center for Bio- and Medical Technologies, Skolkovo Institute of Science and Technology, Skolkovo, Russia.
5Research Centre for Medical Genetics, Moscow, Russia.
6Pirogov Russian National Research Medical University, Moscow, Russia.
7Shemyakin–Ovchinnikov Institute of Bioorganic Chemistry, Moscow, Russia.
Address correspondence to: Petr Sergiev, Belozersky Institute of Physico-Chemical Biology, Lomonosov Moscow State University, 119991 Moscow, Russian Federation. Email: petya@genebee.msu.ru.
Authorship note: OAA and NYK contributed equally to this work. PVS and ANT contributed equally to this work.
Find articles by Permyakov, O. in: PubMed | Google Scholar
1Belozersky Institute of Physico-Chemical Biology, Lomonosov Moscow State University, Moscow, Russia.
2Endocrinology Research Centre, Moscow, Russia.
3Faculty of Chemistry, Lomonosov Moscow State University, Moscow, Russia.
4Center for Bio- and Medical Technologies, Skolkovo Institute of Science and Technology, Skolkovo, Russia.
5Research Centre for Medical Genetics, Moscow, Russia.
6Pirogov Russian National Research Medical University, Moscow, Russia.
7Shemyakin–Ovchinnikov Institute of Bioorganic Chemistry, Moscow, Russia.
Address correspondence to: Petr Sergiev, Belozersky Institute of Physico-Chemical Biology, Lomonosov Moscow State University, 119991 Moscow, Russian Federation. Email: petya@genebee.msu.ru.
Authorship note: OAA and NYK contributed equally to this work. PVS and ANT contributed equally to this work.
Find articles by Buev, V. in: PubMed | Google Scholar
1Belozersky Institute of Physico-Chemical Biology, Lomonosov Moscow State University, Moscow, Russia.
2Endocrinology Research Centre, Moscow, Russia.
3Faculty of Chemistry, Lomonosov Moscow State University, Moscow, Russia.
4Center for Bio- and Medical Technologies, Skolkovo Institute of Science and Technology, Skolkovo, Russia.
5Research Centre for Medical Genetics, Moscow, Russia.
6Pirogov Russian National Research Medical University, Moscow, Russia.
7Shemyakin–Ovchinnikov Institute of Bioorganic Chemistry, Moscow, Russia.
Address correspondence to: Petr Sergiev, Belozersky Institute of Physico-Chemical Biology, Lomonosov Moscow State University, 119991 Moscow, Russian Federation. Email: petya@genebee.msu.ru.
Authorship note: OAA and NYK contributed equally to this work. PVS and ANT contributed equally to this work.
Find articles by Guseva, E. in: PubMed | Google Scholar
1Belozersky Institute of Physico-Chemical Biology, Lomonosov Moscow State University, Moscow, Russia.
2Endocrinology Research Centre, Moscow, Russia.
3Faculty of Chemistry, Lomonosov Moscow State University, Moscow, Russia.
4Center for Bio- and Medical Technologies, Skolkovo Institute of Science and Technology, Skolkovo, Russia.
5Research Centre for Medical Genetics, Moscow, Russia.
6Pirogov Russian National Research Medical University, Moscow, Russia.
7Shemyakin–Ovchinnikov Institute of Bioorganic Chemistry, Moscow, Russia.
Address correspondence to: Petr Sergiev, Belozersky Institute of Physico-Chemical Biology, Lomonosov Moscow State University, 119991 Moscow, Russian Federation. Email: petya@genebee.msu.ru.
Authorship note: OAA and NYK contributed equally to this work. PVS and ANT contributed equally to this work.
Find articles by Priymak, A. in: PubMed | Google Scholar
1Belozersky Institute of Physico-Chemical Biology, Lomonosov Moscow State University, Moscow, Russia.
2Endocrinology Research Centre, Moscow, Russia.
3Faculty of Chemistry, Lomonosov Moscow State University, Moscow, Russia.
4Center for Bio- and Medical Technologies, Skolkovo Institute of Science and Technology, Skolkovo, Russia.
5Research Centre for Medical Genetics, Moscow, Russia.
6Pirogov Russian National Research Medical University, Moscow, Russia.
7Shemyakin–Ovchinnikov Institute of Bioorganic Chemistry, Moscow, Russia.
Address correspondence to: Petr Sergiev, Belozersky Institute of Physico-Chemical Biology, Lomonosov Moscow State University, 119991 Moscow, Russian Federation. Email: petya@genebee.msu.ru.
Authorship note: OAA and NYK contributed equally to this work. PVS and ANT contributed equally to this work.
Find articles by Bazhanova, O. in: PubMed | Google Scholar
1Belozersky Institute of Physico-Chemical Biology, Lomonosov Moscow State University, Moscow, Russia.
2Endocrinology Research Centre, Moscow, Russia.
3Faculty of Chemistry, Lomonosov Moscow State University, Moscow, Russia.
4Center for Bio- and Medical Technologies, Skolkovo Institute of Science and Technology, Skolkovo, Russia.
5Research Centre for Medical Genetics, Moscow, Russia.
6Pirogov Russian National Research Medical University, Moscow, Russia.
7Shemyakin–Ovchinnikov Institute of Bioorganic Chemistry, Moscow, Russia.
Address correspondence to: Petr Sergiev, Belozersky Institute of Physico-Chemical Biology, Lomonosov Moscow State University, 119991 Moscow, Russian Federation. Email: petya@genebee.msu.ru.
Authorship note: OAA and NYK contributed equally to this work. PVS and ANT contributed equally to this work.
Find articles by Emelianova, M. in: PubMed | Google Scholar
1Belozersky Institute of Physico-Chemical Biology, Lomonosov Moscow State University, Moscow, Russia.
2Endocrinology Research Centre, Moscow, Russia.
3Faculty of Chemistry, Lomonosov Moscow State University, Moscow, Russia.
4Center for Bio- and Medical Technologies, Skolkovo Institute of Science and Technology, Skolkovo, Russia.
5Research Centre for Medical Genetics, Moscow, Russia.
6Pirogov Russian National Research Medical University, Moscow, Russia.
7Shemyakin–Ovchinnikov Institute of Bioorganic Chemistry, Moscow, Russia.
Address correspondence to: Petr Sergiev, Belozersky Institute of Physico-Chemical Biology, Lomonosov Moscow State University, 119991 Moscow, Russian Federation. Email: petya@genebee.msu.ru.
Authorship note: OAA and NYK contributed equally to this work. PVS and ANT contributed equally to this work.
Find articles by Grigoryeva, O. in: PubMed | Google Scholar
1Belozersky Institute of Physico-Chemical Biology, Lomonosov Moscow State University, Moscow, Russia.
2Endocrinology Research Centre, Moscow, Russia.
3Faculty of Chemistry, Lomonosov Moscow State University, Moscow, Russia.
4Center for Bio- and Medical Technologies, Skolkovo Institute of Science and Technology, Skolkovo, Russia.
5Research Centre for Medical Genetics, Moscow, Russia.
6Pirogov Russian National Research Medical University, Moscow, Russia.
7Shemyakin–Ovchinnikov Institute of Bioorganic Chemistry, Moscow, Russia.
Address correspondence to: Petr Sergiev, Belozersky Institute of Physico-Chemical Biology, Lomonosov Moscow State University, 119991 Moscow, Russian Federation. Email: petya@genebee.msu.ru.
Authorship note: OAA and NYK contributed equally to this work. PVS and ANT contributed equally to this work.
Find articles by Baydakova, G. in: PubMed | Google Scholar
1Belozersky Institute of Physico-Chemical Biology, Lomonosov Moscow State University, Moscow, Russia.
2Endocrinology Research Centre, Moscow, Russia.
3Faculty of Chemistry, Lomonosov Moscow State University, Moscow, Russia.
4Center for Bio- and Medical Technologies, Skolkovo Institute of Science and Technology, Skolkovo, Russia.
5Research Centre for Medical Genetics, Moscow, Russia.
6Pirogov Russian National Research Medical University, Moscow, Russia.
7Shemyakin–Ovchinnikov Institute of Bioorganic Chemistry, Moscow, Russia.
Address correspondence to: Petr Sergiev, Belozersky Institute of Physico-Chemical Biology, Lomonosov Moscow State University, 119991 Moscow, Russian Federation. Email: petya@genebee.msu.ru.
Authorship note: OAA and NYK contributed equally to this work. PVS and ANT contributed equally to this work.
Find articles by Abakumov, M. in: PubMed | Google Scholar
1Belozersky Institute of Physico-Chemical Biology, Lomonosov Moscow State University, Moscow, Russia.
2Endocrinology Research Centre, Moscow, Russia.
3Faculty of Chemistry, Lomonosov Moscow State University, Moscow, Russia.
4Center for Bio- and Medical Technologies, Skolkovo Institute of Science and Technology, Skolkovo, Russia.
5Research Centre for Medical Genetics, Moscow, Russia.
6Pirogov Russian National Research Medical University, Moscow, Russia.
7Shemyakin–Ovchinnikov Institute of Bioorganic Chemistry, Moscow, Russia.
Address correspondence to: Petr Sergiev, Belozersky Institute of Physico-Chemical Biology, Lomonosov Moscow State University, 119991 Moscow, Russian Federation. Email: petya@genebee.msu.ru.
Authorship note: OAA and NYK contributed equally to this work. PVS and ANT contributed equally to this work.
Find articles by Manskikh, V. in: PubMed | Google Scholar
1Belozersky Institute of Physico-Chemical Biology, Lomonosov Moscow State University, Moscow, Russia.
2Endocrinology Research Centre, Moscow, Russia.
3Faculty of Chemistry, Lomonosov Moscow State University, Moscow, Russia.
4Center for Bio- and Medical Technologies, Skolkovo Institute of Science and Technology, Skolkovo, Russia.
5Research Centre for Medical Genetics, Moscow, Russia.
6Pirogov Russian National Research Medical University, Moscow, Russia.
7Shemyakin–Ovchinnikov Institute of Bioorganic Chemistry, Moscow, Russia.
Address correspondence to: Petr Sergiev, Belozersky Institute of Physico-Chemical Biology, Lomonosov Moscow State University, 119991 Moscow, Russian Federation. Email: petya@genebee.msu.ru.
Authorship note: OAA and NYK contributed equally to this work. PVS and ANT contributed equally to this work.
Find articles by Dontsova, O. in: PubMed | Google Scholar
1Belozersky Institute of Physico-Chemical Biology, Lomonosov Moscow State University, Moscow, Russia.
2Endocrinology Research Centre, Moscow, Russia.
3Faculty of Chemistry, Lomonosov Moscow State University, Moscow, Russia.
4Center for Bio- and Medical Technologies, Skolkovo Institute of Science and Technology, Skolkovo, Russia.
5Research Centre for Medical Genetics, Moscow, Russia.
6Pirogov Russian National Research Medical University, Moscow, Russia.
7Shemyakin–Ovchinnikov Institute of Bioorganic Chemistry, Moscow, Russia.
Address correspondence to: Petr Sergiev, Belozersky Institute of Physico-Chemical Biology, Lomonosov Moscow State University, 119991 Moscow, Russian Federation. Email: petya@genebee.msu.ru.
Authorship note: OAA and NYK contributed equally to this work. PVS and ANT contributed equally to this work.
Find articles by Sergiev, P. in: PubMed | Google Scholar
1Belozersky Institute of Physico-Chemical Biology, Lomonosov Moscow State University, Moscow, Russia.
2Endocrinology Research Centre, Moscow, Russia.
3Faculty of Chemistry, Lomonosov Moscow State University, Moscow, Russia.
4Center for Bio- and Medical Technologies, Skolkovo Institute of Science and Technology, Skolkovo, Russia.
5Research Centre for Medical Genetics, Moscow, Russia.
6Pirogov Russian National Research Medical University, Moscow, Russia.
7Shemyakin–Ovchinnikov Institute of Bioorganic Chemistry, Moscow, Russia.
Address correspondence to: Petr Sergiev, Belozersky Institute of Physico-Chemical Biology, Lomonosov Moscow State University, 119991 Moscow, Russian Federation. Email: petya@genebee.msu.ru.
Authorship note: OAA and NYK contributed equally to this work. PVS and ANT contributed equally to this work.
Find articles by Tiulpakov, A. in: PubMed | Google Scholar
Published September 8, 2026 - More info
JCI Insight. 2026;11(17):e198799. https://doi.org/10.1172/jci.insight.198799.
© 2026 Averina et al. This work is licensed under the Creative Commons Attribution 4.0 International License. To view a copy of this license, visit http://creativecommons.org/licenses/by/4.0/.
Received: August 5, 2025; Accepted: July 20, 2026

-
Introduction
In humans, several steroidogenic steps require cytochrome P450 enzymes for cortisol biosynthesis. Deficiencies of these enzymes, namely CYP11A1, CYP17A1, CYP21A2, and CYP11B1, comprise the 4 well-characterized forms of monogenic autosomal recessive disorders grouped under the term of congenital adrenal hyperplasia (CAH). Both microsomal and mitochondrial P450 enzymes, including those involved in steroidogenesis, receive 2 electrons from NADPH transferred via flavoproteins. P450 oxidoreductase (POR), containing FAD and FMN, transfers electrons to PORs of the endoplasmic reticulum, while FAD-containing ferredoxin reductase (FDXR) transfers electrons to mitochondrial P450 enzymes via ferredoxin (FDX).
To date, at least 2 monogenic defects in cortisol biosynthesis have been described, resulting from deficiencies in one of the P450 partner proteins that ensure electron transfer. One form of CAH is caused by a deficiency of POR, a flavoprotein that donates electrons to microsomal P450 enzymes, CYP17A1 and CYP21A2 (1, 2). Recently, Pignatti and coauthors (3) described a form of adrenal insufficiency caused by a defect in FDXR, a flavoprotein that mediates electron transfer to mitochondrial P450 enzymes, such as CYP11A1 and CYP11B1 (3). Since the redox partners cooperate with different cytochrome P450 enzymes throughout the body, their deficiency may cause a broad spectrum of clinical symptoms, not limited to changes in steroid hormones, and may even be present without them. POR deficiency, for instance, may manifest with skeletal malformations, attributed to the concomitant impairment of CYP26B1 activity (4). FDXR deficiency is characterized by generalized mitochondriopathy with a variable clinical spectrum and severity (4), and the familial case described by Pignatti et al. to date represents the only example of this disorder to our knowledge in which mitochondrial neuropathy coincided with impaired steroidogenesis (CYP11B1 deficiency) (3).
Flavin adenine dinucleotide (FAD) is a ubiquitous component of a multitude of redox enzymes indispensable for energy metabolism as well as for many other processes. In total, the human genome encodes 90 flavin-dependent enzymes, 84% of which contain FAD (5). Dietary sources, mainly milk and eggs, supply free riboflavin (vitamin B2) and FAD/FMN bound to proteins. Flavoprotein denaturation and fragmentation in the stomach, followed by the activity of phosphatases and pyrophosphatases in the ileum, releases additional free riboflavin. SLC52A3 transporter is responsible for riboflavin uptake in the small intestine, while SLC52A1 and SLC52A2 release riboflavin or FMN into the bloodstream. SLC52A2 is also responsible for riboflavin transport into other cell types. An additional protein, SLC25A32, transports FAD across the inner mitochondrial membrane. Excess of riboflavin, which has not been converted to FAD and FMN or bound to riboflavin-binding proteins, is rapidly excreted by the kidneys.
FAD is synthesized by a single protein, FLAD1, in mammals (6). Upstream from FLAD1, riboflavin is converted to flavin mononucleotide (FMN) by the riboflavin kinase (RFK). The FLAD1 gene is localized on chromosome 1 at 1q21.3. Two splicing isoforms are studied: one mitochondrial and the other cytosolic (7, 8). FLAD1 protein contains an N-terminal molibdopterin binding domain and a C-terminal FAD synthase (ATP:FMN adenylyl transferase) domain (Figure 1A). The former is hypothesized to hydrolyze FAD under yet-to-be-defined conditions (9). After FAD synthesis, the product remains tightly bound to FLAD1 until it is released to one of a multitude of apoflavoproteins, suggesting FAD chaperone activity (10, 11). Another shorter FLAD1 isoform, named hFADS6, has been characterized in patients carrying frameshift variants in the N-terminal molybdopterin-binding domain (12). This isoform is suggested to compensate for severe FLAD1 deficiency upon these variants. Interestingly, 7 frameshift variants with clinical manifestations reported in the literature are found exclusively in the N-terminal FLAD1 molibdopterin binding domain, while missense and in-frame deletion have been reported in the FAD synthase C-terminal part (13) (Figure 1A).
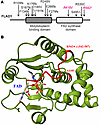 Figure 1
Structure of the FAD synthase with the variants marked. (A) Domain organization of the FLAD1 protein. The molibdopterin binding domain and FAD synthase domain are shown and marked. Known pathogenic variant sites are indicated by arrows and labeled accordingly. The variants described herein are marked by pink. (B) Structure of the FAD synthase domain (28) of the human FLAD1 protein (PDB:8rom). The FAD molecule is shown as a wireframe model colored CPK. The residue changed by the A418V variant and the fragment absent in the R542* mutant are colored red.
Multiple acyl-coenzyme A dehydrogenation deficiency (multiple acyl-CoA dehydrogenase deficiency [MADD], MIM #231680) is an autosomal recessive disorder that affects the oxidation of fatty acids, several amino acids, and choline. Known variants leading to MADD are found in genes encoding electron transfer flavoprotein dehydrogenase (ETFDH), the α (ETFA) and β (ETFB) subunits of electron transfer flavoprotein; the riboflavin transporter genes SLC52A1, SLC52A2, and SLC52A3; and the mitochondrial FAD transporter gene SLC25A32. MADD-like symptoms may also be caused by variants in the FLAD1 gene (6). Out of a total of > 400 variants described as causative for MADD, only 20 have been attributed to FLAD1 in 2021 (14–22) (Supplemental Table 1; supplemental material available online with this article; https://doi.org/10.1172/jci.insight.198799DS1). A typical manifestation of MADD in general and FLAD1 insufficiency in particular is lipid droplet accumulation in muscle fibers, clearly visible by Oil Red O staining (13, 16, 18, 19, 23, 24) due to the reduced ability to oxidize fatty acids. The same mechanism leads to an increase in the concentration of several fatty-acid acyl carnitines in blood plasma (13, 16, 17, 19, 20, 22, 24, 25).
We report here 2 siblings (1 boy, 1 girl) with compound heterozygous A418V and R542* variants in the FLAD1 gene, who presented with primary adrenal insufficiency, myopathy, and biochemical abnormalities consistent with MADD. Defects in the FLAD1 gene are described in lipid storage myopathy due to FAD synthetase deficiency (MIM# 255100), a rare autosomal recessive inborn error of metabolism that includes variable mitochondrial dysfunction but, to the best of our knowledge, has not yet been associated with primary adrenal insufficiency.
Using a personalized mouse model, we present evidence that the Flad1A418V/R542* genotype is associated with adrenal dysfunction, as well as other features consistent with previously described characteristics of FLAD1 deficiency in humans.
-
Results
Clinical cases. Two sibling patients, the boy (Patient 1) and the girl (Patient 2), were born to nonconsanguineous parents (Figure 2A). There was no history of endocrine or neuromuscular diseases in the family. Both patients were delivered by cesarean section due to preterm labor and fetal distress (Table 1). At the age of 17 days (Patient 1) and 6 days (Patient 2), adrenal insufficiency was diagnosed, manifested by low cortisol levels, hyponatremia, and hyperkalemia (Table 1). Replacement with hydrocortisone and fludrocortisone has been initiated. While on corticosteroid treatment, the patients repeatedly showed elevated plasma ACTH levels (Table 1). At age 4 months (Patient 1) and 6 months (Patient 2), bilateral hip dysplasia was diagnosed. Later, at ages 4–5 years, Klippel-Feil syndrome (fusion of cervical vertebrae and severe scoliosis) has been observed. Both patients suffered from bilateral severe pneumonia at an early age (<1 year) and showed muscle hypotonia. Blood glucose levels were typically within the lower normal range. Increased levels of C8, C10, and C10:1 acyl carnitines were observed in Patient 1 at ages 8.6 and in Patient 2 at 6.9 years, respectively (Table 1).
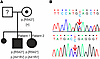 Figure 2
Patients’ pedigree and genotype. (A) Patients’ pedigree. Shown are the known data on patients’ and their relatives’ genotypes, where known. (B) Patient’s genotype. Shown are the results of Sanger sequencing of the amplicons of the FLAD1 gene for patient 2 (identical results were obtained for patient 1). The upper panel corresponds to the region coding for the amino acid 418, while the lower panel corresponds to that of amino acid 542. Variant sites were marked by the red arrow.
Whole exome sequencing in Patient 1 revealed 2 heterozygous variants in the FLAD1 gene (NM_025207): c.1253C>T (p.A418V) in exon 3 and c.1624C>T (p.R542*) in exon 6; the latter one leading to the formation of an in-frame stop codon (Figure 2B). Compound heterozygosity in Patient 1 and Patient 2 was confirmed by amplification of genomic DNA fragments and Sanger sequencing. According to amplicon sequencing, the mother was heterozygous for the p.R542* variant. The father was not available for DNA analysis.
Following detection of mutations in the FLAD1 gene, riboflavin (100 mg, daily) was administered to both patients. After 6 months of riboflavin treatment, blood levels of fatty acyl carnitines fell within normal values (Table 1).
Potential pathogenicity of the FLAD1A418V and FLAD1R542* variants. FLAD1 variants observed in patients described herein have not been previously described as pathogenic. To assess their potential pathogenicity, we compared corresponding allele frequencies and pathogenicity predictions (26, 27) with those of the previously described FLAD1 pathogenic alleles (Supplemental Table 1). Both alleles leading to A418V and R542* substitutions have been previously observed in human genome sequencing at frequencies comparable with those of other pathogenic mutations (28), although neither was found in patients (Supplemental Table 2). Pathogenicity prediction tools such as PolyPhen2 (26) and FATHMM (27) suggest A418V is possibly pathogenic or tolerable, while the residue is not absolutely conserved among FLAD1 orthologs (26). The R542* mutation introduces a premature stop codon; thus, its consequences have not been predicted.
To delve deeper into the potential pathogenicity of the A418V and R542* variants, we used available structures of the FLAD1 protein (28). The C-terminal part of FLAD1 (Figure 1B) was shown to be required for its FAD synthase activity, as the removal of the last 34 amino acids totally inactivates the protein (28), which is explained by the removal of conserved R583-R586 residues likely interacting with phosphate groups of the substrates (28). Thus, the FLAD1R542* variant is likely to be inactive. Residue A418 is located in the hydrophobic core of the protein, formed by 3 α-helices (Figure 1B). It is likely that replacement of the compact alanine with the bulkier valine might destabilize FLAD1 folding, albeit not inactivate the enzyme completely, in line with the predictions (26, 27).
Creation of a personalized mouse model carrying patients’ FLAD1 variants. Computational predictions (Supplemental Table 1) and literature analysis (Supplemental Table 2) do not provide a clear understanding regarding the pathogenicity of FLAD1 A418V and R542* variants. Moreover, the endocrine pathology characteristic of the patients described herein has not been previously ascribed to patients carrying FLAD1 variants. To obtain a clear-cut conclusion on whether the FLAD1A418V/R542* compound heterozygous variants resulted in adrenocortical insufficiency, we established a personalized mouse model for the patients. To this end, we microinjected Cas9 mRNA, sgRNAs targeting the corresponding regions of the murine genome, and single-stranded DNA templates for homologous recombination in a separate set of experiments aimed to create independent FLAD1A418V and FLAD1R542* alleles. Heterozygous mouse founders carrying either FLAD1wt/A418V or FLAD1wt/R542* (Supplemental Figure 1) variants have been back-crossed to the C57BL6/J background and, when mated, aim to obtain homozygous FLAD1A418V/A418V and FLAD1R542*/R542* mice lines as well as a compound heterozygous FLAD1A418V/R542* mice population.
Somewhat expected, FLAD1A418V/A418V and FLAD1A418V/R542* mice were found to be viable, while FLAD1R542*/R542* mice were apparently lethal, as we never succeeded in obtaining pups carrying this genotype while mating FLAD1wt/R542* mice (Figure 3A). Genotyping of embryos at the E4.5, E8.5, E11.5, and E14.5 revealed that while blastocysts of the FLAD1R542*/R542* genotype are still viable (Figure 3A), later stage embryos of this genotype stop developing and are resorbed (Figure 3B).
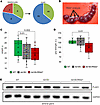 Figure 3
Variant FLAD1R542*/R542* is lethal, FLAD1A418V/R542* has a severe phenotype, and FLAD1A418V/ A418V has a moderate one. (A) Number of different FLAD1 genotypes at the blastocyst stage (left panel) and at birth (right panel) after mating of heterozygous FLAD1wt/R542* mice. Red corresponds to the homozygous mutants FLAD1R542*/R542*, blue corresponds to heterozygotes FLAD1wt/R542*, while green corresponds to the WT. (B) Uterus of the mice pregnant by embryos of genotype FLAD1R542*/R542*, FLAD1wt/R542*, and FLAD1wt. Embryos that were later genotyped as homozygous FLAD1R542*/R542* are marked by arrows. (C) The weight of male mice (6 months old) depends on genotype. The green corresponds to the WT (n = 11), the gray to FLAD1A418V/A418V (n = 12), and the red to FLAD1A418V/R542* (n = 9) mice. P = 0.0057, Kruskal-Wallis statistic = 10.33 by Kruskal-Wallis test with the Benjamini-Krieger-Yekutieli correction for multiple comparisons. (D) Grip strength of mice (male, 6 months) is dependent on the genotype. The color code is the same as for C (WT n = 12, FLAD1A418V/A418V n = 12, FLAD1A418V/R542* n = 8). P = 0.0147, Kruskal-Wallis statistic = 8.439 by Kruskal-Wallis test with the Benjamini-Krieger-Yekutieli correction for multiple comparisons. (E) Immunoblotting of the adrenal gland extracts with anti-FLAD1 (upper panels) or anti-GAPDH (lower panel, loading control) antibodies. The FLAD1 genotypes of the mice analyzed are indicated above the lanes as follows: WT (n = 3, 4 months, male), A418V (n = 3, 4 months, male), and A418V/R542* (n = 3, 4 months, male).
The following analysis demonstrated that FLAD1A418V/A418V mice have a mild but detectable phenotype, while a compound heterozygote FLAD1A418V/R542* combining presumed hypofunctional and completely inactivating variants demonstrated a more severe phenotype. The weight of mice (Figure 3C) and the grip strength (Figure 3D) were most affected by the FLAD1A418V/R542*. Unlike patients reported herein and several other patients (13) with scoliosis, mice carrying even the severe FLAD1A418V/R542* genotype do not develop scoliosis and are characterized only by a slight tendency toward decreased bone density (Supplemental Figure 2).
The variants decrease the concentration and activity of the FLAD1 protein. Variants introduced to the FLAD1 protein might destabilize it. To address this issue, we analyzed the concentration of FLAD1 protein in mice’s oxidative (soleus) (Supplemental Figure 3, A and D) and glycolytic (tibialis anterior) (Supplemental Figure 3, B and E) muscles, as well as in the adrenal gland (Figure 3E and Supplemental Figure 3, C and F). The latter is important since patients described herein have adrenal insufficiency. For all tissues analyzed, a compound heterozygote FLAD1A418V/R542* demonstrated a lower amount of FLAD1 protein, while FLAD1A418V/A418V mice demonstrated a decrease in the protein amount only for muscles. Although we do not have a straightforward explanation for this tissue and allele specificity, the general trend is that compound-heterozygous FLAD1A418V/R542* mice exhibit the most severe phenotype across all assays. Thus, both variants seem to either destabilize the FLAD1 protein or decrease its gene expression.
Since the primary catalytic activity of FLAD1 is FAD synthesis, we measured FAD concentration in adrenal gland, brain, liver, and heart extracts from WT and mutant mice (Figure 4A). FAD concentration was found to decrease in the adrenal glands of both FLAD1A418V/R542* and FLAD1A418V/A418V mice and in the liver of the compound heterozygous FLAD1A418V/R542* mice. FAD content of other tissues appeared to be more prone to FLAD1 mutations. In tissues where we observed a difference in FAD concentration, compound-heterozygous FLAD1A418V/R542* mice showed a more substantial decrease in FAD concentration compared with FLAD1A418V/A418V mice, which showed a tendency toward a decrease in FAD concentration that did not reach statistical significance.
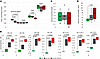 Figure 4
Metabolite quantity in mice with mutated FLAD1. (A) FAD content in mouse tissues, such as the adrenal gland, brain, liver, and heart extracts, as marked above the corresponding bars. Green corresponds to the WT (n = 6, 4 months, male), gray to the homozygous FLAD1A418V/A418V mutation (n = 6, 4 months, male), and red to the compound heterozygous FLAD1A418V/R542* mice (n = 6, 4 months, male). FAD concentration is normalized by protein content (BCA), pmol/mg protein. P < 0.0001, Kruskal-Wallis statistic = 14.58 for adrenal gland; P = 0.7484, Kruskal-Wallis statistic = 0.6371 for brain; P = 0.0061, Kruskal-Wallis statistic = 8.846 for liver; P = 0.2899, Kruskal-Wallis statistic = 2.575 for heart by Kruskal-Wallis test with the Benjamini-Krieger-Yekutieli correction for multiple comparisons. (B) Blood spot concentration of acyl carnitines (indicated above the graphs), whose concentration is most affected by FLAD1 variants. The color code, the same as for A, is indicated on the graph; n = 6 for all groups presented (except FLAD1A418V/A418V group in AC C4 being n = 5). P < 0.0001, Kruskal-Wallis statistic = 13.07 for AC C4; P < 0.0001, Kruskal-Wallis statistic = 13.66 AC C5; P = 0.0002, Kruskal-Wallis statistic = 12.12 for AC C6; P < 0.0001, Kruskal-Wallis statistic = 12.54 AC C8; P < 0.0001, Kruskal-Wallis statistic = 12.13 AC C10; P = 0.0003, Kruskal-Wallis statistic = 11.66 AC C10:1; P < 0.0001, Kruskal-Wallis statistic = 12.94 AC C12 by Kruskal-Wallis test with the Benjamini-Krieger-Yekutieli correction for multiple comparisons. (C) Frequency of male copulation as measured by the average number of vaginal plugs observed per male per day (10 days total). Green corresponds to the WT (n = 8, 4 months, male), gray to the homozygous FLAD1A418V/A418V mutation (n = 8, 4 months, male), and red to the compound heterozygous FLAD1A418V/R542* mice (n = 8, 4 months, male). No statistically significant difference was observed between the groups (χ2 = 1.103, df = 2, P = 0.576). (D) Estrous cycle length, days (totally 14 days measured, daily). Green color corresponds to the WT (n = 7, 4 months, female), gray color to the homozygous FLAD1A418V/A418V mutation (n = 7, 4 months, female), and red to the compound heterozygous FLAD1A418V/R542* mice (n = 7, 4 months, female). P = 0.0322, Kruskal-Wallis statistic = 6.516 by Kruskal-Wallis test with the Benjamini-Krieger-Yekutieli correction for multiple comparisons.
Expectedly, no difference in riboflavin (Supplemental Figure 4A) and FMN (Supplemental Figure 4B) concentration has been detected for either mutant.
Variants in the FLAD1 gene affect mice’s acyl carnitine profile, similar to that of patients, while having minimal effects on reproductive functions. An increase in the concentration of several fatty acid acyl carnitines has previously been reported (13, 15–17, 19–22, 24, 25) and described herein for patients with the FLAD1 variants. We analyzed acyl carnitine profiles in the blood spots of the WT mice and mice carrying FLAD1A418V/R542* and FLAD1A418V/A418V genotypes by mass spectrometry (Figure 4B and Supplemental Figure 4C). We observed a profound increase in the concentrations of C4, C5, C6, C6OH, C8, C8:1, C10, 10:2, C10:1, C12, C12:1, C14:2, and C22 acyl carnitines for both mutant mouse lines. In addition, several other acyl carnitines and several amino acids demonstrated an elevation in the blood of mice carrying the FLAD1A418V/R542* genotype (Supplemental Figure 4C).
Mutations in the FLAD1 gene, to a small extent, affect gonadal function. While the male ability to copulate remained indistinguishable from that of the WT for both FLAD1A418V/R542* and FLAD1A418V/A418V variants (Figure 4C), the female estrous cycle is delayed for the FLAD1A418V/R542* mice, while that of FLAD1A418V/A418V is indistinguishable from the WT (Figure 4D).
The variants in the FLAD1 gene cause adrenal insufficiency in a mouse model. To investigate cortical steroidogenesis in the mouse lines carrying FLAD1A418V/R542* and FLAD1A418V/A418V variants, we determined concentrations of adrenal steroids in blood plasma at steady state (Figure 5, A and B, and Supplemental Figure 4, A–C) and after ACTH (synacthen) stimulation (Figure 5, A and B, and Supplemental Figure 5, A–C). We observed that FLAD1A418V/R542* mutations in mice decrease steady-state aldosterone level (Figure 5B) and corticosterone (Figure 5A), but not that of progesterone (Supplemental Figure 5A), 11-deoxycorticosterone (Supplemental Figure 5B), or 18-hydroxycorticosterone (Supplemental Figure 5C). FLAD1A418V/R542* mutant mice demonstrated a decreased or even undetectable response of corticosterone, aldosterone, and 18-hydroxycorticosterone levels for ACTH stimulation (Figure 5, A and B, and Supplemental Figure 5C). For FLAD1A418V/A418V mutant, which has a much milder phenotype, we observed somewhat reduced response to ACTH only for aldosterone (Figure 5B).
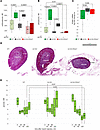 Figure 5
FLAD1 variants lead to adrenal insufficiency and hypoglycemia. (A) Corticosterone concentration in blood plasma at steady state (pale colors, bars 1, 3, 5) and after ACTH (synacthen) stimulation (bright colors, bars 2, 4, 6); the data is presented in nM. Green corresponds to the WT (bars 1, 2, n = 12, 3 months, male), gray color corresponds to FLAD1A418V/A418V (bars 3, 4, n = 12, 3 months, male), while red color corresponds to the FLAD1A418V/R542* (bars 5, 6, n = 12, 3 months, male) mice. Statistical analysis was performed using a mixed-effects model (REML): significant effects of ACTH (synacthen) stimulation [F(1,15) = 83.50, P < 0.0001], Genotype [F(2,33) = 19.58, P < 0.0001], and ACTH×Genotype interaction [F(2,15) = 17.58, P = 0.0001]. Post hoc: 2-stage linear step-up procedure of Benjmini, Krieger, and Yekutieli (5 families, q = 0.05). (B) Aldosterone concentration in blood plasma at steady state (pale colors, bars 1, 3, 5) and after ACTH (synacthen) stimulation (bright colors, bars 2, 4, 6); the data is presented in nM. Green corresponds to the WT (bars 1, 2, n = 12, 3 months, male), gray corresponds to FLAD1A418V/A418V (bars 3, 4, n = 12, 3 months, male), while red corresponds to the FLAD1A418V/R542* (bars 5, 6, n = 12, 3 months, male) mice. Statistical analysis was performed using a mixed-effects model (REML): significant effects of ACTH (synacthen) stimulation [F(1,15) = 236.0, P < 0.0001], Genotype [F(2,33) = 48.21, P < 0.0001], and ACTH×Genotype interaction [F(2,15) = 73.90, P < 0.0001]. Post hoc: Benjamini, Krieger, and Yekutieli procedure (5 families, q = 0.05). (C) POMC mRNA quantitation by qPCR in the pituitary gland extracts, normalized by mRNA GAPDH. Log scale, arbitrary units. P = 0.034, Kruskal-Wallis statistic = 6.671 by Kruskal-Wallis test with the Benjamini-Krieger-Yekutieli correction for multiple comparisons. (D) H&E staining of adrenal gland samples from the WT (left panel, 4 months, male), FLAD1A418V/A418V (central panel, 4 months, male), and FLAD1A418V/R542* (right panel, 4 months, male) mice. Scale bar: 1mm. The cortex and medulla zones are marked. (E) Time course of the blood glucose concentration (mM) in mice following i.p. injection of 0.75 mU/g mouse weight after 4 hours of fasting. Time points 0, 15, 30, 45, 60, and 120 minutes are indicated below the graphs. Mice genotypes are shown above the graphs: WT (left part, n = 6, male, 3 months), FLAD1A418V/A418V (central part, n = 6, male, 3 months), and FLAD1A418V/R542* (right part, n = 6, male, 3 months) mice. Data are shown as mean ± 95% CI. Multiple comparisons were corrected using the 2-stage linear step-up procedure of Benjamini, Krieger, and Yekutieli (q = 0.05).
Corticosteroids regulate ACTH production via a negative-feedback mechanism that acts through transcriptional repression (29). To check whether adrenal insufficiency caused by FLAD1 variants may lead to transcriptional depression of the POMC gene, which encodes the ACTH precursor, we extracted total RNA from the pituitary glands of mice and analyzed gene expression by qPCR (Figure 5C). As expected, we observed an upregulation of the POMC gene in mice carrying FLAD1A418V/R542* and FLAD1A418V/A418V genotypes.
To determine whether FAD deficiency affects adrenal gland morphology, we performed H&E staining (Figure 5D). FLAD1A418V/A418V mice’s adrenal gland morphology appeared normal. However, mice of the FLAD1A418V/R542* genotype appeared to have reduced and disorganized the entire cortical region (Figure 5D).
The variants in the FLAD1 gene cause age-dependent hypoglycemia. The patients described herein had low-normal blood glucose levels. Patients with FLAD1 variants described in the literature were occasionally reported to have hypoglycemia(16, 20, 25). To compare it with the mouse model, we performed an insulin tolerance test (ITT) in WT mice and mice carrying the FLAD1A418V/R542* and FLAD1A418V/A418V genotypes (Figure 5E and Supplemental Figure 5). At 3 months of age, mice responded to insulin injection in a manner highly dependent on genotype (Figure 5). WT mice and FLAD1A418V/A418V mutants reacted normally, while mice carrying the FLAD1A418V/R542* genotype demonstrated a substantial delay in glucose level normalization and a more severe glucose concentration drop. Later, at 6 months of age, FLAD1A418V/R542* mutants were found to have a smaller difference with the WT and FLAD1A418V/A418V mutants in the insulin-provoked glucose concentration drop, while this difference remained statistically significant (Supplemental Figure 6A). Insulin-provoked corticosterone release (Supplemental Figure 6B) was barely, if at all, observed for FLAD1A418V/R542* mutants. In line with other observations, FLAD1A418V/ A418V mutants behaved much like the WT mice in this test.


