
Research ArticleCell biologyHematologyImmunology
Open Access |  10.1172/jci.insight.203794
Genomic, single-cell, and functional profiling of the CD48-CD244 axis and NK cell dysfunction in multiple myeloma
Bonell Patiño-Escobar,1 Torsten Steinbrunn,2,3,4,5 Lucy Perez-Lugo,1,6 Sham Rampersaud,1,7 Daniel D. Waller,1 Daniela Ordoñez,1,8 Huimin Geng,1 Fernando Salangsang,9 Paul Phojanakong,9 Juan Antonio Camara Serrano,9 Yan Zeng,9 Veronica Steri,9 Oscar A. Aguilar,10,11 Constantine S. Mitsiades,2,4,5,12 and Arun P. Wiita1,13,14,15
1Department of Laboratory Medicine, University of California, San Francisco (UCSF), San Francisco, California, USA.
2Department of Medicine, Harvard Medical School, Boston, Massachusetts, USA.
3Department of Medicine II, University Hospital of Würzburg, Würzburg, Germany.
4Broad Institute of Massachusetts Institute of Technology (MIT) and Harvard, Cambridge, Massachusetts, USA.
5Department of Medical Oncology, Dana-Farber Cancer Institute, Boston, Massachusetts, USA.
6Department of Hematology-Oncology, Fundación Valle de Lili, Cali, Colombia.
7Pharmaceutical Sciences and Pharmacogenomics Graduate Program, UCSF, San Francisco, California, USA.
8Biotechnology Program, Department of Engineering and Technology, City College of San Francisco, San Francisco, California, USA.
9Preclinical Therapeutics Core, Helen Diller Family Comprehensive Cancer Center,
10Department of Microbiology and Immunology, and
11Parker Institute for Cancer Immunotherapy, UCSF, San Francisco, California, USA.
12Ludwig Center, Harvard Medical School, Boston, Massachusetts, USA.
13Department of Bioengineering and Therapeutic Sciences and
14Helen Diller Family Comprehensive Cancer Center, UCSF, San Francisco, California, USA.
15Chan Zuckerberg Biohub San Francisco, San Francisco, California, USA.
Address for correspondence. Arun P. Wiita, Department of Laboratory Medicine, University of California, San Francisco, 185 Berry Street Suite 290, Room 2410, San Francisco, California 94107, USA. Email: arun.wiita@ucsf.edu.
Find articles by Patiño-Escobar, B. in: PubMed | Google Scholar
1Department of Laboratory Medicine, University of California, San Francisco (UCSF), San Francisco, California, USA.
2Department of Medicine, Harvard Medical School, Boston, Massachusetts, USA.
3Department of Medicine II, University Hospital of Würzburg, Würzburg, Germany.
4Broad Institute of Massachusetts Institute of Technology (MIT) and Harvard, Cambridge, Massachusetts, USA.
5Department of Medical Oncology, Dana-Farber Cancer Institute, Boston, Massachusetts, USA.
6Department of Hematology-Oncology, Fundación Valle de Lili, Cali, Colombia.
7Pharmaceutical Sciences and Pharmacogenomics Graduate Program, UCSF, San Francisco, California, USA.
8Biotechnology Program, Department of Engineering and Technology, City College of San Francisco, San Francisco, California, USA.
9Preclinical Therapeutics Core, Helen Diller Family Comprehensive Cancer Center,
10Department of Microbiology and Immunology, and
11Parker Institute for Cancer Immunotherapy, UCSF, San Francisco, California, USA.
12Ludwig Center, Harvard Medical School, Boston, Massachusetts, USA.
13Department of Bioengineering and Therapeutic Sciences and
14Helen Diller Family Comprehensive Cancer Center, UCSF, San Francisco, California, USA.
15Chan Zuckerberg Biohub San Francisco, San Francisco, California, USA.
Address for correspondence. Arun P. Wiita, Department of Laboratory Medicine, University of California, San Francisco, 185 Berry Street Suite 290, Room 2410, San Francisco, California 94107, USA. Email: arun.wiita@ucsf.edu.
Find articles by Steinbrunn, T. in: PubMed | Google Scholar
1Department of Laboratory Medicine, University of California, San Francisco (UCSF), San Francisco, California, USA.
2Department of Medicine, Harvard Medical School, Boston, Massachusetts, USA.
3Department of Medicine II, University Hospital of Würzburg, Würzburg, Germany.
4Broad Institute of Massachusetts Institute of Technology (MIT) and Harvard, Cambridge, Massachusetts, USA.
5Department of Medical Oncology, Dana-Farber Cancer Institute, Boston, Massachusetts, USA.
6Department of Hematology-Oncology, Fundación Valle de Lili, Cali, Colombia.
7Pharmaceutical Sciences and Pharmacogenomics Graduate Program, UCSF, San Francisco, California, USA.
8Biotechnology Program, Department of Engineering and Technology, City College of San Francisco, San Francisco, California, USA.
9Preclinical Therapeutics Core, Helen Diller Family Comprehensive Cancer Center,
10Department of Microbiology and Immunology, and
11Parker Institute for Cancer Immunotherapy, UCSF, San Francisco, California, USA.
12Ludwig Center, Harvard Medical School, Boston, Massachusetts, USA.
13Department of Bioengineering and Therapeutic Sciences and
14Helen Diller Family Comprehensive Cancer Center, UCSF, San Francisco, California, USA.
15Chan Zuckerberg Biohub San Francisco, San Francisco, California, USA.
Address for correspondence. Arun P. Wiita, Department of Laboratory Medicine, University of California, San Francisco, 185 Berry Street Suite 290, Room 2410, San Francisco, California 94107, USA. Email: arun.wiita@ucsf.edu.
Find articles by Perez-Lugo, L. in: PubMed | Google Scholar
1Department of Laboratory Medicine, University of California, San Francisco (UCSF), San Francisco, California, USA.
2Department of Medicine, Harvard Medical School, Boston, Massachusetts, USA.
3Department of Medicine II, University Hospital of Würzburg, Würzburg, Germany.
4Broad Institute of Massachusetts Institute of Technology (MIT) and Harvard, Cambridge, Massachusetts, USA.
5Department of Medical Oncology, Dana-Farber Cancer Institute, Boston, Massachusetts, USA.
6Department of Hematology-Oncology, Fundación Valle de Lili, Cali, Colombia.
7Pharmaceutical Sciences and Pharmacogenomics Graduate Program, UCSF, San Francisco, California, USA.
8Biotechnology Program, Department of Engineering and Technology, City College of San Francisco, San Francisco, California, USA.
9Preclinical Therapeutics Core, Helen Diller Family Comprehensive Cancer Center,
10Department of Microbiology and Immunology, and
11Parker Institute for Cancer Immunotherapy, UCSF, San Francisco, California, USA.
12Ludwig Center, Harvard Medical School, Boston, Massachusetts, USA.
13Department of Bioengineering and Therapeutic Sciences and
14Helen Diller Family Comprehensive Cancer Center, UCSF, San Francisco, California, USA.
15Chan Zuckerberg Biohub San Francisco, San Francisco, California, USA.
Address for correspondence. Arun P. Wiita, Department of Laboratory Medicine, University of California, San Francisco, 185 Berry Street Suite 290, Room 2410, San Francisco, California 94107, USA. Email: arun.wiita@ucsf.edu.
Find articles by Rampersaud, S. in: PubMed | Google Scholar
1Department of Laboratory Medicine, University of California, San Francisco (UCSF), San Francisco, California, USA.
2Department of Medicine, Harvard Medical School, Boston, Massachusetts, USA.
3Department of Medicine II, University Hospital of Würzburg, Würzburg, Germany.
4Broad Institute of Massachusetts Institute of Technology (MIT) and Harvard, Cambridge, Massachusetts, USA.
5Department of Medical Oncology, Dana-Farber Cancer Institute, Boston, Massachusetts, USA.
6Department of Hematology-Oncology, Fundación Valle de Lili, Cali, Colombia.
7Pharmaceutical Sciences and Pharmacogenomics Graduate Program, UCSF, San Francisco, California, USA.
8Biotechnology Program, Department of Engineering and Technology, City College of San Francisco, San Francisco, California, USA.
9Preclinical Therapeutics Core, Helen Diller Family Comprehensive Cancer Center,
10Department of Microbiology and Immunology, and
11Parker Institute for Cancer Immunotherapy, UCSF, San Francisco, California, USA.
12Ludwig Center, Harvard Medical School, Boston, Massachusetts, USA.
13Department of Bioengineering and Therapeutic Sciences and
14Helen Diller Family Comprehensive Cancer Center, UCSF, San Francisco, California, USA.
15Chan Zuckerberg Biohub San Francisco, San Francisco, California, USA.
Address for correspondence. Arun P. Wiita, Department of Laboratory Medicine, University of California, San Francisco, 185 Berry Street Suite 290, Room 2410, San Francisco, California 94107, USA. Email: arun.wiita@ucsf.edu.
Find articles by Waller, D. in: PubMed | Google Scholar
1Department of Laboratory Medicine, University of California, San Francisco (UCSF), San Francisco, California, USA.
2Department of Medicine, Harvard Medical School, Boston, Massachusetts, USA.
3Department of Medicine II, University Hospital of Würzburg, Würzburg, Germany.
4Broad Institute of Massachusetts Institute of Technology (MIT) and Harvard, Cambridge, Massachusetts, USA.
5Department of Medical Oncology, Dana-Farber Cancer Institute, Boston, Massachusetts, USA.
6Department of Hematology-Oncology, Fundación Valle de Lili, Cali, Colombia.
7Pharmaceutical Sciences and Pharmacogenomics Graduate Program, UCSF, San Francisco, California, USA.
8Biotechnology Program, Department of Engineering and Technology, City College of San Francisco, San Francisco, California, USA.
9Preclinical Therapeutics Core, Helen Diller Family Comprehensive Cancer Center,
10Department of Microbiology and Immunology, and
11Parker Institute for Cancer Immunotherapy, UCSF, San Francisco, California, USA.
12Ludwig Center, Harvard Medical School, Boston, Massachusetts, USA.
13Department of Bioengineering and Therapeutic Sciences and
14Helen Diller Family Comprehensive Cancer Center, UCSF, San Francisco, California, USA.
15Chan Zuckerberg Biohub San Francisco, San Francisco, California, USA.
Address for correspondence. Arun P. Wiita, Department of Laboratory Medicine, University of California, San Francisco, 185 Berry Street Suite 290, Room 2410, San Francisco, California 94107, USA. Email: arun.wiita@ucsf.edu.
Find articles by Ordoñez, D. in: PubMed | Google Scholar
1Department of Laboratory Medicine, University of California, San Francisco (UCSF), San Francisco, California, USA.
2Department of Medicine, Harvard Medical School, Boston, Massachusetts, USA.
3Department of Medicine II, University Hospital of Würzburg, Würzburg, Germany.
4Broad Institute of Massachusetts Institute of Technology (MIT) and Harvard, Cambridge, Massachusetts, USA.
5Department of Medical Oncology, Dana-Farber Cancer Institute, Boston, Massachusetts, USA.
6Department of Hematology-Oncology, Fundación Valle de Lili, Cali, Colombia.
7Pharmaceutical Sciences and Pharmacogenomics Graduate Program, UCSF, San Francisco, California, USA.
8Biotechnology Program, Department of Engineering and Technology, City College of San Francisco, San Francisco, California, USA.
9Preclinical Therapeutics Core, Helen Diller Family Comprehensive Cancer Center,
10Department of Microbiology and Immunology, and
11Parker Institute for Cancer Immunotherapy, UCSF, San Francisco, California, USA.
12Ludwig Center, Harvard Medical School, Boston, Massachusetts, USA.
13Department of Bioengineering and Therapeutic Sciences and
14Helen Diller Family Comprehensive Cancer Center, UCSF, San Francisco, California, USA.
15Chan Zuckerberg Biohub San Francisco, San Francisco, California, USA.
Address for correspondence. Arun P. Wiita, Department of Laboratory Medicine, University of California, San Francisco, 185 Berry Street Suite 290, Room 2410, San Francisco, California 94107, USA. Email: arun.wiita@ucsf.edu.
Find articles by Geng, H. in: PubMed | Google Scholar
1Department of Laboratory Medicine, University of California, San Francisco (UCSF), San Francisco, California, USA.
2Department of Medicine, Harvard Medical School, Boston, Massachusetts, USA.
3Department of Medicine II, University Hospital of Würzburg, Würzburg, Germany.
4Broad Institute of Massachusetts Institute of Technology (MIT) and Harvard, Cambridge, Massachusetts, USA.
5Department of Medical Oncology, Dana-Farber Cancer Institute, Boston, Massachusetts, USA.
6Department of Hematology-Oncology, Fundación Valle de Lili, Cali, Colombia.
7Pharmaceutical Sciences and Pharmacogenomics Graduate Program, UCSF, San Francisco, California, USA.
8Biotechnology Program, Department of Engineering and Technology, City College of San Francisco, San Francisco, California, USA.
9Preclinical Therapeutics Core, Helen Diller Family Comprehensive Cancer Center,
10Department of Microbiology and Immunology, and
11Parker Institute for Cancer Immunotherapy, UCSF, San Francisco, California, USA.
12Ludwig Center, Harvard Medical School, Boston, Massachusetts, USA.
13Department of Bioengineering and Therapeutic Sciences and
14Helen Diller Family Comprehensive Cancer Center, UCSF, San Francisco, California, USA.
15Chan Zuckerberg Biohub San Francisco, San Francisco, California, USA.
Address for correspondence. Arun P. Wiita, Department of Laboratory Medicine, University of California, San Francisco, 185 Berry Street Suite 290, Room 2410, San Francisco, California 94107, USA. Email: arun.wiita@ucsf.edu.
Find articles by Salangsang, F. in: PubMed | Google Scholar
1Department of Laboratory Medicine, University of California, San Francisco (UCSF), San Francisco, California, USA.
2Department of Medicine, Harvard Medical School, Boston, Massachusetts, USA.
3Department of Medicine II, University Hospital of Würzburg, Würzburg, Germany.
4Broad Institute of Massachusetts Institute of Technology (MIT) and Harvard, Cambridge, Massachusetts, USA.
5Department of Medical Oncology, Dana-Farber Cancer Institute, Boston, Massachusetts, USA.
6Department of Hematology-Oncology, Fundación Valle de Lili, Cali, Colombia.
7Pharmaceutical Sciences and Pharmacogenomics Graduate Program, UCSF, San Francisco, California, USA.
8Biotechnology Program, Department of Engineering and Technology, City College of San Francisco, San Francisco, California, USA.
9Preclinical Therapeutics Core, Helen Diller Family Comprehensive Cancer Center,
10Department of Microbiology and Immunology, and
11Parker Institute for Cancer Immunotherapy, UCSF, San Francisco, California, USA.
12Ludwig Center, Harvard Medical School, Boston, Massachusetts, USA.
13Department of Bioengineering and Therapeutic Sciences and
14Helen Diller Family Comprehensive Cancer Center, UCSF, San Francisco, California, USA.
15Chan Zuckerberg Biohub San Francisco, San Francisco, California, USA.
Address for correspondence. Arun P. Wiita, Department of Laboratory Medicine, University of California, San Francisco, 185 Berry Street Suite 290, Room 2410, San Francisco, California 94107, USA. Email: arun.wiita@ucsf.edu.
Find articles by Phojanakong, P. in: PubMed | Google Scholar
1Department of Laboratory Medicine, University of California, San Francisco (UCSF), San Francisco, California, USA.
2Department of Medicine, Harvard Medical School, Boston, Massachusetts, USA.
3Department of Medicine II, University Hospital of Würzburg, Würzburg, Germany.
4Broad Institute of Massachusetts Institute of Technology (MIT) and Harvard, Cambridge, Massachusetts, USA.
5Department of Medical Oncology, Dana-Farber Cancer Institute, Boston, Massachusetts, USA.
6Department of Hematology-Oncology, Fundación Valle de Lili, Cali, Colombia.
7Pharmaceutical Sciences and Pharmacogenomics Graduate Program, UCSF, San Francisco, California, USA.
8Biotechnology Program, Department of Engineering and Technology, City College of San Francisco, San Francisco, California, USA.
9Preclinical Therapeutics Core, Helen Diller Family Comprehensive Cancer Center,
10Department of Microbiology and Immunology, and
11Parker Institute for Cancer Immunotherapy, UCSF, San Francisco, California, USA.
12Ludwig Center, Harvard Medical School, Boston, Massachusetts, USA.
13Department of Bioengineering and Therapeutic Sciences and
14Helen Diller Family Comprehensive Cancer Center, UCSF, San Francisco, California, USA.
15Chan Zuckerberg Biohub San Francisco, San Francisco, California, USA.
Address for correspondence. Arun P. Wiita, Department of Laboratory Medicine, University of California, San Francisco, 185 Berry Street Suite 290, Room 2410, San Francisco, California 94107, USA. Email: arun.wiita@ucsf.edu.
Find articles by Camara Serrano, J. in: PubMed | Google Scholar
1Department of Laboratory Medicine, University of California, San Francisco (UCSF), San Francisco, California, USA.
2Department of Medicine, Harvard Medical School, Boston, Massachusetts, USA.
3Department of Medicine II, University Hospital of Würzburg, Würzburg, Germany.
4Broad Institute of Massachusetts Institute of Technology (MIT) and Harvard, Cambridge, Massachusetts, USA.
5Department of Medical Oncology, Dana-Farber Cancer Institute, Boston, Massachusetts, USA.
6Department of Hematology-Oncology, Fundación Valle de Lili, Cali, Colombia.
7Pharmaceutical Sciences and Pharmacogenomics Graduate Program, UCSF, San Francisco, California, USA.
8Biotechnology Program, Department of Engineering and Technology, City College of San Francisco, San Francisco, California, USA.
9Preclinical Therapeutics Core, Helen Diller Family Comprehensive Cancer Center,
10Department of Microbiology and Immunology, and
11Parker Institute for Cancer Immunotherapy, UCSF, San Francisco, California, USA.
12Ludwig Center, Harvard Medical School, Boston, Massachusetts, USA.
13Department of Bioengineering and Therapeutic Sciences and
14Helen Diller Family Comprehensive Cancer Center, UCSF, San Francisco, California, USA.
15Chan Zuckerberg Biohub San Francisco, San Francisco, California, USA.
Address for correspondence. Arun P. Wiita, Department of Laboratory Medicine, University of California, San Francisco, 185 Berry Street Suite 290, Room 2410, San Francisco, California 94107, USA. Email: arun.wiita@ucsf.edu.
Find articles by Zeng, Y. in: PubMed | Google Scholar
1Department of Laboratory Medicine, University of California, San Francisco (UCSF), San Francisco, California, USA.
2Department of Medicine, Harvard Medical School, Boston, Massachusetts, USA.
3Department of Medicine II, University Hospital of Würzburg, Würzburg, Germany.
4Broad Institute of Massachusetts Institute of Technology (MIT) and Harvard, Cambridge, Massachusetts, USA.
5Department of Medical Oncology, Dana-Farber Cancer Institute, Boston, Massachusetts, USA.
6Department of Hematology-Oncology, Fundación Valle de Lili, Cali, Colombia.
7Pharmaceutical Sciences and Pharmacogenomics Graduate Program, UCSF, San Francisco, California, USA.
8Biotechnology Program, Department of Engineering and Technology, City College of San Francisco, San Francisco, California, USA.
9Preclinical Therapeutics Core, Helen Diller Family Comprehensive Cancer Center,
10Department of Microbiology and Immunology, and
11Parker Institute for Cancer Immunotherapy, UCSF, San Francisco, California, USA.
12Ludwig Center, Harvard Medical School, Boston, Massachusetts, USA.
13Department of Bioengineering and Therapeutic Sciences and
14Helen Diller Family Comprehensive Cancer Center, UCSF, San Francisco, California, USA.
15Chan Zuckerberg Biohub San Francisco, San Francisco, California, USA.
Address for correspondence. Arun P. Wiita, Department of Laboratory Medicine, University of California, San Francisco, 185 Berry Street Suite 290, Room 2410, San Francisco, California 94107, USA. Email: arun.wiita@ucsf.edu.
Find articles by
Steri, V.
in:
PubMed
|
Google Scholar
|

1Department of Laboratory Medicine, University of California, San Francisco (UCSF), San Francisco, California, USA.
2Department of Medicine, Harvard Medical School, Boston, Massachusetts, USA.
3Department of Medicine II, University Hospital of Würzburg, Würzburg, Germany.
4Broad Institute of Massachusetts Institute of Technology (MIT) and Harvard, Cambridge, Massachusetts, USA.
5Department of Medical Oncology, Dana-Farber Cancer Institute, Boston, Massachusetts, USA.
6Department of Hematology-Oncology, Fundación Valle de Lili, Cali, Colombia.
7Pharmaceutical Sciences and Pharmacogenomics Graduate Program, UCSF, San Francisco, California, USA.
8Biotechnology Program, Department of Engineering and Technology, City College of San Francisco, San Francisco, California, USA.
9Preclinical Therapeutics Core, Helen Diller Family Comprehensive Cancer Center,
10Department of Microbiology and Immunology, and
11Parker Institute for Cancer Immunotherapy, UCSF, San Francisco, California, USA.
12Ludwig Center, Harvard Medical School, Boston, Massachusetts, USA.
13Department of Bioengineering and Therapeutic Sciences and
14Helen Diller Family Comprehensive Cancer Center, UCSF, San Francisco, California, USA.
15Chan Zuckerberg Biohub San Francisco, San Francisco, California, USA.
Address for correspondence. Arun P. Wiita, Department of Laboratory Medicine, University of California, San Francisco, 185 Berry Street Suite 290, Room 2410, San Francisco, California 94107, USA. Email: arun.wiita@ucsf.edu.
Find articles by Aguilar, O. in: PubMed | Google Scholar
1Department of Laboratory Medicine, University of California, San Francisco (UCSF), San Francisco, California, USA.
2Department of Medicine, Harvard Medical School, Boston, Massachusetts, USA.
3Department of Medicine II, University Hospital of Würzburg, Würzburg, Germany.
4Broad Institute of Massachusetts Institute of Technology (MIT) and Harvard, Cambridge, Massachusetts, USA.
5Department of Medical Oncology, Dana-Farber Cancer Institute, Boston, Massachusetts, USA.
6Department of Hematology-Oncology, Fundación Valle de Lili, Cali, Colombia.
7Pharmaceutical Sciences and Pharmacogenomics Graduate Program, UCSF, San Francisco, California, USA.
8Biotechnology Program, Department of Engineering and Technology, City College of San Francisco, San Francisco, California, USA.
9Preclinical Therapeutics Core, Helen Diller Family Comprehensive Cancer Center,
10Department of Microbiology and Immunology, and
11Parker Institute for Cancer Immunotherapy, UCSF, San Francisco, California, USA.
12Ludwig Center, Harvard Medical School, Boston, Massachusetts, USA.
13Department of Bioengineering and Therapeutic Sciences and
14Helen Diller Family Comprehensive Cancer Center, UCSF, San Francisco, California, USA.
15Chan Zuckerberg Biohub San Francisco, San Francisco, California, USA.
Address for correspondence. Arun P. Wiita, Department of Laboratory Medicine, University of California, San Francisco, 185 Berry Street Suite 290, Room 2410, San Francisco, California 94107, USA. Email: arun.wiita@ucsf.edu.
Find articles by
Mitsiades, C.
in:
PubMed
|
Google Scholar
|
1Department of Laboratory Medicine, University of California, San Francisco (UCSF), San Francisco, California, USA.
2Department of Medicine, Harvard Medical School, Boston, Massachusetts, USA.
3Department of Medicine II, University Hospital of Würzburg, Würzburg, Germany.
4Broad Institute of Massachusetts Institute of Technology (MIT) and Harvard, Cambridge, Massachusetts, USA.
5Department of Medical Oncology, Dana-Farber Cancer Institute, Boston, Massachusetts, USA.
6Department of Hematology-Oncology, Fundación Valle de Lili, Cali, Colombia.
7Pharmaceutical Sciences and Pharmacogenomics Graduate Program, UCSF, San Francisco, California, USA.
8Biotechnology Program, Department of Engineering and Technology, City College of San Francisco, San Francisco, California, USA.
9Preclinical Therapeutics Core, Helen Diller Family Comprehensive Cancer Center,
10Department of Microbiology and Immunology, and
11Parker Institute for Cancer Immunotherapy, UCSF, San Francisco, California, USA.
12Ludwig Center, Harvard Medical School, Boston, Massachusetts, USA.
13Department of Bioengineering and Therapeutic Sciences and
14Helen Diller Family Comprehensive Cancer Center, UCSF, San Francisco, California, USA.
15Chan Zuckerberg Biohub San Francisco, San Francisco, California, USA.
Address for correspondence. Arun P. Wiita, Department of Laboratory Medicine, University of California, San Francisco, 185 Berry Street Suite 290, Room 2410, San Francisco, California 94107, USA. Email: arun.wiita@ucsf.edu.
Find articles by Wiita, A. in: PubMed | Google Scholar
Published November 9, 2026 - More info
JCI Insight. 2026;11(21):e203794. https://doi.org/10.1172/jci.insight.203794.
© 2026 Patiño-Escobar et al. This work is licensed under the Creative Commons Attribution 4.0 International License. To view a copy of this license, visit http://creativecommons.org/licenses/by/4.0/.
Received: December 22, 2025; Accepted: September 24, 2026

-
Results
CD48 expression and unsupervised NK ligand clustering stratify MM patients by cytogenetic risk and survival. To determine the landscape of CD48 expression in MM and its clinical relevance, we analyzed bulk RNA-seq data from CD138+ malignant plasma cells in the Multiple Myeloma Research Foundation CoMMpass (IA19) cohort (17). In this dataset, CD48 expression was elevated in several high-risk cytogenetic subgroups. Specifically, t(4;14) and gain(1q21) cases exhibited significant (P < 0.0001) CD48 upregulation relative to others, whereas t(11;14) (standard-risk) patients showed decreased CD48 (P < 0.0001). When tumors were stratified by CD48 expression, high CD48 levels in tumors were associated with significantly lower overall survival (P = 0.0044) (Figure 1A). These initial findings suggest the hypothesis that high MM tumor CD48 expression may be associated with reduced NK cell immunosurveillance, enabling tumor growth.
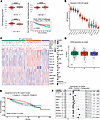 Figure 1
CD48 expression and unsupervised NK ligand clustering stratify MM patients by cytogenetic risk and survival. (A) Box plots display normalized log2 CD48 mRNA expression in CoMMpass (IA19) CD138+ samples stratified by cytogenetic subgroup. Comparisons between cytogenetic subgroups were performed using Wilcoxon’s rank-sum tests. Kaplan-Meier overall survival curves stratified by CD48 expression (top 20% vs. bottom 20%) in 774 patients; log rank. P < 0.0001 (B) Box plots of variance-stabilizing transformation–normalized (VST-normalized) expression for a panel of NK cell ligands across 774 MM samples. (C) Heatmap of scaled expression for the same NK ligands (rows) in all 774 CoMMpass patients (columns). Patients are arranged into 3 clusters: A (teal), B (orange), and C (purple). Sidebars annotate key cytogenetic features: t(4;14), t(11;14), MAF, del(17p13), MAFB, NSD2, relapse status, MYC gain, gain(1q21). (D) Box plots comparing CD48 log2 expression among clusters. (E) Kaplan-Meier curves for overall survival by NK ligand cluster. Global log rank across A, B, and C: P = 0.029. Pairwise log-rank P values B vs. C = 0.026; A vs. B = 0.085; A vs. C = 0.221. (F) Forest plot from a multivariate Cox proportional hazards model. Variables on the left include CD48 expression (high vs. low), cluster membership, relapse status, and cytogenetic risk factors. Hazard ratios (black squares) with 95% confidence intervals are plotted on a logarithmic scale.
Given the hypothesis that high CD48 expression may contribute to NK cell dysfunction in MM, we next asked whether CD48 upregulation occurs in the broader context of altered NK cell ligand expression on tumor cells. To address this, we applied variance-stabilizing transformation to normalize expression values and quantified a panel of established NK cell ligands, HLA-A/B/C/E, MICA/B, NECTIN2, PCNA, PVR, and ULBP1–3 (18), in addition to CD48, across the same MM cohort. As expected, classical HLA class I genes (HLA-A, -B, -C) ranked highest in mRNA expression; notably, CD48 was the next most abundant ligand on MM cells (Figure 1B). These mRNA-based findings are consistent with high surface protein abundance of these antigens as found in our previous proteomic studies (8). Hierarchical clustering of scaled ligand expression values revealed 3 distinct patient clusters: Cluster A exhibited intermediate expression across all NK ligand markers, along with high expression of PCNA. Cluster B was characterized by high expression of HLA-A, HLA-B, HLA-C, HLA-E, and MICA/B, while cluster C showed low HLA class I expression and elevated levels of CD226 ligands (NECTIN2, PVR) and ULBP2 (Figure 1C and Supplemental Figure 1A; supplemental material available online with this article; https://doi.org/10.1172/jci.insight.203794DS1). Notably, CD48 expression was comparable across all 3 clusters (Figure 1D). We further found these NK-relevant clusters correlated with key cytogenetic and clinical features. Cluster A was significantly enriched for CCND1 translocations (P < 0.001), gain(1q21) (P < 0.01), NSD2 status (P < 0.05), and relapsed disease (P < 0.01). In contrast, cluster B showed an overrepresentation of MAF-translocated patients (P < 0.05) (Supplemental Table 1). Kaplan-Meier analysis showed that overall survival differed across NK ligand clusters (global log rank across A, B, and C, P = 0.029). In pairwise tests, cluster B outperformed cluster C (B vs. C, P = 0.026), with a nonsignificant trend versus cluster A (B vs. A, P = 0.085); cluster A and cluster C did not differ (P = 0.221) (Figure 1E). In a multivariate Cox regression, including cluster membership, CD48 expression, relapsed status, and key cytogenetic variables, assignment to cluster B remained independently protective (P = 0.03), whereas CD48 expression alone did not retain significance (P = 0.89). As anticipated, del(17p13) and gain(1q21) (both P < 0.001) were independently associated with poorer survival (Figure 1F). Stage-stratified survival analyses in newly diagnosed (NDMM) and relapsed/refractory (RRMM) subgroups confirmed that CD48-high tumors were associated with inferior overall survival in univariate analysis (NDMM, P = 0.014; RRMM, P = 0.0089); however, CD48 expression was not independently prognostic in either subgroup after multivariate adjustment (NDMM, HR = 1.01, P = 0.85; RRMM, HR = 0.99, P = 0.99). NK ligand cluster B retained independent protective significance in NDMM (HR = 0.68, P = 0.02). The absence of independent significance for t(4;14), t(14;16)/t(14;20), and del(1p22) is consistent with the updated International Myeloma Society/International Myeloma Working Group framework, which designates these lesions as high-risk only in the context of co-occurring 1q gain (19) (Supplemental Figure 2, A–F).
Collectively, these data establish that CD48 is elevated in high-risk MM subgroups and that NK ligand expression patterns (particularly HLA class I) define patient clusters with distinct cytogenetic features and prognoses. In particular, the features defining cluster B are associated with superior survival, underscoring that a broader NK ligand landscape may be associated with anti-myeloma immunity and influences clinical outcomes. Furthermore, the results of our multivariate analysis suggest that CD48 expression alone is not an independent driver of poor prognosis, setting the stage for further investigation of its function in MM.
Combined chromatin profiling, machine learning, and functional screens identify candidate regulators of CD48 expression in myeloma. Motivated to understand what regulates CD48 expression in MM tumors, we first analyzed previously published assay for transposase-accessible chromatin using sequencing (ATAC-seq) and ENCODE chromatin immunoprecipitation sequencing (ChIP-seq) profiling data (20) from purified MM plasma cells, compared with normal donor plasmablasts and plasma cells. This analysis identified two MM-enriched accessibility peaks spanning the CD48 promoter region (±1 kb of the transcription start site). Transcription factor (TF) footprinting analysis of ATAC-seq combined with ChIP-seq experimental data implicated 89 TFs as potential CD48 regulators in primary MM tumors (Figure 2A). Leveraging the CoMMpass dataset, we then trained an eXtreme Gradient Boosting (XGBoost) (https://xgboost.readthedocs.io/) regression model to predict CD48 expression based on TF activity. The model explained approximately 40% of the variance in CD48 expression (R2 = 0.40) (Figure 2B). Feature importance was interpreted using SHAP (Shapley additive explanation) (https://shap.readthedocs.io/) values, which quantify each TF’s contribution to the predicted CD48 level across samples (positive SHAP values indicate genes whose higher expression predicts higher CD48 expression, whereas negative values indicate the opposite; Figure 2C). Notably, IRF4, a well-known driver of myelomagenesis (21–23), was among the strongest positive predictors of CD48, followed by TFAP2A, previously identified by our group as a regulator of CD70 in MM (24), another prognostic surface protein. Conversely, MEF2B emerged as a potential negative regulator. Correlation analyses in CoMMpass confirmed these associations: CD48 and IRF4 showed a moderate positive correlation (R = 0.42, P < 0.0001), whereas CD48 and MEF2B showed a weak negative correlation (R = –0.096, P = 0.0035) (Figure 2, D and E).
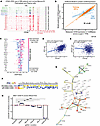 Figure 2
Combined chromatin profiling, machine learning, and functional screens reveal novel CD48 regulators in myeloma. (A) ATAC-seq tracks at the CD48 locus from normal memory B cells, plasmablasts, plasma cells, and primary MM samples. Two regions of enriched accessibility near the CD48 transcription start site are highlighted. (B) XGBoost model of observed versus predicted CD48 expression in CoMMpass samples (80% training, 20% test; R2 = 0.40). TMP, transcripts per million. (C) SHAP summary plot ranking transcription factors by their contribution to predicted CD48 expression; each dot represents one patient. (D and E) Correlation of CD48 expression with IRF4 and MEF2B in CoMMpass calculated using Pearson method. (F) Heatmap of average log2 fold change of sgRNAs in CRISPR-KO and CRISPRa screens comparing CD48-high and CD48-low populations across INA6, AMO1, and MM.1S cells. (G) STRING protein-protein interaction network of 52 overlapping CRISPR-KO/a hits, grouped by functional category. (H) Flow cytometric validation of surface CD48 after CRISPR/Cas9 knockout of ESRRA, MEF2B, TFAP2A, RELA, and CD48 in AMO1 cells. Bar graphs show surface CD48 mean fluorescence intensity (MFI) fold change (FC) relative to non-targeting scramble sgRNA control (dashed red line) following knockout of the indicated genes (n = 3 technical replicates; mean ± SEM). Pairwise comparisons with scramble control were performed using 2-sided Welch’s t test. ** P < 0.01; *** P < 0.001; absence of asterisks indicates no significant difference.
Integration of publicly available ATAC-seq profiles from CD14+ monocytes, CD19+ B cells, CD4+ helper T cells, CD8+ cytotoxic T cells, and NK cells (Gene Expression Omnibus GSE125164 and GSE89668, respectively; refs. 25, 26) with primary patient data revealed a bipartite chromatin accessibility pattern at the CD48 locus (Supplemental Figure 3 and Supplemental Table 2). Peak_1 was accessible across all hematopoietic lineages examined, consistent with constitutive broad CD48 expression. Peak_2 showed preferential accessibility in MM patient samples and cytotoxic lymphocytes, including CD8+ T cells and a subset of NK donors, suggesting a regulatory element whose activity may be shared between cytotoxic immune cells and myeloma. To further assess whether the predicted transcriptional regulators physically occupy the CD48 locus, we examined publicly available ChIP-seq datasets across hematopoietic and non-hematopoietic cell types (27–33). MEF2B, MEF2C, and RELA showed reproducible occupancy at the CD48 promoter in B-lymphoblastoid cells, overlapping the chromatin-accessible region identified in primary MM samples (Supplemental Figure 4 and Supplemental Table 2). In contrast, available TFAP2A datasets were derived primarily from non-plasma-cell contexts and did not provide consistent evidence of occupancy at this locus.
The context dependence of RELA occupancy at the CD48 locus was further supported by ChIP-seq data from HeLa cells (GSE116284) (31). RELA activity was confirmed by robust binding at the canonical NF-κB target TICAM1 under TNF-α stimulation, whereas no RELA enrichment was detected at the CD48 locus under any condition examined (Supplemental Figure 5). Similarly, TFAP2A showed no detectable occupancy at the CD48 locus in HCT116 parental cells or in 2 independent CRISPR/Cas9 AP-2α knockout clones (GSE155165) (30). Together, these findings support a cell context–dependent pattern of RELA and TFAP2A occupancy at the CD48 locus, potentially influenced by lineage-specific chromatin accessibility.
To complement the machine learning predictions focused on transcriptional regulators of CD48, we determined additional regulators of surface CD48 through genome-wide CRISPR knockout (CRISPR-KO) and activation (CRISPRa) FACS-based screens. These functional genomic screens across three MM cell lines (AMO1, INA6, and MM.1S) yielded 52 genes that reproducibly modulate CD48 surface expression (Figure 2F). STRING network analysis of these hits organized them into 5 clusters: (a) nuclear steroid receptor activity, (b) GPI-anchor biosynthesis, (c) ER-Golgi transport vesicle membrane components, (d) heme transmembrane transport activity, and (e) ubiquitin–ubiquitin ligase activity (Figure 2G). These groupings suggested that CD48 regulation occurs at multiple levels, from transcriptional control to posttranslational processing and membrane trafficking. Functional enrichment analysis using g:Profiler (34, 35) highlighted substantial biological themes consistent with these clusters (Supplemental Figure 1B), suggesting that CD48 regulation involves transcriptional, posttranslational, and membrane trafficking processes.
Based on the combined evidence from STRING network analysis, functional enrichment, CRISPR-KO/a screen concordance, and machine learning prediction, we selected for validation 4 top candidate regulators of surface CD48: estrogen-related receptor α (ESRRA), myocyte enhancer factor 2B/C (MEF2C/MEF2B), transcription factor AP-2α (TFAP2A), and RELA proto-oncogene, NF-κB subunit (RELA). These targets were subsequently validated through CRISPR-mediated knockout experiments in the AMO1 myeloma cell line performed in pooled populations rather than single-cell clones to minimize clonal variation and maintain a representative population context. For ESRRA, we achieved approximately 58% knockout efficiency, confirmed at the genomic level using the Synthego ICE (Inference of CRISPR Edits) tool (36) (Supplemental Figure 1C), which resulted in a significant increase in surface CD48 expression compared with AMO1 scramble sgRNA (P < 0.01) (Figure 2H). These data support CRISPR-KO/a screens’ findings that ESRRA represses CD48 and align with STRING and enrichment analyses. For TFAP2A, we achieved approximately 75% knockout efficiency, which correlated with a modest but statistically significant reduction in surface CD48 expression measured by mean fluorescence intensity (MFI) (P < 0.01) (Figure 2H and Supplemental Figure 1D), further validating its role as a positive regulator predicted by machine learning. RELA knockout resulted in a consistent reduction in surface CD48 MFI relative to scramble control (Figure 2H and Supplemental Figure 1F), confirming RELA as an additional positive regulator of CD48 expression in myeloma cells. This result is consistent with RELA occupancy at the CD48 promoter identified by ChIP-seq (Supplemental Figure 4), further validating the convergent multi-platform approach used to identify CD48 regulators. In contrast, MEF2B knockout was inefficient (~12%), resulting in only minimal decreases in surface CD48 levels (Figure 2H). An sgRNA targeting CD48 served as a positive control and demonstrated effective knockout (Supplemental Figure 1E).
Together, these data suggest that ESRRA functions as a putative repressor of CD48, whereas TFAP2A and RELA promote its expression; MEF2B could not be reliably evaluated as a regulator of CD48 because of insufficient knockout efficiency.
CD48 modulation influences NK cell cytokine production in vitro. Having identified transcriptional regulators of CD48 expression, we next sought to determine the functional consequences of modulating CD48 levels on NK cell activation using a controlled in vitro coculture system. We generated Vκ*MYC murine myeloma lines (37, 38) with stable Cd48 knockout (CD48KO) or Cd48 overexpression (CD48OE) (Supplemental Figure 6A). We then employed KIL C.2, a Jagged2-overexpressing murine NK cell line on a C57BL/6 background, capable of degranulation and cytokine secretion upon IL-2 stimulation and tumor coculture (39), to serve as effector (Figure 3A). KIL C.2 cells were cocultured with Vκ*MYC WT, CD48KO, and CD48OE targets at effector-to-target (E/T) ratios ranging from 30:1 to 1:10 for 24 hours. KIL C.2 cells exhibited baseline cytotoxicity against Vκ*MYC WT. Although CD48OE cells showed a trend toward higher lysis and CD48KO cells showed slightly reduced lysis compared with WT, none of these differences reached statistical significance (Figure 3B). Intracellular cytokine staining of KIL C.2 cells (gated as CD3–NK1.1+NKp46+) after 24 hours of coculture confirmed NK cell activation across all conditions. Coculture with CD48OE Vκ*MYC cells resulted in higher IFN-γ production compared with CD48KO targets and a modest increase in TNF-α, consistent with enhanced activation at E/T ratios of both 30:1 and 10:1. In contrast, CD48KO targets induced minimal IFN-γ and TNF-α expression (Figure 3C).
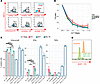 Figure 3
In vitro NK-tumor coculture assays demonstrate CD48-dependent cytokine responses and limited rescue by SHIP1. (A) Representative flow cytometry intracellular staining for murine IFN-γ, TNF-α, surface CD69, intracellular granzyme B, surface CD244, and surface CD48 after coculture with Vκ*MYC for 24 hours (effector/target 30:1) (representative of n = 3 biological replicates). (B) Percentage target-cell lysis of KIL C.2 against Vκ*MYC WT, CD48KO, and CD48OE across effector/target (E/T) ratios. Points represent mean ± SEM (n = 3 technical replicates). Pairwise Welch’s t tests at each E/T (P values; reported as WT vs. KO / WT vs. OE / KO vs. OE); 30:1 (0.494/0.548/0.954); 10:1 (0.295/0.184/0.077); 3:1 (0.902/0.422/0.413); 1:1 (0.967/0.510/0.183); 1:3 (0.582/0.436/0.613); 1:10 (0.876/0.351/0.373). No pairwise comparison reached P < 0.05. (C) Bar graphs show the percentage of KIL C.2 cells positive for granzyme B, IFN-γ, and TNF-α, measured at E/T = 30:1 (green), E/T = 10:1 (red), or ‘no-Vκ’ PMA/ionomycin control (blue) (n = 3 technical replicates). Pairwise comparisons between Vκ*MYC WT, CD48KO, and CD48OE were performed using 2-tailed t tests with Benjamini-Hochberg correction applied globally across all 18 comparisons. *P < 0.05, **P < 0.01, ***P < 0.001, ****P < 0.0001; absence of asterisks denotes no significant difference (P ≥ 0.05). (D) Flow cytometry histogram showing SHIP1 expression in KIL C.2 cells after CRISPR/Cas9 knockout of the Inpp5d gene (representative of n = 2 technical replicates).
To investigate whether SHIP1 contributes to NK cell dysfunction in myeloma, we generated SHIP1KO KIL C.2 lines (Inpp5d gene knockout) using CRISPR/Cas9, confirmed by intracellular staining and Synthego ICE analysis (indel = 94%, R2 = 0.95, knockout score = 94) (Figure 3D and Supplemental Figure 6B). SHIP1KO NK cells did not exhibit enhanced cytotoxicity against Vκ*MYC WT, CD48KO, or CD48OE targets at E/T ratios up to 30:1 after 24 hours (Supplemental Figure 6C). Thus, in this experimental system, SHIP1 deletion in KIL C.2 cells did not measurably enhance NK cell cytotoxicity.
Together, these results indicate that higher CD48 expression on myeloma cells is associated with enhanced NK cell cytokine production, most notably IFN-γ, in a CD48 density–dependent manner, whereas cytotoxic lysis was not significantly altered across CD48 expression conditions. In this experimental system, SHIP1 deletion in KIL C.2 cells did not measurably enhance cytotoxicity, suggesting that additional mechanisms beyond SHIP1 loss may be required to restore NK cell function in the myeloma microenvironment. These findings indicate that CD48 expression influences NK cell effector responses in myeloma and warrant further investigation to establish whether strategies targeting CD48 or its downstream signaling could help reinvigorate NK cell–mediated immunity in MM.
scRNA-seq reveals NK cell exhaustion signatures and dysregulated CD48-CD244 axis. To further explore CD48 and CD244 dynamics in myeloma primary tumors, we analyzed scRNA-seq data from 8 healthy donors (HDs) and 54 MM patients (GSE223060) (40) (Figure 4, A and B). To first examine the CD48-CD244 signaling axis, we compared expression across immune subsets from HDs and MM patients (Figure 4C). A dot plot of CD48 and CD244 expression revealed that CD48 was widely expressed across hematopoietic cell types in both MM and HDs, with the most prominent disease-associated difference observed in regulatory T cells (Figure 4D). In contrast, CD244 was expressed in NK cells and CD8+ T cells, with lower-level expression detectable in other immune cell populations. To further interrogate CD48-CD244 interactions in the myeloma microenvironment, we applied CellChat (41, 42) analysis to infer ligand-receptor signaling between immune and malignant populations using this single-cell transcriptomes dataset selecting samples with 25% or more plasma cells. Circular and chord diagrams highlighted a strong directional flow of signaling from plasma cells, monocytes, macrophages, and B cells toward NK cells (Figure 4, F and G). Among all CD48-mediated interactions identified, the CD48-CD244 pair was statistically significant in the communication network, linking CD48+ myeloma plasma cells to CD244+ NK cells (Figure 4E). Although the overall interaction probability was lower than those between CD4+ T cells or macrophages and NK cells, the CD48-CD244 connection remained one of the most statistically significant ligand-receptor pairs within the CD48-associated network and was not detected in HD samples by this method (Supplemental Figure 7A), consistent with selective engagement in the myeloma microenvironment. Inferred ligand-receptor analysis further revealed that CD48-CD244 signaling ranked among the statistically significant CD48-mediated interactions in MM, along with HLA-E and CD74 axes (Figure 4, E and H), which have also been described as key immune checkpoints in NK cells in myeloma (43). Although the CD48-CD244 connection appears less prominent than some other predicted interactions, CellChat identified it among the statistically significant and most representative ligand-receptor pairs linking plasma cells to NK cells in the MM microenvironment. Importantly, this interaction was not detected in HD samples, supporting its disease-specific relevance. Additional strong signaling routes were inferred from T cells and monocytes to NK cells, consistent with the broader immune activation context in MM. Overall, these findings indicate that CD48-CD244 communication is preferentially represented in myeloma and may contribute to altered NK cell signaling within the tumor microenvironment.
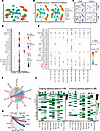 Figure 4
Single-cell RNA-seq and CellChat analysis reveal CD48-CD244 signaling between malignant plasma cells and NK cells in myeloma. (A) UMAP visualization of cell types identified across healthy donor (HD) and MM samples based on scRNA-seq data (GSE223060). (B) UMAP split by condition (HD vs. MM), showing shared immune populations across disease states. (C) Feature plots showing expression of CD48 and CD244 across all cells. (D) Dot plot showing CD48, CD244, and TNFRSF17 expression in HD (blue) and MM (red). Dot size indicates percentage of expressing cells; color intensity indicates scale average expression. (E) Dot plot of individual ligand-receptor pairs predicted by CellChat to interact with NK cells. Circle size represents statistical significance (permutation test P value), and circle color indicates communication probability. Among these, CD48-CD244 is highlighted as a significant and strong predicted interaction, suggesting that it is one of the dominant NK cell communication axes in MM. (F) Chord diagram generated using CellChat, illustrating CD48 signaling pathway network from plasma cells, monocytes, macrophages, and B cells, predominantly targeting NK cells. (G) Circle plot showing CD48 signaling pathway network depicting directional CD48 signaling interactions, highlighting strong engagement from CD48+ immune and malignant cells to CD244+ NK cells. (H) Heatmaps of outgoing and incoming signaling strength across cell types in MM, as inferred by CellChat. Interaction strength reflects the relative contribution of each signaling pathway to intercellular communication. The CD48-CD244 axis is highlighted within this broader network of significant signaling pathways.
Building on this predicted cell-cell interaction network, we next examined how sustained CD48-CD244 engagement might contribute to the altered transcriptional and functional state of NK cells in MM. Compared with HD-NK cells, MM-NK cells exhibited significantly higher expression of the inhibitory phosphatase SHIP1 (INPP5D; Wilcoxon P = 0.0012) and the activating phosphatase SAP (SH2D1A; Wilcoxon P = 0.0029) (Figure 5C). These findings suggest that phosphatase-mediated signaling is altered in the myeloma microenvironment, indicative of NK cell re-education. Within the NK cell compartment, we identified an MM-enriched subcluster displaying a “CMV adaptive-like” CD56-dim phenotype (44, 45) (Figure 5, A and B, and Supplemental Figure 7F), consistent with the recently described NK3 subset (46). This population corresponded to cluster 1 and was defined primarily by a receptor repertoire shift, including upregulation of KLRC2 and KLRC3 together with downregulation of KLRB1 and KLRF1 (Supplemental Figure 7B). By contrast, cytotoxic effector genes including GNLY, PRF1, NKG7, and FGFBP2 were broadly expressed across NK cells in both MM and HD samples (Figure 5B) and were not specific to this subcluster. The cluster-specific marker heatmap further supports the distinct transcriptional identity of cluster 1 relative to other NK cell subclusters (Supplemental Figure 7F).
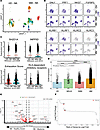 Figure 5
Single-cell RNA-seq reveals NK cell exhaustion signatures and dysregulated CD48-CD244 axis in human MM. (A) UMAP of NK cell subclusters only from 8 healthy donors (HD) and 54 MM patients from GSE223060. (B) Top: UMAP feature plots of key NK cell cytotoxicity and receptor genes. Bottom: Receptor genes related to adaptive CMV CD56-dim phenotype. (C) Violin plots compare expression and calculated scores in HD-NK (orange) versus MM-NK (green); comparisons were performed using Wilcoxon’s rank-sum tests. (D) Box plot of CD48 expression in plasma cells across 4 groups: control (blue), MGUS (green), SMM (pink), and MM (orange), from more than 200 samples from 182 individuals with MM, MGUS, and SMM and non-cancer controls (52). Global Kruskal-Wallis: P < 0.0001. Dunn’s post hoc pairwise tests: HD vs. MGUS, P = 3.37 × 10⁻¹³; HD vs. SMM, P = 0.193; HD vs. MM, P = 2.82 × 10⁻²⁶; MGUS vs. SMM, P = 3.34 × 10⁻¹⁵; MGUS vs. MM, P = 0.540; SMM vs. MM, P = 1.90 × 10–141. ****P < 0.0001. (E) Volcano plot of differential gene expression in NK cells (MM vs. HD) from GSE223060. (F) Rank plot of gene expression fold changes in HD-NK versus MM-NK (HD > 0, MM <0) from a bigger MM and HD cohort (MM, n = 61; HD, n = 91) (52).
Further underscoring NK cell dysfunction in MM, an exhaustion module score, calculated via SCENIC AUCell (47) using a published gene set (45, 48), was markedly higher in MM-NK than in HD-NK cells (Wilcoxon P < 0.0001) (Figure 5C). Exhaustion scores were broadly distributed across NK subclusters in MM rather than enriched in a single population. CD56 expression (NCAM1) did not correlate with exhaustion score in MM (R = 0.017, P = 0.26) or HD (R = 0.007, P = 0.8), suggesting that the exhaustion is not associated with CD56 expression (Supplemental Figure 8, A–C). In parallel, HLA-dependent inhibitory receptors were significantly upregulated in MM-NK cells (Wilcoxon P < 0.0001), whereas HLA-independent inhibitory checkpoints showed no significant difference (P = 0.74) (Figure 5C and Supplemental Figure 7D).
Differential expression analysis (HD vs. MM) further revealed that the AP-1 family members c-Fos (FOS), c-Jun (JUN), JunB (JUNB), FosB (FOSB), and CD69 were markedly downregulated in MM-NK cells at the population level (log2 fold change range: –1.5 to –2.8; adjusted P < 0.0001) (Figure 5, E and F). Subcluster-level analysis suggests that this downregulation reflects 2 complementary mechanisms: first, a compositional shift driven by the near-complete depletion of cluster 2 in MM, the predominant AP-1–high NK population (636 HD vs. 11 MM cells); and second, a cell-intrinsic reduction in AP-1 expression within individual NK subclusters, as evidenced by consistently lower AP-1 expression in MM compared with HD cells within cluster 7, which is comparably represented in both conditions (185 HD vs. 192 MM cells) (Supplemental Figure 8D). In contrast, BATF was relatively enriched in MM-NK cells (Wilcoxon P < 0.0001) (Supplemental Figure 7C), consistent with its known role as a core TF and key driver of NK cell dysfunction in other hematological malignancies such as acute myeloid leukemia (49). Loss of AP-1 activity has been linked to impaired NK maturation, reduced cytokine production (IFN-γ, TNF-α), and diminished NKG2D expression, mirroring phenotypes seen in murine myeloid leukemia and exhausted chimeric antigen receptor (CAR) T models (50, 51).
To validate these AP-1 findings in a larger cohort, we examined a publicly available scRNA-seq dataset containing more than 200 samples from 182 individuals with MM, monoclonal gammopathy of undetermined significance (MGUS), and (smoldering multiple myeloma) SMM and non-cancer controls (52). Core AP-1 family members, including FOS, JUN, and JUNB, showed progressive downregulation from HD through MGUS, SMM, and MM, while NK cell exhaustion scores were modestly but significantly increased in SMM and MM (Supplemental Figure 9, A and B). De novo subclustering of HD- and MM-NK cells further identified marked disease-associated compositional segregation, with AP-1 expression consistently higher across HD-enriched than MM-enriched subclusters (Supplemental Figure 9, C and D). Importantly, within cluster C1, which was comparably represented in HD and MM, AP-1 expression remained higher in HD-NK cells, independently corroborating a cell-intrinsic component of AP-1 suppression. Together, these cross-dataset findings support the conclusion that AP-1 suppression in MM-NK cells reflects both compositional and cell-intrinsic mechanisms, consistently observed across 2 independent cohorts.
Overall, these data demonstrate that MM-NK cells display a combination of heightened activating receptor expression and co-occurring exhaustion signatures, characterized by increased inhibitory receptor and phosphatase expression, AP-1 downregulation, and reduced CD69, reflecting a dysfunctional state in the myeloma microenvironment likely driven by chronic stimulation. Although this environment includes CD48-CD244 engagement among many MM-specific ligand-receptor interactions not observed in healthy donors, the transcriptional features described here do not establish CD48 as a unique or direct mechanistic driver of these NK cell changes.
NK cell depletion accelerates MM progression in Vκ*MYC mouse model. To assess tumor engraftment and the immunocompetent microenvironment, we used the syngeneic Vκ*MYC model (Vκ32245 line) (38), a non-secretory myeloma line we lentivirally transduced with enhanced firefly luciferase (effLuc) and mCherry to enable in vivo tracking. To evaluate potential immunogenic rejection, we compared engraftment of Vκ*MYC effLuc/mCherry in NSG versus C57BL/6J mice (Supplemental Figure 10A). We additionally engineered a Vκ*MYC effLuc/mCherry line to express dCas9-KRAB-mTagBFP2 for CRISPR interference (CRISPRi), together with a doxycycline-inducible sgRNA vector (53). As proof of concept, CRISPRi activity was validated by targeting of murine Sdc1 (mCD138) and confirmed by flow cytometry (Supplemental Figure 10E). In C57BL/6J mice, effLuc signal emerged approximately 1 week later than in NSG controls, in both the effLuc-only and effLuc-dCas9 lines. This delay may reflect a combination of immune surveillance effects and reduced bioluminescence sensitivity due to darker skin and hair pigmentation in the C57BL/6 background, while still demonstrating successful engraftment and in vivo tracking (Supplemental Figure 10, A and B).
After confirming that Vκ*MYC cells engraft and emit luminescence in C57BL/6J mice, we injected 1 × 10⁶ effLuc-tagged Vκ*MYC WT cells intravenously into C57BL/6 mice. NK cells were depleted with anti-NK1.1 (clone PK136; 200 μg i.v. twice weekly; see Methods) or an isotype control (Figure 6A). Flow cytometry of peripheral blood (CD3–NK1.1+NKp46+) confirmed greater than 98% NK cell depletion by day 7, which persisted through day 42 (Figure 6B and Supplemental Figure 10C). Bioluminescence imaging showed accelerated tumor growth in NK-depleted mice by day 21 in comparison with isotype-treated controls (Figure 6, C and D). Correspondingly, NK-depleted mice had shorter median survival (Supplemental Figure 10D).
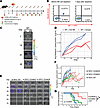 Figure 6
In vivo Vκ*MYC NK cell depletion and CD48 overexpression impact tumor engraftment and survival. (A) Experimental timeline and schematic of NK cell depletion and IgG control using Vκ*MYC WT cells injected into C57BL/6 mice. (B) Representative flow cytometry plots for NK cell detection on peripheral blood. NK cells (NK1.1+NKp46+) before and after depletion (n = 2 per arm). (C) Serial bioluminescence imaging (BLI) images of Vκ*MYC WT tumors in C57BL/6J mice under NK depletion antibody (dAb) or isotype control (Iso) (n = 2 per arm). Color scale indicates radiance (photons/s/cm2/sr). (D) Quantification of BLI signal over time for Vκ*MYC WT plus anti-NK1.1 antibody or IgG isotype control. (E) Representative BLI images for WT, CD48KO, and CD48OE (n = 6 per arm). (F) Individual longitudinal BLI trajectories for each mouse bearing Vκ*MYC WT, CD48KO, or CD48OE cells (n = 6 per arm). (G) Kaplan-Meier survival curves for mice injected with Vκ*MYC WT, CD48KO, or CD48OE cells tested by log-rank test.
These results confirm that the Vκ*MYC model is a robust system with reliable tumor tracking via firefly luciferase–based bioluminescence, while the CRISPRi-engineered line offers a versatile tool for functional studies. Importantly, NK cell depletion in this immunocompetent model led to accelerated disease progression, highlighting the critical role of NK cells in controlling myeloma.
CD48 overexpression in Vκ*MYC myeloma cells slows disease progression and prolongs survival. Given the critical role of NK cells in controlling myeloma progression, we next investigated whether modulating tumor-intrinsic CD48 expression could impact engraftment dynamics and disease outcome in vivo.
When 1 × 10⁶ CD48OE cells were injected intravenously into naive C57BL/6 mice (n = 6 per arm), engraftment occurred by day 14, but subsequent tumor progression was significantly slower than in WT or CD48KO, despite similar initial engraftment (Figure 6, E and F). Correspondingly, median survival extended from 40 days (WT) to 68 days (CD48OE; log rank P = 0.0037) (Figure 6G). CD48KO tumors exhibited engraftment kinetics similar to that of WT, likely reflecting the low endogenous CD48 expression in WT (Supplemental Figure 6A), which appears insufficient to produce a detectable difference in tumor progression in vivo despite contributing to measurable NK cell cytokine responses in the more sensitive in vitro coculture system (Figure 3C).
Together, these results support that CD48 overexpression on Vκ*MYC cells slows tumor progression and prolongs survival in immunocompetent mice. Although the CD48OE line engrafted at the same time as controls, it exhibited markedly slower growth, translating into extended median survival. These findings confirm that CD48 overexpression impairs tumor progression in vivo, underscoring CD48’s role in modulating anti-myeloma immunity.
Ex vivo NK cell functional impairments mirror transcriptomic exhaustion. As CD48 overexpression altered tumor progression, we next examined whether it also influenced NK cell functional status. Splenic and bone marrow NK cells were isolated at terminal disease from Vκ*MYC tumor-bearing mice (WT, CD48KO, CD48OE) and naive controls and assessed ex vivo by plate-bound stimulation (Figure 7, A and B).
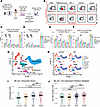 Figure 7
Ex vivo NK cell functional impairments and scRNA-seq dynamics in Vκ*MYC model. (A) Workflow schematic for ex vivo NK cell functional assays. Spleens and bone marrow (BM) were harvested from Vκ*MYC-bearing (WT, CD48KO, CD48OE) and naive control mice. Single-cell suspensions of NK cells were incubated in high-binding 96-well plates coated with specific antibodies (anti-NK1.1, anti-CD244), isotype control (mIgG2a), or PBS negative controls for 6 hours. After stimulation, NK cell activation and degranulation were assessed by flow cytometry (intracellular IFN-γ, surface CD107a). (B) Representative flow cytometry gating for ex vivo NK activation in spleen and BM. (C–F) Splenic and BM NK cell IFN-γ secretion and CD107a degranulation. Bar graphs show the percentage of IFN-γ+ and CD107a+ NK cells in spleen- and BM-derived NK cells from naive control, Vκ*MYC WT, CD48KO, and CD48OE groups after stimulation with anti-NK1.1, anti-CD244, isotype (mIgG2a), PBS, or PMA/ionomycin (naive, n = 4; tumor-bearing groups, n = 6 per genotype). Pairwise comparisons were performed using pairwise t tests, with P values adjusted using the Benjamini-Hochberg method applied globally across all 30 pairwise comparisons per panel. (G) UMAP projection of scRNA-seq data from Vκ*MYC BM samples (GSE134370). Major hematopoietic cell populations are color-coded and labeled. (H) Split UMAPs showing 4 different subgroups and batch reduction. Control, newly diagnosed (ND), MM, and advanced MM (AMM) samples from the immunocompetent Vκ*MYC model. (I and J) Violin plots of exhaustion and murine orthologs of the HLA-dependent inhibitory AUCell score for individual NK cells in 4 groups: control, ND, MM, and AMM. Pairwise comparisons were performed using Wilcoxon’s rank-sum tests with Benjamini-Hochberg correction. *P < 0.05; **P < 0.01; ***P < 0.001; ****P < 0.0001.
NK cells from tumor-bearing mice exhibited marked impairment in IFN-γ secretion and CD107a upregulation in response to anti-NK1.1 or anti-CD244 stimulation, regardless of CD48 status, compared with robust responses in naive NK cells (Figure 7, C–F). These defects were consistent across both spleen and bone marrow, indicating a broad functional impairment consistent with NK cell dysfunction (Supplemental Figure 11, A and B).
Notably, even under PMA/ionomycin stimulation, CD48OE-derived NK cells trended toward lower cytokine output than WT or CD48KO groups, suggesting a potential additive exhaustion phenotype in the myeloma microenvironment in the syngeneic Vκ*MYC model (Figure 7, C–F).
Together, these data demonstrate that NK cells from tumor-bearing mice are functionally exhausted ex vivo, regardless of CD48 status on Vκ*MYC, highlighting the profound immunosuppressive effects of the myeloma niche.
scRNA-seq data reveal NK cell functional dynamics across myeloma progression in the Vκ*MYC model. Finally, to complement our experimental studies above, we leveraged scRNA-seq data from a de novo Vκ*MYC mouse cohort across stages of disease progression (GSE134370) (54) in the C57BL/6/KaLwRij background (control, n = 3; early MM [newly diagnosed, ND], n = 5; intermediate MM [MM], n = 3; advanced MM [AMM], n = 7) (Figure 7, G and H, and Supplemental Figure 12, A, B, and D), with stages defined by serum M-protein levels. The de novo Vκ*MYC model is substantially more indolent than the transplanted Vκ*MYC model, providing a longer period of tumor–NK cell interaction and potentially greater opportunity for chronic stimulation and exhaustion; therefore, the two models may not be directly comparable. Among MYC+ myeloma plasma cells with detectable Cd48 expression, Cd48 levels were highest in advanced disease (AMM), significantly exceeding both ND and MM stages (P < 0.0001) (Supplemental Figure 12A), paralleling the increased CD48 expression observed with disease progression in human myeloma (Figure 5D). We calculated eight NK cell module scores (cytotoxicity, inflammatory response, stress response, murine orthologs of HLA-dependent inhibitory receptors, HLA-independent inhibitory receptors, HLA-dependent activating receptors, HLA-independent activating receptors, and exhaustion).
Although cytotoxicity module scores were low overall across all groups, NK cells from MM and AMM mice showed a modest but statistically significant reduction in comparison with controls (Supplemental Figure 11D), whereas ND mice showed no difference relative to controls. In contrast, the HLA-independent activating receptor score increased progressively from control to MM and AMM (Supplemental Figure 11C), suggesting an inflammatory NK cell phenotype in the absence of effective tumor control (Supplemental Figure 11, C–H). Exhaustion scores were significantly elevated in MM compared with control and rose further in AMM (Figure 7I). Finally, murine orthologs of HLA-dependent inhibitory receptor expression were elevated in both MM and AMM groups relative to controls (Figure 7J).
De novo NK cell subclustering identified 9 transcriptionally distinct populations but no discrete MM-specific AP-1–low subcluster. Rather, disease progression was associated with stage- and subcluster-specific remodeling of activating (Klrk1, Klrc2, Ncr1) and inhibitory/exhaustion-associated (Klrc1, Pdcd1, Tigit) receptor programs across preexisting NK cell states, while AP-1 family expression remained largely preserved (Supplemental Figure 12, B and C).
Overall, NK cells show progressive functional impairment, characterized by loss of cytotoxicity and rising exhaustion, alongside increased Cd48 expression in malignant plasma cells with disease progression. Notably, these murine NK cell transcriptomic profiles parallel key patterns observed in human MM scRNA-seq datasets, where NK cells likewise exhibit stepwise increases in inflammatory and exhaustion signatures.


